EVOLUTION AND STRUCTURE OF “SUSTAINABLE DEVELOPMENT”: A BIBLIOMETRIC STUDY
Antonio Pulgarín
University of Extremadura, Department of Information and Communication, Badajoz – Spain, [email protected]
Pieta Eklund
University of Borås, Library and Learning Resources, Borås, Sweden, [email protected] Ramón Garrote
University of Borås, Library and Learning Resources, Borås, Sweden, [email protected] Maria Isabel Escalona-Fernández
University of Extremadura, Central Library, Cáceres, Spain, [email protected]
ABSTRACT
Sustainable development is an interdisciplinary subject that has developed dramatically over the last few decades. Bibliometrics offers quantitative analytical techniques with which to study the development and growth of research in this area. The information used for the present study was retrieved from the SCI-EXPANDED, SSCI, and A&HCI (Thomson Reuters) databases. The search was made on the topic "Sustainable development", limited to Document Types (Article) and Time Span (1900-2013). The result was a total of 13 093 articles retrieved. During the last 10 years, the annual (exponential) growth rate has been 12%,
corresponding to a 6-year doubling time. The productivity of the authors varied widely. The 23 290 occurrences of the articles were distributed among 218 Web of Science categories.
"Environmental Sciences" was the top-ranked category, with 3427 occurrences (by itself accounting for more than 26% of the total, and presenting the greatest diversity), followed by "Environmental Studies" (2417), "Ecology" (1046), and "Economics" (933). The methodological approach taken in the present work could be used to describe the structure of any other scientific field and its relationships with other disciplines, and to visualize the relationship between the different WoS categories conforming the subject under study.
Keywords: Sustainable development; bibliometric study; scientific production; Web of Science category.
1 INTRODUCTION
accepted (Culture as a goal in the POST-2015 Development Agenda 2013). The most widely used definition of sustainable development is that of the WCED: "Development that meets the
needs of the present without compromising the ability of future generations to meet their own
needs" (World Commission on Environment and Development 1987). In other words,
sustainable development aims to allow all people to live their lives and meet their needs today while preserving the possibility of equal opportunities for living in the future, all within the limitations of the ecosystem.
While the concept of sustainable development allows a variety of interpretations reflecting the worldviews of different groups of people, organizations, and societies, one can identify three essential discourses even though their boundaries may be somewhat fuzzy: sustainable development as integration, as limitation, or as change (Hugé et al. 2013). As integration, sustainable development is seen as the overarching concept linking issues, interests, and stakeholders' philosophical and political views. Negatively, it is criticized for being so general that it allows those with opposing views to formulate their objectives within apparently the same concept. Positively, however, this same property allows varying views to come together under a single unifying idea. As limitation, sustainable development deals with the constraint involved in the finite capacity of the Earth's ecosystem and available resources to meet the needs of a growing human population. As change, sustainable development is seen as an ongoing
process rather than something fixed for all time (Hugé et al. 2013).
Research in the area of sustainable development has developed considerably over the last few decades. The annual number of articles with "sustainability" or "sustainable" in their bibliographic records has risen from some 3000 in 2007 (Kajikawa et al. 2007) to about 12 000 now (Kajikawa, Tacoa, and Yamaguchi 2014). This rapid growth has not really been surprising since many disciplines of science and technology have long been expected to contribute to developing a sustainable society.
now merging, implying closer connections and consequently a changing research landscape. The Business cluster has closed the gap with the others, while some other clusters, such as Health, Energy, or Water, still maintain their previously observed independence (Kajikawa, Tacoa, and Yamaguchi 2014). The change in the sustainability research landscape also indicates that it is becoming even more interdisciplinary in nature, and that researchers, especially those in social science and economics, are broadening their potential audience (Schoolman et al. 2012).
Although the body of sustainable development research is growing and the area has developed its own expertise (Kajikawa, Tacoa, and Yamaguchi 2014), it is unclear how far its interdisciplinary, multidisciplinary, and transdisciplinary nature has led it to progress as a scientific discipline (Bettencourt and Kaur 2011).
The objective of bibliometrics is to analyse by means of quantitative (statistical and mathematical) methods a body of literature to extract the possible relationships connecting the elements of which it is comprised. In particular, bibliometrics provides analytical techniques with which to evaluate scientific activity. These techniques offer a quantitative perspective from which to study the development and growth of research on any topic, an example being that of the present work: "Sustainable development".
Bibliometric methods have been extensively applied to different fields of research, to
authors' affiliations, institutions, countries, journals, citation habits, etc. Some of the fields that have been studied recently are Information Science (Chang and Huang 2012), Energy Efficiency (Du et al. 2013), and Chemical Engineering in Spain (Lagar-Barbosa, Escalona-Fernández and Pulgarín 2014).
Regarding interdisciplinarity, various studies have measured aspects of this property, for example, by mapping the relationships among disciplines (Bordons, Morillo, and Gómez 2003, Morillo, Bordons, and Gómez 2004). Only a few, however, have dealt with subjects relating to the environment – climate, sustainability, etc. (Stanhill 2001, Engels, Ruschenburg, and Weingart 2005, Janssen, Schoon, and Börner 2006, Jappe 2007, Ruschenburg and Engels 2008, Bjurström and Polk 2011, Quental and Lourenço 2012). Indeed, the property is more often operationalized without bibliometrics by taking an approach considering collaboration or integration (Porter et al. 2007).
2 METHODOLOGY
The information (i.e., that contained in bibliographic records) used for the present study was obtained from the SCI-EXPANDED, SSCI, and A&HCI databases, all belonging to Thomson Reuters' WoK platform.
The search equation used for the overall study was:
TS = "Sustainable development", limited to DT ("Article") and Time Span ("1900-2013"). The search, which was run in the early days of April 2014, yielded 13 093 articles.
Three individual countries were studied separately (Brazil, Spain, and Sweden). For them, the search equations were:
TS = "Sustainable development" and CU = "Brazil", etc.
We then proceeded to the option 'Analyse Results' for the Web of Science (WoS) Categories, Authors, Countries, Languages, Publication Years, and Source Titles. In all cases, we obtained the ranking, ordered from highest to lowest 'Record Count'.
To construct the data matrix relating the different WoS categories which would be used to construct a map of those relationships, we operated as follows. In the category ranking, we select one, for example, ECONOMICS (see Illustration 1 below).
Illustration 1
Web of Science Categories Record Count % of 13 093
ENVIRONMENTAL SCIENCES 3507 26.266 %
ENVIRONMENTAL STUDIES 2480 18.574 %
ECOLOGY 1053 7.886 %
ENGINEERING ENVIRONMENTAL 954 7.145 %
ECONOMICS 940 7.040 %
ENERGY FUELS 862 6.456 %
Illustration 2
Web of Science Categories Record Count % of 940
ECONOMICS 940 100.000 %
ENVIRONMENTAL STUDIES 336 35.745 %
ENVIRONMENTAL SCIENCES 263 27.979 %
For this specific area, there were 336 documents published under ECONOMICS and ENVIRONMENTAL STUDIES together, and 263 documents under ECONOMICS and ENVIRONMENTAL SCIENCES together. There were no documents published under ECONOMICS and WATER RESOURCES, for example, since none appeared in the list below ECONOMICS.
In this way, it was seen that ECONOMICS went together with exactly 30 more categories in 1581 occurrences (including the 280 occurrences in which it was the only category). One can also see how many categories publish completely separately, how many with just one other category, how many with two other categories, etc., as well as how the topic "Sustainable development" is distributed in terms of the WoS categories.
Four symmetric, square, category co-occurrence matrices were constructed, one general and the other three to compare the research carried out in different countries – Brazil, Spain, and Sweden. The general matrix had to be normalized, standardizing the Euclidean norm to
unity using the "Euclidean" module of the UCINET software package (Borgatti, Everett and, Freeman 2002). This is achieved by dividing the matrix by the Euclidean norm. The cells in the different matrices represent the number of times two WoS categories appear together in the articles analysed. This provides the information needed to map the knowledge space based on the presence of the topic "Sustainable development" in published research.
3 RESULTS
3.1 Yearly evolution of the scientific literature on "Sustainable development"
Running the search in WoS for the period 1900-2013 retrieved a total of 13 093 documents. Despite the length of the allowed Time Span, the oldest article actually found was dated 1981.
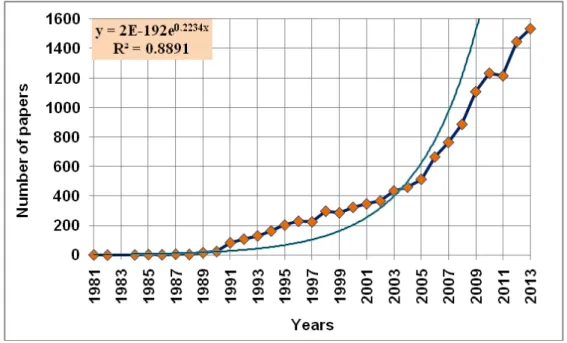
Figure 1 shows the yearly evolution of the scientific literature on the subject under study. The first decade in which articles appear, the 1980s, had a very low production, with no year exceeding 20 articles. The scientific production took off in the 1990s, reaching nearly 300 articles in 1999. Rapid growth continued in the last 14 years studied. In the first part of this period, until 2005, annual production rose to 500 articles. In the second part, growth has been even faster, reaching 1500 articles in 2013.
Figure 1: Annual evolution of scientific production on "Sustainable development".
The growth over the years has been exponential (slope = 0.223 and r = 0.94 for a straight line fit to the semi-log plot), representing an annual growth rate of 22% annually. In the last 10
years, the growth rate was 12%, corresponding to a doubling time of 6 years. The scientific production of the last five years (6531 articles) represented 50% of the entire output.
3.2 Production by country
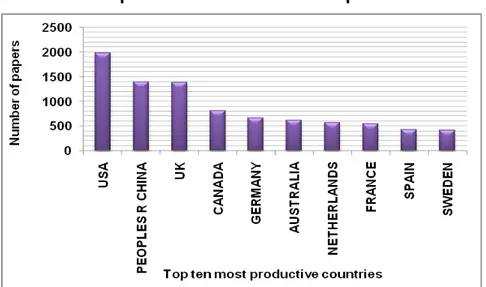
top 35 accounted for over 90% of the total output. Figure 2 shows the production of the top 10 countries, accounting for close to 70% (67.4%) of the total output.
Figure 2: Scientific production of the 10 most productive countries.
The United States of America, with a production of nearly 2000 (1979) articles is the country with most articles published on the topic. China, with 1400 articles, is second, followed by the UK (1386) and, at some distance, Canada and the rest of the ten countries of Fig. 2.
3.3 Language
Figure 3 shows the distribution of articles on "Sustainable development" according to the language in which they were published. The languages are indicated along the X-axis, and the number of documents on a logarithmic scale on the Y-axis. Although the distribution is very diverse in that 27 different languages are represented, English accounts for over 93% of the
articles. It is followed far behind by the rest, with the next being French, Spanish, and German accounting for just over 1% each.
3.4 Author productivity
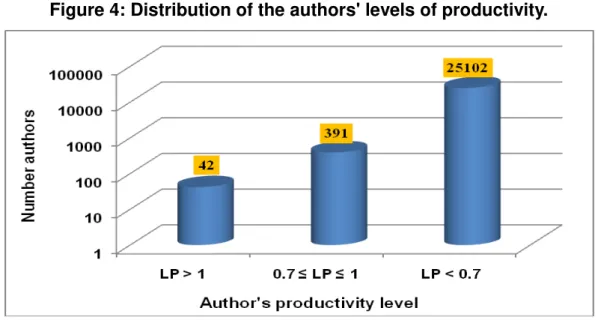
The productivity of the authors was classified into three levels: (a) high, with a level of productivity (LP) > 1 corresponding to over 10 articles published; (b) medium,, with LP 0.7 ≤ LP ≤ 1, corresponding to from 6 to 10 articles; and (c) low, with LP < 0.7, corresponding to at most 5 articles. Figure 4 shows the distribution of the population of authors among these three levels of productivity, with the number of authors being represented on a logarithmic scale.
The 42 authors with high productivity published a total of 624 articles; the 391 authors with medium productivity published a total of 2406 articles; and the 25 102 authors with low productivity published a total of 10 063 articles.
The most productive author (KAYGUSUZ K) had published 31 articles.
Figure 4: Distribution of the authors' levels of productivity.
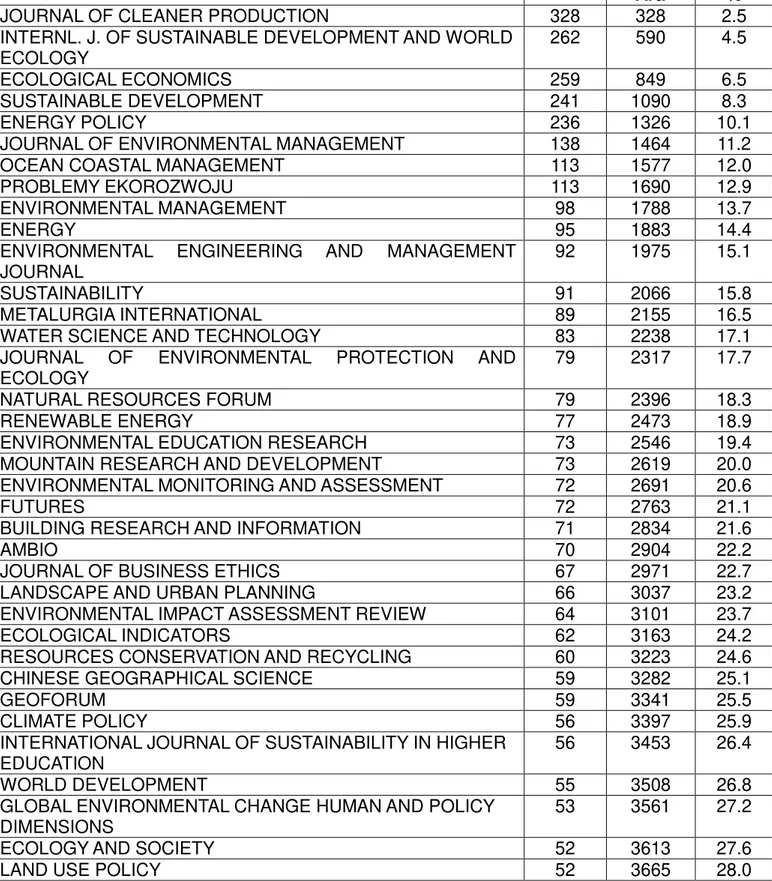
3.5 Dispersion of the scientific literature by journal
The total number of sources (journals) in which articles on "Sustainable development" were published was 2531. Table 1 lists the 36 journals with a scientific production of more than 50 articles. They accounted for approximately 30% of the total output of articles (3665). The JOURNAL OF CLEANER PRODUCTION, with 328 articles, was the most productive, followed
Table 1: Journals with more than 50 articles (together accounting for ≈30% of the total production).
Journals Articles Cum.
Art.
Cum. %
JOURNAL OF CLEANER PRODUCTION 328 328 2.5
INTERNL. J. OF SUSTAINABLE DEVELOPMENT AND WORLD ECOLOGY
262 590 4.5
ECOLOGICAL ECONOMICS 259 849 6.5
SUSTAINABLE DEVELOPMENT 241 1090 8.3
ENERGY POLICY 236 1326 10.1
JOURNAL OF ENVIRONMENTAL MANAGEMENT 138 1464 11.2
OCEAN COASTAL MANAGEMENT 113 1577 12.0
PROBLEMY EKOROZWOJU 113 1690 12.9
ENVIRONMENTAL MANAGEMENT 98 1788 13.7
ENERGY 95 1883 14.4
ENVIRONMENTAL ENGINEERING AND MANAGEMENT
JOURNAL
92 1975 15.1
SUSTAINABILITY 91 2066 15.8
METALURGIA INTERNATIONAL 89 2155 16.5
WATER SCIENCE AND TECHNOLOGY 83 2238 17.1
JOURNAL OF ENVIRONMENTAL PROTECTION AND
ECOLOGY
79 2317 17.7
NATURAL RESOURCES FORUM 79 2396 18.3
RENEWABLE ENERGY 77 2473 18.9
ENVIRONMENTAL EDUCATION RESEARCH 73 2546 19.4
MOUNTAIN RESEARCH AND DEVELOPMENT 73 2619 20.0
ENVIRONMENTAL MONITORING AND ASSESSMENT 72 2691 20.6
FUTURES 72 2763 21.1
BUILDING RESEARCH AND INFORMATION 71 2834 21.6
AMBIO 70 2904 22.2
JOURNAL OF BUSINESS ETHICS 67 2971 22.7
LANDSCAPE AND URBAN PLANNING 66 3037 23.2
ENVIRONMENTAL IMPACT ASSESSMENT REVIEW 64 3101 23.7
ECOLOGICAL INDICATORS 62 3163 24.2
RESOURCES CONSERVATION AND RECYCLING 60 3223 24.6
CHINESE GEOGRAPHICAL SCIENCE 59 3282 25.1
GEOFORUM 59 3341 25.5
CLIMATE POLICY 56 3397 25.9
INTERNATIONAL JOURNAL OF SUSTAINABILITY IN HIGHER EDUCATION
56 3453 26.4
WORLD DEVELOPMENT 55 3508 26.8
GLOBAL ENVIRONMENTAL CHANGE HUMAN AND POLICY DIMENSIONS
53 3561 27.2
ECOLOGY AND SOCIETY 52 3613 27.6
LAND USE POLICY 52 3665 28.0
zones. The core comprises 33 journals accounting for 3508 articles, a second zone of 268 journals accounts for 5107 articles, and a third zone with the bulk of the sources – 2230 journals accounting for 4478 articles. The resulting division into the three zones is a good fit to Bradford's law, with the top 300 journals accounting for 66% of the scientific literature on "Sustainable development".
Table 2: The three zones of the fit to Bradford's law. Zone Journals Articles K
Core 33 3508
1st Zone 268 5107 8.12
2nd Zone 2180 4478 8.13 Total 2481 13093
3.6 Web of Science (Journal Citation Reports) categories
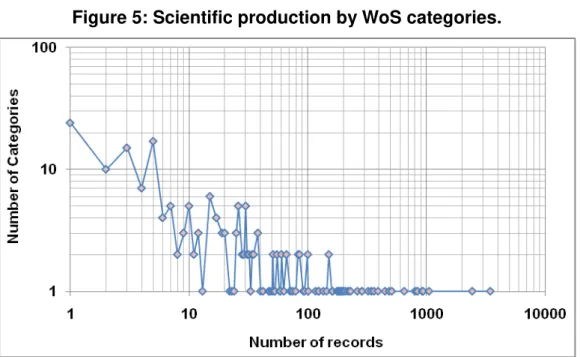
Figure 5 is a log-log plot of the distribution of the number of occurrences of articles according to the number of categories to which each of them corresponds. For example, at the extremes, 24 categories have just 1 occurrence, and 1 category has 3427 occurrences.
The 23 290 occurrences of articles were distributed among 218 WoS categories. The top ten most productive categories accounted for 80% of all the occurrences.
Figure 5: Scientific production by WoS categories.
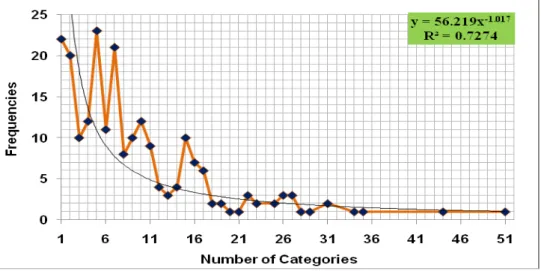
at the extremes, there are 22 categories that were never found shared with any other category (i.e., counting themselves, they correspond to the value 1 on the horizontal axis), and there is 1 category which has shared records with 50 other categories (i.e., it corresponds to the value 51 on the horizontal axis). This last category is "Environmental Sciences", and corresponds to more than 26% of the total publications.
One observes that, as well as the very high diversity of this specific category, the diversity of research on sustainable development is high in general, although it does depend on the category to which the published documents belong. One also observes in the figure that the frequency distribution follows an inverse power law (as in Lotka's law for a distribution of authors).
Figure 6: Frequencies (category counts) of the number of WoS categories shared in publications.
3.7 Category co-occurrence and density maps
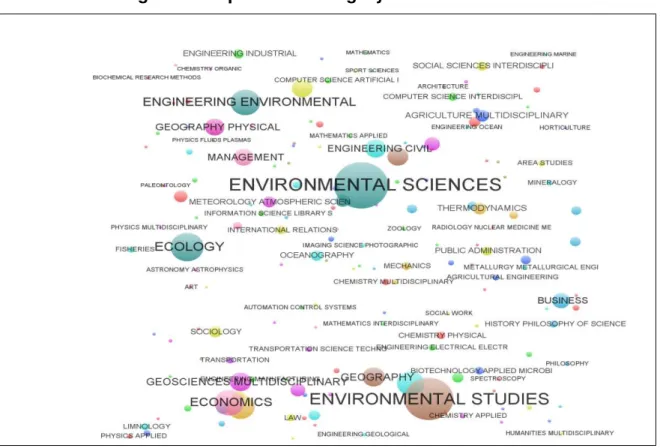
Figures 7 and 8 show the maps made with the VOS (Visualization of Similarities) clustering techniques (Van Eck and Waltman 2007). The spatial placement of the categories is a representation of their similarity (the number of times a pair of categories appear together).
Figure 7 thus constitutes an overview of the literature on the topic "Sustainable development" that has been published in international journals listed in WoS according to the
Figure 7: Map of WoS category co-occurrences.
Larger sizes on the map indicate a greater number of occurrences in the literature analysed. Thus "Environmental Sciences", "Environmental Studies", "Ecology", "Economics", and "Engineering Environmental" are the predominant disciplines, and they give the map a
circular structure.
The categories in the centre of the map have a strong co-occurrence with other
categories, and are therefore also closely related to each other. The core category is "Environmental Sciences", being the category most strongly linked simultaneously with other areas. It has particularly close relationships with nearby areas such as "Engineering Civil". Categories that are close together on the map are closely related thematically, while categories that are far apart have little relationship to each other.
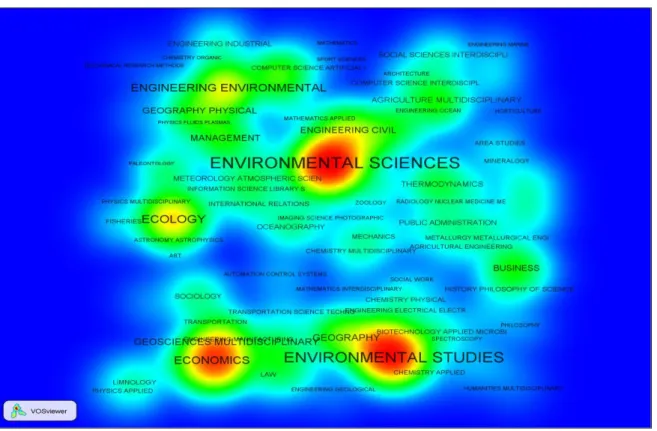
Figure 8 shows the density of the category co-occurrence map. The density of an area of the map is determined by the number of categories in that area and the frequency with which they occur. The size of the labels of the categories and the density of the different areas are indicative of their importance.
Figure 8: Density map of the WoS categories.
Each area of research is represented by a point on the map surrounded by a zone whose
colour varies from blue to red. The colour depends on the number of categories around the point and the intensity of their co-occurrences in the study. It is blue when there are few other categories nearby and they have minimal co-occurrence. And it is red when there are numerous categories nearby and they have a high co-occurrence. This type of display is very useful to get an overview of the most important aspects of the map (Van Eck and Waltman 2010).
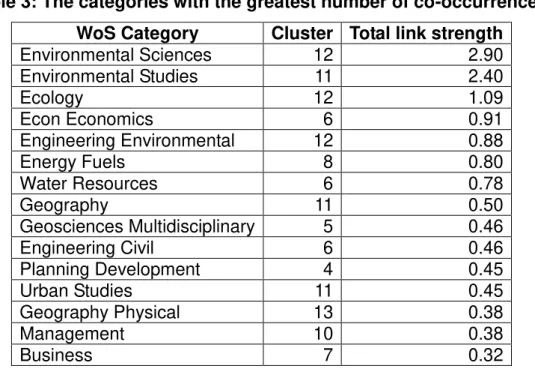
Table 3 lists the categories with the greatest frequency of co-occurrences. There stand out "Environmental Sciences" (cluster 12), "Environmental Studies" (cluster 11), "Ecology" (cluster 12), "Economics" (cluster 6), and "Engineering Environmental" (cluster 12).
Table 3: The categories with the greatest number of co-occurrences. WoS Category Cluster Total link strength
Environmental Sciences 12 2.90
Environmental Studies 11 2.40
Ecology 12 1.09
Econ Economics 6 0.91
Engineering Environmental 12 0.88
Energy Fuels 8 0.80
Water Resources 6 0.78
Geography 11 0.50
Geosciences Multidisciplinary 5 0.46
Engineering Civil 6 0.46
Planning Development 4 0.45
Urban Studies 11 0.45
Geography Physical 13 0.38
Management 10 0.38
Business 7 0.32
Table 4 lists the thematic categories that comprise each of the 14 clusters resulting from the analysis. The more central clusters have a strong association with other different categories, while clusters on the periphery of the map have relatively little association with other categories. Cluster 12, which includes the "Environmental Sciences" category, is the most central and is therefore of the greatest interdisciplinarity.
Table 4: The categories grouped into 14 clusters. Cluster 1
(29 categories)
Archæology; Art; Biochemistry Research Methods; Chemistry Analytical; Chemistry Inorganic Nuclear; Chemistry
Multidisciplinary; Chemistry Physical; Demography; Electrochemistry; Health Care Sciences Services; Health Policy Services; Instruments Instrumentation; Materials Science Composites; Materials Science Multidisciplinary; Nanoscience Nanotechnology; Nuclear Science Technology; Obstetrics Gynæcology; Optics; Physics Applied; Physics Atomic Molecular Chemical; Physics Condensed Matter; Physics Particles Fields; Public Environmental Occupational Health; Public Environmental Occupational Health SCI; Public Environmental Occupational SSCI; Radiology Nuclear
Medicine Medical Imaging; Rehabilitation SSCI; Social Sciences Interdisciplinary; Spectroscopy
Cluster 2 (27 categories)
Engineering Electrical Electronic; Engineering Industrial; Engineering Manufacturing; Ergonomics; Information Science Library Science; Mathematics; Mathematics Applied;
Mathematics Interdisciplinary Applications; Operations Research Management Science; Physics Mathematical; Psychology: Psychology Applied; Reproductive Biology; Social Sciences Mathematical Methods; Statistics Probability; Telecommunications; Zoology
Cluster 3 (20 categories)
Agricultural Economics Policy; Agricultural Engineering; Agriculture Multidisciplinary; Agronomy; Biochemistry Molecular Biology; Biotechnology Applied Microbiology; Chemistry Medicinal: Food Science Technology; Forestry; Genetic Heredity; Horticulture; Integrative Complementary Medicine; Material Science Paper Wood; Medical Laboratory Technology; Microbiology; Nutrition Dietetics; Pharmacology Pharmacy; Plant Sciences; Soil Science; Toxicology
Cluster 4 (18 categories)
Anthropology; Area Studies; Criminology Penology; Ethnic Studies; Evolutionary Biology; Humanities Multidisciplinary; International Relations; Law; Planning Development; Political Science; Psychology Clinical; Psychology Experimental; Psychology Multidisciplinary; Public Administration; Social Issues; Social Sciences Interdisciplinary; Social Work; Sociology
Cluster 5 (16 categories)
Astronomy Astrophysics; Chemistry Applied; Chemistry Organic; Construction Building Technology; Engineering Aerospace; Engineering Chemical; Engineering Petroleum; Geosciences Multidisciplinary; Materials Science
Biomaterials; Materials Science Ceramics; Material Science Characterization Testing; Materials Science Composites; Material Science Textiles; Meteorology Atmospheric Sciences; Physics Multidisciplinary; Polymer Science Cluster 6
(15 categories)
Engineering Civil; Engineering Geological; Engineering Marine; Engineering Ocean; Fisheries; Geochemistry Geophysics; Imaging Science Photographic Technology; Limnology; Marine Freshwater Biology; Metallurgy Metallurgical Engineering; Mineralogy; Mining Mineral Processing; Oceanography; Remote Sensing; Water Resources
Cluster 7 (15 categories)
Biology; Business; Education Educational Research;
Education Scientific Disciplines; Engineering Multidisciplinary; Ethics; History of Social Sciences; History Philosophy of Science; History Philosophy of Science SCI; History
Philosophy of Science SSCI; Mathematical Computational Biology; Multidisciplinary Sciences; Philosophy; Religion; Sport Sciences
Cluster 8 (6 categories)
Energy Fuels; Engineering Mechanical; Mechanics; Physics Fluids Plasmas; Physics Nuclear; Thermodynamics
Cluster 9 (6 categories)
Cluster 10 (6 categories)
Business Finance; Economics; History; Hospitality Leisure Sport Tourism; Industrial Relations Labour; Management Cluster 11
(5 categories)
Architecture; Geography; Urban Studies; Women Studies; Environmental Studies
Cluster 12 (4 categories)
Biodiversity Conservation; Ecology; Engineering Environmental, Environmental Sciences
Cluster 13 (3 categories)
Geography Physical; Geology; Palæontology
Cluster 14 (2 categories)
Transportation; Transportation Science Technology
3.8 Comparing Brazil, Spain, and Sweden
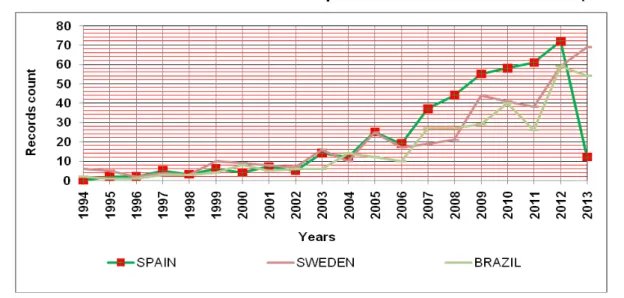
Figure 9 shows the distribution of records over the last 20 years for the three countries that we studied separately (Brazil, Spain, and Sweden). There is a clear correlation in the first half of the period, but some differences in the second. In this second half, Spain out-produces Sweden and Brazil, although it undergoes a sharp decline in the last year. Sweden out-performs Brazil in the number of records in the last 5 years, with a growth rate of 9%.
Figure 9: Distribution of the annual scientific production of the 3 countries (1994-2013).
The co-occurrence maps of Figs. 10-12 give a view of the interdisciplinary nature of the "Sustainable development" concept in Spain, Sweden, and Brazil, respectively. Although the research area "Environmental Sciences" is that with greatest co-occurrence in all three countries, the maps show notable differences as well, such as the number of WoS categories and the number of clusters.
15 clusters. The predominant theme "Environmental Sciences" is strongly linked to the areas of "Ecology", "Agricultural Engineering", "Geosciences Multidisciplinary", "Business", and "Management".
Figure 10: Map of co-occurrences of Spain's WoS categories.
For Sweden (Fig. 11), there are 60 categories forming 13 clusters. "Engineering
Environmental" and "Planning Development" are strongly linked to the predominant theme
"Environmental Sciences".
Finally, for Brazil (Fig. 12), there are 49 categories in 13 clusters. "Geosciences Multidisciplinary" and "Agriculture Multidisciplinary" are strongly linked to the predominant theme "Environmental Sciences".
Figure 12: Map of co-occurrences of Brazil's WoS categories.
4 DISCUSSION AND CONCLUSIONS
4.1 Production and growth
As an area of research, sustainable development has become a paradigm of interdisciplinarity. It has grown exponentially over the last few decades (Fig. 1), with the annual rate being 12% in the last 10 years of the present study, and 22% of all the years are considered. Other studies on related topics have reported similar, or even higher, growth rates:
Kajikawa et al. (2007) identified the topics covered in the scientific literature with
"Sustainab*" in their titles, abstracts, or keywords. They found: "... over 3000 papers on sustainability area currently published annually."
Quental and Lourenço (2012), in a bibliometric assessment of the content of two ISI WoS
databases (SCI and SSCI), searched for the terms "Sustainable development" or "Sustainable science" from 1981 to 2008. They retrieved a total of 7800 records.
Du et al. (2013) studied "Energy efficiency" on the same databases as the present study,
but restricted to the period 1991-2010. They obtained a total of 8244 records. The growth rate they calculated for this topic was the same (12%) as that found in the present work.
included the words "Sustainability" or "Sustainable" in the title, abstract, or keywords,
using the SCI and SSCI databases) during the period 2007-2013. They found extraordinary growth: "Currently, about 12,000 papers on sustainability are published annually."
This exponential growth may be because the impact of human activity on the environment is leading to this area of research being studied from ever more different fields and with different approaches. In particular, major efforts are being made from the technological, financial, political, and social perspectives to pay more attention to sustainable development. The current growth of the scientific literature on this topic is therefore hardly surprising.
4.2 Countries with scientific production on "Sustainable development"
The results regarding the geographical dispersion of publications in this field were inconclusive. There were 166 countries found to have published articles on "Sustainable development". As was found in the study of Du et al. (2013), the 4 most productive countries
were USA, China, UK, and Canada. They were also in the same order and in similar proportions. There was a strong concentration of articles in the most productive countries, with just the 10 most productive accounting for about 70% of the articles.
4.3 Publication language
While there were 27 languages in which the articles on "Sustainable development" had
been written, the predominant language was English (93% of the articles), with just some 1000 articles written in other languages. Similar results were reported by Du et al. (2013) for the case of the "Energy efficiency" literature, with 95% for English and only 295 (5%) articles distributed among the remaining 20 languages.
4.4 Author productivity
We have already mentioned that this is an expanding area with strong growth in recent years. But at the same time, it is a recent area, with its major production beginning in the 1990s. This means that it has specific characteristics that make it different from other, more established, areas of research, but similar to others with the same type of development and dynamics.
Instead they come and go in accordance with the particular objectives of their research. This could be the reason why we found there to be roughly twice as many authors as articles. In particular, only 42 authors had published more than 10 articles, while more than 25 000 had published only one article. Similar behaviour was noted by Duet al. (2013).
4.5 The dispersion of the scientific literature
As was the case with the authors, the dispersion of the articles among different scientific journals was high – the 13 093 articles on sustainable development were published in nearly 2500 journals. Again similarly to the case of the authors, just a small number of those journals (36) published a third of the articles.
Division of the distribution into three zones gave a perfect fit to Bradford's law (Egghe, 1990) – a core of 33 journals, a second zone of 268 journals, and a third consisting of the remaining 2230 journals. Du et al. (2013) similarly found that more than 30% of the 6494 articles in their study were from just 20 journals. Bjurström and Polk (2011), in their co-citation analysis of climate change and interdisciplinarity, found 6417 articles distributed among 96 journals, but with the 4 most productive journals accounting for over 30% of the articles.
4.6 WoS categories
The 23 290 occurrences that resulted from our search on "Sustainable development"
were distributed among 218 WoS thematic categories grouped into 14 clusters. The top 10 categories in number of occurrences accounted for 80% of the total. The category "Environmental Sciences", which alone accounted for more than 26% of the total, was the central category best related to the other themes. It also presented the greatest diversity, sharing records with 50 other categories. At the other extreme, there were 22 categories that shared no records with any other category.
Following "Environmental Sciences", the other predominating disciplines were "Environmental Studies", "Ecology", "Economics", and "Engineering Environmental". Over 75% (172) of the selected categories had some type of interrelationship with another category.
The results of Du et al. (2013) were as follows: 6488 articles about energy efficiency were divided into 178 subject categories in SCI-EXPANDED and SSCI. The five most frequently tagged subject categories based on the total number of publications were "Energy & Fuels" (2,021), "Environmental Sciences" (976), "Engineering Electrical Electronic" (918), "Environmental Studies" (826), and "Telecommunications" (639).
papers to belong to the "Environmental Sciences" category, with 22% from "Biological Sciences" (with an upwards trend in this latter category). This lends support to the commonly held assumption that environmental issues in fact lie at the core of sustainable development, even if, in theory at least, social and economic issues need to be addressed in a balanced manner. The papers dealing with urban issues represented around 13% of the sustainable development literature, but their share is diminishing, and the authors comment that this seems to contradict the idea that urban sustainability is one of the major facets of sustainable development.
Of the 14 clusters of the present study, cluster 12, which includes the "Environmental Sciences" category, is the most central and hence has the greatest interdisciplinarity. The clusters formed by the greatest number of WoS categories, clusters 1 and 2, include 29 and 27 categories, respectively.
Kajikawa et al. (2007) identified and analysed 93 clusters of citation networks, 15 of which together accounted for more than 80% of the papers. The largest of those clusters they labeled "Agriculture", with topics such as soil erosion, food productivity, and plant biodiversity. The cluster dealing with business was located furthest away from the other clusters, meaning that it had the fewest links with the other clusters.
For Kajikawa, Tacoa and Yamaguchi (2014), the field of sustainable development research continues to be hard to define. Instead, new thematic clusters are continually being
integrated into the field, implying closer connections between previously fairly isolated sectors of research, and therefore indicative of a changing research landscape. Their Business cluster has closed the gap with the rest, and some clusters have merged, while others, such as Health, Energy, or Water, maintain the independence that had been observed for them previously.
4.7 Comparing Spain, Sweden, and Brazil
The distribution of records for the three countries studied separately (Spain, Sweden, and Brazil) was very similar in the first 10 years, in no case exceeding 20 documents annually. In the last 10 years of the study period, however, there were important variations among the three countries in the production of papers. All three published essentially above 20 papers annually, and Spain reached 70 in 2012, although there was a sharp fall in 2013.
in the latter with "Geosciences Multidisciplinary" and "Agriculture Multidisciplinary". The numbers of categories and clusters are different, as is the dispersion of the different categories on the maps.
To summarize, the methodological approach taken in the present work could be used to describe the structure of any other scientific field and its relationships with other disciplines (interdisciplinarity), and to visualize the relationship between the different WoS categories conforming the subject under study. Likewise, it could be used to compare different research areas and different countries.
REFERENCES
Bettencourt, Luís M. A. and Jasleen Kaur. 2011. “Evolution and structure of sustainability science.” Proceedings of the National Academy of Sciences (US) 108(49):19540-545.
Bjurström, Andreas, and Merritt Polk. 2011. “Climate change and interdisciplinarity: A co-citation analysis of IPCC Third Assessment Report.” Scientometrics 87(3):525-50.
Bordons, María, Fernando Morillo, and Isabel Gómez. 2004. “Analysis of cross-disciplinary research through bibliometrics tools.” In: Handbook of quantitative science and technology research: The use of publication and patent statistics in studies on S&T systems edited by Henk F. Moed, Wolfgang Glänzel, Ulrich Schmoch, 437-56. Dordrecht: Kluwer Academic Publishers.
Borgatti, Steve P., Martín G. Everett, and Lin Freeman. 2002. Ucinet 6 for Windows: Software for social network analysis. Harvard: Analytic Technologies.
Chang, Yu-Wey and Mu-Hsuan Huang. 2012. “A study of the evolution of interdisciplinarity in library and information science: Using three bibliometric methods.” Journal of the American Society for Information Science and Technology 63(1):22-3.
Culture as a goal in the Post-2015 Development Agenda. 2013. http://media.ifacca.org/files/cultureasgoalweb.pdf.
Du, Huibin Du, Linxue Wei, Marilyn A. Brown, Yangyang Wang, and Zheng Shi. 2013. “A bibliometric analysis of recent energy efficiency literatures: An expanding and shifting focus.” Energy Efficiency 6(1):177-90.
Engels , Anita, Tina Ruschenburg, and Peter Weingart. 2005. “Recent internationalization of global environmental change research in Germany and the US.” Scientometrics 62(1):67-85.
Engels, Anita and Tina Ruschenburg. 2008. “The uneven spread of global science: Patterns of international collaboration in global environmental change research.” Science and Public Policy 35(5):347-60.
Hugé, Jean, Tom Waas, Farid Dahdouh-Guebas, Nico Koedam, and Thomas Block. 2013. “A discourse-analytical perspective on sustainability assessment: interpreting sustainable
development in practice.” Sustainability Science 8(2):187-98.
Janssen, Marco A., Michael L. Schoon, Weimao Kee, and Katy Börnere. 2006. “Scholarly networks on resilience, vulnerability and adaptation within the human dimension of global environmental change.” Global Environmental Change 16(3):240-52.
Jappe, Arlette. 2007. “Explaining international collaboration in global environmental change research.” Scientometrics 71(3):367-90.
Kajikawa, Yuya, Junko Ohno, Yoshiyuki Takeda, Katsumori Matsushima, and Hiroshi Komiyama. 2007. “Creating an academic landscape of sustainability science: An analysis of the citation network.” Sustainability Science 2(2):221-31.
Kajikawa, Yuya, Francisco Tacoa, and Kiyohiro Yamaguchi. 2014. “Sustainability science: The changing landscape of sustainability research.” Sustainability Science 9(3):1-8.
Lagar-Barbosa, María Pilar, María Isabel Escalona-Fernández, and Antonio Pulgarín. 2014. “Análisis de la interdisciplinariedad en la ingeniería química universitaria española.” Revista Española de Documentación Científica 37(1): e029. doi: http://dx.doi.org/10.3989/
redc.2014.1.1048.
Morillo, Fernanda, Maria Bordons, and Isabel Gómez. 2003. “Interdisciplinarity in science: A tentative typology of disciplines and research areas.” Journal of the American Society for Information Science 54(13):1237-49.
Newman, M. E. J. and M. Girvan. 2004. “Finding and evaluating community structure in networks. Physical Review E 69(2): 026113.
Porter, Alan L., Alex S. Cohen, J. David Roessner, and Marty Perreault. 2007. “Measuring researcher interdisciplinarity.” Scientometrics 72(1):117-47.
Quental, Nuno and Júlia M. Lourenço. 2012. “References, authors, journals and scientific disciplines underlying the sustainable development literature: A citation analysis.”
Scientometrics 90(2):361-81.
Schoolman, Ethan D., Jeremy S. Guest, Kathleen F. Bush, and Andrew R. Bell. 2012. “How interdisciplinary is sustainability research? Analyzing the structure of an emerging scientific field.” Sustainability Science 7(1):67-80.
Stanhill, G. 2001. “The growth of climate change science: A scientometric study.” Climatic Change 48(2-3):515-24.
Van Eck, Nees Jan and Ludo Waltman. 2007. “VOS: A new method for visualizing similarities between objects.” In: Advances in data analysis: Proceedings of the 30th Annual Conference of the German Classification Society edited by Reinhold Decker and Hans-Joachim Lenz, 299-306. Berlin: Springer-Verlag.
program for bibliometric mapping.” Scientometrics 84(2):523-38.