Received November 30, 2001 / Accepted January 15, 2003
THERMAL RE-EMISSION EFFECTS ON THE LAGEOS I
SATELLITE VERSUS SPIN AXIS ORIENTATION
Jânia Duha1, Germano B. Afonso1 & Luiz D. D. Ferreira2
Since 1976 when the LAGEOS I satellite was launched, the evolution of thermal re-emission effects has been observed and modeled. The effect of sun and earth heating has been analyzed separately and thermal models have been able, almost completely, to explain most of the residuals observed. However, after more than fifteen years of reasonable agreement between theory and observations, unexpected peaks in the along-track perturbations appeared and brought new attention to the problem of thermal force modeling. The efforts to explain these unexpected residual effects have produced interesting works such as the redefinition of the average coefficient of reflectivity (pressure of direct solar radiation), the Yarkovsky-Schach effect (thermal re-emission due to the solar heating), and the effect of asymmetrical reflection at the satellite’s surface. Despite the lack of detailed data about the spin axis evolution, changes in the spin axis orientation have been also analyzed, however, none of these effects or corrections seems able to explain the observations. We present in this paper a unified thermal model that includes, simultaneously, the effects of sun and earth heating. The close connection between energy source coordinates (sun and earth) and the periodicity of satellite rotation and translation leads to complex sinusoidal functions that can explain the sudden peaks of maximum and minimum. We show that the residuals observed for LAGEOS I satellite can be predicted and explained by the thermal model presented and we also extend the analysis to a set of test-satellites with different spin axis inclinations concluding that the most stable spin axis configuration is the 90°-03°: spin axis perpendicular to the satellite orbital plane related to the Earth (90°) and spin axis lying on the orbital plane related to the Sun (03°). This configuration is desirable from the point of view of orbit stability because it minimizes the thermal re-emission effects and does not present great peaks of maximum after some years of orbit.
Key words: Thermal Re-emission; Unified Model; LAGEOS.
EFEITOS DE RE-EMISSÃO TÉRMICA NO SATÉLITE LAGEOS I VERSUS ORIENTAÇÃO DO EIXO DE ROTAÇÃO - Desde 1976, quando o satélite LAGEOS I foi lançado, efeitos de re-emissão térmica tem sido observados e modelados. Os efeitos de aquecimento devidos ao Sol e a Terra têm sido analisados separadamente e os modelos térmicos existentes têm revelado-se aptos a explicar, quase completamente, a maioria dos resíduos observados. No entanto, após mais de quinze anos de razoável concordância entre a teoria e as observações surgem picos inesperados nas perturbações transversais despertando renovada atenção ao problema da modelagem de forças térmicas. Os esforços para explicar esses efeitos residuais inesperados têm resultado em trabalhos interessantes assim como a redefinição do coeficiente de refletividade médio (pressão da radiação solar direta), o efeito Yarkovsky-Schach (re-emissão térmica devida ao aquecimento solar), e o efeito da reflexão assimétrica na superfície do satélite. Apesar da falta de informação detalhada sobre a evolução do eixo de rotação, mudanças na orientação do eixo de rotação têm sido, também, analisadas, no entanto, nenhum desses efeitos ou correções parece estar apto a explicar as observações. O presente trabalho vem propor um modelo térmico unificado que trata, simultaneamente, os efeitos térmicos devidos ao Sol e a Terra. A conexão estreita entre as coordenadas da fonte de energia (Sol e Terra) e a periodicidade dos movimentos de rotação e translação do satélite resulta em funções senoidais complexas capazes de explicar como esses picos de máximo e mínimo surgem inesperadamente. Mostra-se que os resíduos observados para o satélite LAGEOS I podem ser preditos e explicados pelo modelo térmico apresentado e ainda estende-se a análise a um grupo de satélites-teste com diferentes inclinações do eixo de rotação concluindo que a configuração mais estável para o eixo de rotação é 90°-03° : eixo de rotação perpendicular ao plano orbital do satélite em relação a terra (90°) e eixo de rotação orientado ao longo do plano orbital em relação ao sol (03°). Esta configuração é desejável do ponto de vista da estabilidade da órbita porque minimiza os efeitos de re-emissão térmica e não apresenta grandes picos de máximo após alguns anos.
Palavras-chave: Re-emissão Térmica; Modelo Unificado; LAGEOS.
Departamento de Física Universidade do Paraná - UFPR Centro Politécnico - Jd. das Américas - CP 19044
1Setor de Ciências Exatas - TEL (41) 361-3094
Departamento de Geomática
INTRODUCTION
The LASER Geodynamics Satellite I - LAGEOS I (developed exclusively for geodynamic measurements using LASER-tracking techniques), launched in 1976 by NASA, has been continuously tracked by the Goddard Space Flight Center base stations. LAGEOS I an II (launched in 1992) were projected to move throughout well known and extremely steady orbits (Marshall et al., 1995; Schutz, 1997). Spherical shape and orbit parameters have been chosen with the purpose of minimizing the effects of the disturbing forces (Afonso et al., 1985; 1989; Afonso & Foryta, 1989). Although the LAGEOS’s orbit was modelled with extreme accuracy, after the subtraction of all the known forces acting on the satellite, such as the geopotential, the gravitational attraction of the Sun and of the Moon, and direct solar radiation pressure, still remains a residual along-track acceleration to be explained (Mignard et al., 1990; Scharroo et al., 1991; Rubincam, 1988, 1990; Duha, 2000).
Rubincam et al. (1997) conclude that even so the solar heating is capable of explaining most of the unknown forces acting on LAGEOS I between the years of 1980-1983, a thermal model is still needed to explain the along-track acceleration behavior from 1990, when the more significant peaks of maximum and minimum appear.
The previously modelled effects had not been able to explain the amplitude of the anomalous eccentricity excitations observed on the LAGEOS satellites through out the last years.
In 1997, Métris et al. presented an analysis of the eccentricity excitations of LAGEOS I. According to some previous works (Tapley et al., 1993; Farinella et al., 1996; Martin & Rubincam, 1996) Métris et al. (1997) used milliseconds of arc per year (mas/yr) in units of eccentricity excitation (e). Despite that eccentricity is a pure number its variation can be transformed into an orbit displacement (in the same way as an angle) when multiplying e by a length (typically, the semi-major axis). In his work, Metris et al. (1997) show the LAGEOS I eccentricity excitations versus time. They compare the observed residuals with the following effects: the pressure of direct solar radiation relative to the redefinition of the
average coefficient of reflectivity, the Yarkosky-Schach effect (thermal re-emission due to the solar heating) and the effect of the asymmetrical reflection on the satellite’s surface. According to Métris et al. (1997) most of the increase in the signal between 1989 and 1993 is due to the Yarkovsky-Schach effect which is strongly related to the intricate evolution of the LAGEOS I spin axis. The main imperfection of this model is not to predict the peaks between 1990 and 1996 clearly related to the spin axis orientation. They argue that part of this discrepancy can be attributed to the errors in the modelling of the rotation axis evolution, however, clarifies that a detailed analysis of the various aspects that composes the modelled signal shows that a change in the orientation of the spin axis of the order of 10° - 20° is not enough to explain the great magnitude of the observed peaks. They conclude, finally, that it is not possible to improve the modelling significantly in order to obtain a better agreement with the LAGEOS data and attributes this impossibility to the lack of detailed information and the difficulties in the physical modelling of the disturbing forces.
We present now a unified and simple model (PhD. Thesis: Duha, 2000) that is able to predict the evolution of the thermal acceleration of the LAGEOS I since it was launched. This model takes into account, simultaneously, the effect of the two main energy sources for the satellite: Earth and Sun. We show how a different spin axis inclination can change the residual acceleration trough the years, and how different can the LAGEOS satellite behave if we use different inclinations values.
Based on results obtained in this work, we conclude that the magnitude of the maximum and minimum peaks can be completely explained by an appropriate thermal model. These peaks are predictable and they are a natural consequence of the total thermal re-emission force.
THE RADIAL, ALONG-TRACK AND CROSS-TRACK COMPONENTS OF THE DAY-NIGHT AND SUMMER-WINTER ACCELERATIONS
with the radial, along-track and cross-track components of the acceleration. The first step is to analyze this acceleration of thermal origin, initially, in the LAGEOS (xyz) reference system (z axis along the spin axis) and to obtain the x, y and z accelerations (Duha, 1996; Duha & Afonso, 1999). The second step is to obtain the radial, along-track and cross-track components of that acceleration. These components can be calculated, by taking the unit vectors i, j and k (x, y and z I directions, respectively) as a function of the unit vectors r, s and w (radial, along-track and cross-track). The day-night acceleration can be written as a function of: its module,
axy , and the sine and cosine of the amount (ωt - δ1) that determine the direction of the acceleration in the
xy plane:
(
)
(
)
[
i j]
axy =axy cos ωt−δ1 -sin ωt−δ1 , (1)
where ω is the spin axis (axle z) angular frequency,δ1
is the thermal lag angle due to rotation and:
( 2)
1 θ −δ
=n B sin ’
axy f , (2)
where θ ’ is the energy source’s colatitude (measured from the axle z) , δ 2 is the thermal lag angle due to translation and B 1 is the main part of acceleration and does not depend on the colatitude.. The term, sin(θ
‘-δ2), shows how much day-night effects must be
accounted when the energy source’s colatitude is θ ’. In the same way, the summer-winter acceleration can be rewritten as a function of its module and direction:
k
az =az , (3)
( 2)
2cos θ−δ
=n B ’
az f . (4)
Substituting the unit vectors i, j and k given as follow:
( )
( )
( )w
s r i t cos cos t cos sin nt sin + t sin nt cos t cos sin nt cos t sin nt sin ω ϑ ω ϑ ω ω ϑ ω − + + − = (5a) ( ) ( )
( )w
s r j t sin cos t cos nt cos t sin sin nt sin t sin sin nt cos t cos nt sin ω ϑ ω ω ϑ ω ϑ ω − + − + − − = (5b) ( ) ( )
( )w s r k ϑ ϑ ϑ sin cos nt sin cos nt cos + + − =
, (5c)
gets the radial, Rxy, along-track, Sxy, and cross-track,
Wxy, accelerations that compose the acceleration day-night axy :
( )r
Rxy =axy sin ntsinδ1−cos ntcosδ1sinϑ , (6)
( )s
Sxy=axy cos ntsinδ1+sin ntcos δ1sinϑ , (7)
( )w
Wxy=axy −cos δ1cosϑ , (8)
and
( )r
Rz =−az cos ntcos ϑ , (9)
( )s
Sz=az sin ntcos ϑ , (10)
( )w
Wz=az sinϑ , (11)
for the summer-winter acceleration az.
Where n is the mean motion andϑ is the energy source’s orbital plane inclination measured from the axle z
SPECIAL CASES: SPIN AXIS PARALLEL AND PERPENDICULAR TO THE ORBITAL PLANE
When the spin axis is perpendicular to the orbital plane, or either, ϑ=π /2, the colatitude of the energy source (θ’ = π /2) is constant throughout an orbital period. After rewriting Eqs. (5a), (5b) and (5c) we obtain:
( )
( )s
r i cos sin sin cos cos cos sin sin t nt t nt t nt t nt ω ω ω ω + + − = (12a) ( )
( )s
r j sin sin cos cos sin cos cos sin t nt t nt t nt t nt ω ω ω ω + − + − − = (12b) w
k = (12c)
When ω = n, we had i = - w, j = - s and k = - r,
when ϑ = π/2. Despite the orbital and rotation movements are still going on, the coordinates of the energy source will remain constant and the satellite will have identical distribution of temperatures in the case where ω = n = 0, or either, the satellite is at rest and without rotation, a case where the energy source will illuminate always the same face.
The radial, along-track and cross-track components of the day-night acceleration, in this case are given by:
( )s
Sxy =axycos nt−δ1 , (13)
( )r
Rxy =axysin nt −δ1 , (14)
0 = xy
W , (15) and
0 = = =S W
Rz z z , (16)
for the summer-winter acceleration, because when
2 = ’ π
θ , one has δ2 = 0 and cosθ’ = 0.
Similarly, when the rotation axis is parallel to the orbital plane, or either, it is lying on the orbital plane,
0 =
ϑ , and: i=
(17a)
( ) (r ) (s )w
j= -sin ntcosωt + −cos ntcosωt + −sin ωt (17b)
( ) (r )s
k = −cos nt + sin nt , (17c)
that results in:
( )r
Rxy=axy sin ntsinδ1 , (18)
( )s
Sxy=axy cos ntsinδ1 , (19)
( )w
Wxy =−axy sinδ1 , (20)
for the day-night acceleration.
Taking into account only the contribution of the Earth (Rubincam, 1987) as the heat source, whose radiance is nearly 62.55 W m-2 (altitude: 6,000 km),
the results obtained through Eqs. (18), (19) and (20) are presented in Figure (1), where we use the constants shown in Table (1). Figure (1) shows the behavior of the radial, along-track and cross-track components
of the day-night acceleration during two successive revolutions of the satellite.
Since the spin axis lies on the orbital plane and the orbit is almost circular, the mean anomaly M ≅θ’,
the colatitude of the Earth measured from the satellite spin axis.
The displacement of the zeros of the day-night acceleration components is due to the thermal lag angle
δ2 value (nearly 45 degrees). The day-night
acceleration (and consequently its components) is null at the points where the summer-winter effect is maximum (0° + δ2, 180° +δ2, 360° + δ2 , etc.). The analysis of the curves shows that the average radial acceleration R be positive, even so, it presents negative points of minimum, that appear as a consequence of the thermal lag angle δ2. If the thermal inertia did not exist, or either,δ1 =δ2 = 0, the minimum points would be equal to zero and R would be always positive.
The average along-track acceleration S is negative (drag-like effect) and the average cross-track acceleration W is null for one orbital period. One more time, it is possible to notice how the thermal lag angles can change the curve and decrease the time when S remains positive during an orbital period. For the day-night effect, however, it is important to remember that the direction of the satellite’s rotation (+ω or -ω) related to its orbital movement can modify the sign of the angle
R and S curves in Figure (1) however, keeping W
unchanged.
For the summer-winter acceleration one gets the following relations:
( )r
Rz=−az cos nt , (21)
( )s
Sz=az sin nt , (22) 0
=
Wz . (23)
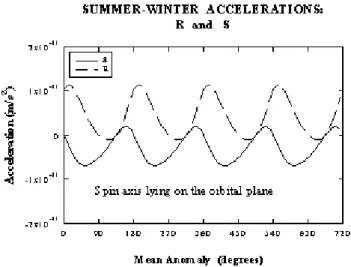
Again, taking into account the Earth as the heat source, it is possible to carry through an analysis of Eqs. (21), (22) and (23). Figure (2) shows the behavior of the radial and along-track accelerations throughout two orbital periods. The along-track summer-winter acceleration is predominantly negative and has maximum and minimum values in the 10-11m/
s2 order. It is approximately ten times bigger than the
along-track day-night acceleration, whose values of maximum and minimum are in the order of 10-12m/s2.
The cross-track acceleration is always zero, therefore the rotation axis lies on the orbital plane. The points where the radial and along-track accelerations are null (90°, 270°, 450°... etc.) are dislocated due to the thermal lag angle δ2.
For the summer-winter effect the direction of the satellite’s rotation does not affect the results, and S will be always averaged negative and this result is due,
only, to the thermal lag angle, δ2 : the satellite will respond to a specific pattern of temperature distribution only after a certain time lag, when its position was already dislocated along its orbit and the relation between the systems (xyz) and (rsw) have already changed. Moreover, the smaller the values of
δ2 , the lesser will be the difference between the
positive part of curve S and the negative part. When the angleδ2 is null (without thermal inertia), the average acceleration S will be null.
THERMAL ENERGY SOURCES: SUN AND EARTH
The complete analysis of thermal disturbing forces must include the solar heating (Farinella et al., 1996). In this case, P’(θ’,φ’) represents the coordinates of the Sun in the reference system (xyz). It is necessary to determine how these coordinates (the colatitude θ ’ and the longitude φ’), change in time. The colatitude of the Sun is related to the LAGEOS’s spin axis and is given by the following relations:
(n .⊕k)
=arcos ’
θ , (24)
z y x
k=kx +ky +kz , (25) Figure 1 - The radial, along-track and cross-track components of
the day-night acceleration. In this case, the satellite spin axis lies on the orbital plane and the thermal energy source is the earth.
Figura 1 - Componentes radial, transversal e normal da aceleração noite-dia. Neste caso, o eixo de rotação do satélite é paralelo ao plano orbital e a fonte de energia térmica é a Terra.
Figure 2 - The radial and along-track components of the summer-winter acceleration. In this case, the cross-track component is null, the satellite spin axis lies on the orbital plane and the thermal energy source is the earth.
where n⊕ is the unit vector that points from the satellite to the Sun and k is the unit vector along the spin axis in an Inertial Reference System (XYZ) with unit vectors x, y and z, respectively. The inclination,
Sun
ϑ , of z axis related to the Earth’s orbital plane is given by the minimum value of the colatitude for one orbital period of the satellite around the Sun, since that lies along the orbital plane of the Earth. For the satellite LAGEOS this is not true and n⊕ will have to be substituted by rS, the position-unit-vector of the Sun:
( )
[ r .S k ]
Sun =mín arcos
ϑ , (26)
However, when the Earth is the main energy source, its colatitude is given by the following expression:
(−r.k)
=arcos ’
θ , (27)
z x
r=X +Yy +Z , (28) where r is the satellite’s position-unit-vector in the Inertial System. The inclination,
ϑ
, of z axis related to the orbital plane is given by the minimum of the colatitude value for one orbital period around the Earth:
ϑ
(29)
where θ’ = r.k . However, we need an analysis that does not depend on the knowledge of the satellite and energy source coordinates and we will use the following expression:
nt nt
’ ϑcos
θ = + , (30)
where the colatitude of the source depends only on the average angular motion and on the inclination of the axis of rotation in relation to the orbital plane of the satellite.
ACCELERATION PERIODIC BEHAVIOR: MAIN RESULTS
If the spin axis lies on the orbital plane, the components of the thermal re-emission acceleration have a simple periodic behavior, as was seen in Figures
(1) and (2). However, when the inclination angle, ϑ, is not zero, the behavior of the thermal re-emission will present composite periodic features, due to the addition, subtraction and multiplication of the diverse sinusoids that compose the accelerations R, S and W, given by Eqs. (6), (7) and (8) for the day-night effect and (9), (10) and (11) for the summer-winter effect.
Figure 3a - The radial, along-track and cross-track components of the summer-winter acceleration. The satellite spin axis inclination angle to the orbital plane is 20 degrees and the thermal energy source is the earth.
Figura 3a - Componentes radial, transversal e normal da aceleração inverno-verão. O ângulo de inclinação do eixo de rotação do satélite em relação ao plano orbital é 20 graus e a fonte de energia térmica é a Terra.
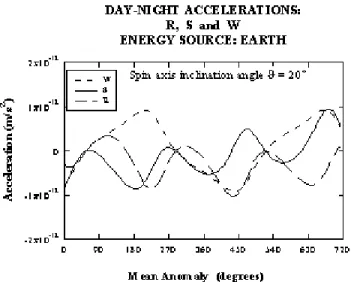
Figure 3b - The radial, along-track and cross-track components of the day-night acceleration. The satellite spin axis inclination angle to the orbital plane is 20 degrees and the thermal energy source is the earth.
Figura 3b - Componentes radial, transversal e normal da aceleração noite-dia. O ângulo de inclinação do eixo de rotação do satélite em relação ao plano orbital é 20 graus e a fonte de energia térmica é a Terra.
( )
[ θ']
Figures (3a) and (3b) show R, S and W accelerations for the summer-winter and day-night effect, respectively, assuming a small angle of inclination, ϑ = 20° (axis of rotation next to the plane).
In Figure (3a), the cross-track acceleration, W, has a constant value along one period, approximately, 5 x 10-12 m/s2. However, the absolute value of W grows
from zero to the Wmáx (which depends onδ2) and later decreases until zero, when the inclination ϑ varies from 0° to 90°. The R and S accelerations have similar behavior to the case where ϑ = 0, with tiny variations
on the order of magnitude of these accelerations. We can introduce here the following question: “Why the radial acceleration reaches larger absolute values than the along-track acceleration?” The answer is in the combination of the periodic alternation between the day-night and summer-winter accelerations and in the alternation between the radial and along-track accelerations throughout one orbital period. The radial component, R, of the summer-winter acceleration starts to grow for two reasons: (1) the summer-winter effect is growing into its maximum because the day-night is loosing strength; (2) the intensity of the summer-winter effect remains the same, but the along-track acceleration loses importance for the radial acceleration, or either, S tends to zero and
R tends to its maximum.
In this case, the behavior of the radial component,
R, of the summer-winter acceleration, is explained by
the fact that (1) and (2) occur simultaneously. For the along-track component of the summer-winter acceleration it is the opposite, when the effect gains strength, the S component loses intensity for the R component and vice-versa.
The day-night effect, however, shows a different behavior, as seen in Figure (3b). From Figure (1), one expects that as the spin axis moves away from the plane and the spin axis inclination tends to π/2, the intensity of R, S and W accelerations should increase, but keeping the standard development seen in Figure (1), where ϑ = 0, however, this does not happens. The cross-track acceleration keeps null average for the period, however the radial acceleration, before clearly positive, starts to have negative average, and the along-track acceleration keeps the negative average only for the first period,
changing itself into positive in the second period. The day-night effect, in general, is dissipative when the direction of the rotation is opposite to the direction of the translation, -axy, because in this in case, the day-night force acts in the opposite direction to the orbital movement and the satellite loses speed; and is not dissipative when the direction of the rotation is equal
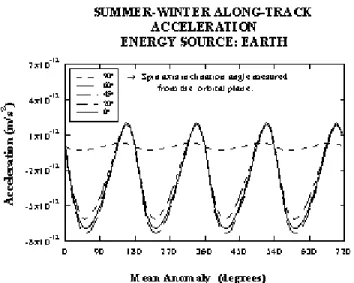
Figure 4a - The along-track component of the summer-winter acceleration. The satellite spin axis inclination angles to the orbital plane are 0, 20, 45, 60 and 90 degrees and the thermal energy source is the earth.
Figura 4a - Componente transversal da aceleração inverno-verão. Os ângulos de inclinação do eixo de rotação do satélite em relação ao plano orbital são 0, 20, 45, 60 e 90 graus e a fonte de energia térmica é a Terra.
Figure 4b The along-track component of the day-night acceleration. The satellite spin axis inclination angles to the orbital plane are 0, 20, 45, 60 and 90 degrees and the thermal energy source is the earth.
to the direction of the translation, +axy, because in this case the day-night force acts at the direction of the movement and the satellite gains speed. However, Figure (3b) shows that, when the axis z is out of the plane, the day-night effect can alternate dissipative or not dissipative features, so the direction of the rotation is not too important.
Figures (4a) and (4b) show the behavior of the along-track summer-winter and day-night accelerations for larger inclinations than the one of 20°. The following values had been chosen for matching ϑ =0°, 20°, 45°, 60° and 90°. In Figure (4a) it is observed that as the inclination angle approaches 90°, the summer-winter along-track acceleration tends to zero with standard oscillatory behavior as shown in the previous figures. The only unexpected result is the fact that the biggest negative peaks are found in ϑ = 20°, instead of ϑ = 0°, when the summer-winter effect is more significant. However, in Figure (4b), the situation is different. The day-night along-track acceleration presents different periodic behavior for each one of the considered inclinations and for ϑ = 90°, when the day-night effect is maximum, the lesser amplitude for S.
An interval equal to two orbital periods, in this case, is not capable of supplying a good vision of the
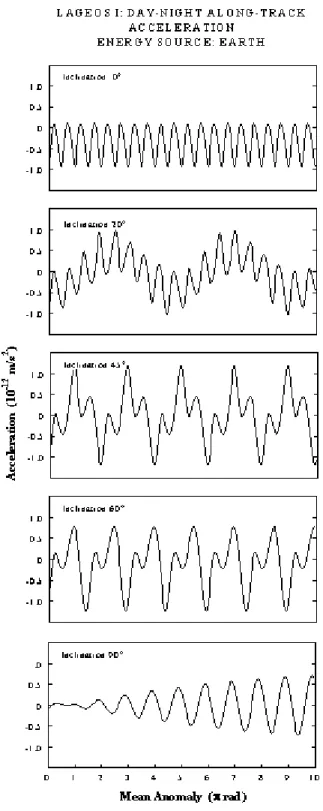
Figure 5 - The along-track component of the day-night acceleration. The satellite spin axis inclination angles to the orbital plane are 0, 20, 45, 60 and 90 degrees and each case is plotted separately. The thermal energy source is the earth and the analysis of these accelerations has been extended to ten revolutions.
Figura 5 - Componente transversal da aceleração noite-dia. Os ângulos de inclinação do eixo de rotação do satélite em relação ao plano orbital são 0, 20, 45, 60 e 90 graus e cada caso é analisado separadamente. A fonte de energia térmica é a Terra e a análise dessas acelerações foi estendida para dez revoluções.
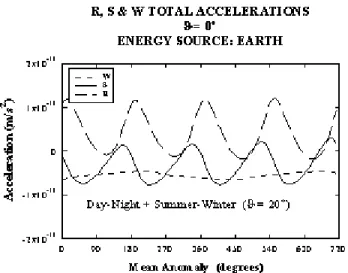
Figure 6 The radial, along-track and cross-track components of the total acceleration (day-night plus summer-winter). In this case, the satellite spin axis lies on the orbital plane (inclination angle zero) and the thermal energy source is the earth.
periodic behavior of these accelerations. To better understand the behavior of the day-night acceleration, the period of study was extended for ten orbital periods and each one of the inclinations was treated separately, as shown in Figure (5). The periodic behavior of these accelerations is now clear-cut and shows that even so the regularity is bigger than one cycle, for some inclinations, ϑ = 20°, 45° and 90°, for example, the average value of the acceleration tends to zero. However, for ϑ = 60° this cancellation is not clear and for ϑ = 0° it definitively does not occur and the day-night along-track acceleration is negative, in the average.
However, the LAGEOS satellite will sense the two effects simultaneously, as seen, in Figures (6) and (7) were the results for the radial, along-track and cross-track components of the total acceleration are presented. It is observed that due to the small order of magnitude of the day-night accelerations, compared with the summer-winter accelerations, the behavior of the total accelerations is dominated by the summer-winter effect. All the analyses presented in figures (1), (2), (3a), (3b), (4a), (4b), (5), (6), and (7) had been carried through considering Earth as the only thermal energy source.
In the sequence, it becomes necessary to carry through the analysis of the behavior of these accelerations, having the Sun as heat source. As the
Figure 7 - The radial, along-track and cross-track components of the total acceleration. In this case, the satellite spin axis inclination angle is 20 degrees and the thermal energy source is the earth.
Figura 7 - Componentes radial, transversal e normal da aceleração total. Neste caso, o eixo de rotação do satélite apresenta ângulo de inclinação igual a 20 graus e a fonte de energia térmica é a Terra.
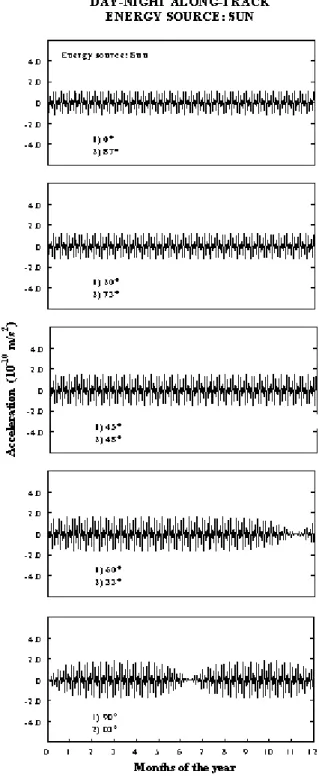
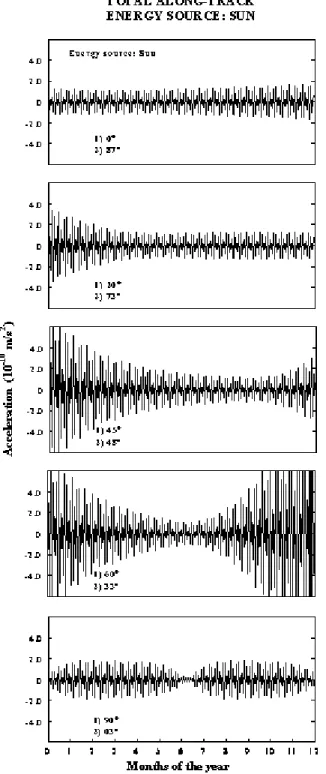
Figure 8 - The along-track component of the summer-winter acceleration. The thermal energy source is the sun. In this case, the spin axis inclination angle to the satellite’s orbital plane is 0, 20, 45, 60 and 90 degrees. Each inclination angle value corresponds to another spin axis inclination angle to the sun’s orbital plane, respectively, 87, 73, 48, 33 and 03 degrees. The acceleration analysis is carried out through 12 months (one year).
minimum period for such analysis is one cycle, the analysis of the acceleration will have to be extended for a period of twelve months.
Moreover, a purely analytical study, as the one developed so far, which does not make use of the accurate positions of the satellite and the Sun at each moment, requires an analytical relation able to provide the inclination, ϑSun, of the spin axis (related to the ecliptic) as a function of the inclination ϑ (related to the orbital plane of the satellite):
ϑSun = ϑ + IL + IE , (31)
where IL is the orbital inclination of the LAGEOS and
IE is the inclination of the ecliptic.
To follow, in Figure (8), the along-track summer-winter acceleration is presented having the Sun as the heating source. We consider five different values of inclination of the axis of rotation to the orbital plane: ϑ = 0°, 20°, 45°, 60° and 90° and the corresponding inclination to the ecliptic: ϑSun = 87°, 73°, 48°, 33° and 03°.
One can see that the behavior of the acceleration presents significant differences for the different positions of the rotation axis. The maximum value reached in the period of one year is of 6 x 10⁻¹⁰ m/s2,
approximately. However the acceleration oscillates around zero so that, as the time goes on the effect in the satellite vanishes. Figure (9) repeats the analysis, however at this time, for the along-track day-night acceleration and we had observed that the oscillatory behavior, in this case, is more predictable, without peaks of maximum and very great minimum, reaching a maximum value of 2 x 10⁻¹⁰ m/s2, approximately,
that represents 33 % of the maximum summer-winter acceleration.
Figure (10) shows the total thermal acceleration throughout one year. The satellite LAGEOS, whose axis of rotation will be in the band of inclination of 45° - 60°, will have to suffer bigger residual perturbations if compared with the other cases. The most steady pattern occurs for ϑ = 0°, ϑSol = 87°, when the maximum of the acceleration falls for 1 x 10⁻¹⁰ m/s2.
The satellite orbit that must be known with accuracy needs a thermal modelling capable of not only foresee the oscillations of the thermal disturbing
Figure 9 - The along-track component of the day-night acceleration. The thermal energy source is the sun. The satellite spin axis inclination angles are the same as in Fig. 8.
Figura 9 - Componente transversal da aceleração inverno-verão. A fonte de energia térmica é o Sol. Os ângulos de inclinação do eixo de rotação do satélite são os mesmos da Fig. 8.
forces for short periods (some hours), but also, for long periods (years).
Figure 10 - The along-track component of the total thermal acceleration. The thermal energy source is the sun. The satellite spin axis inclination angles are the same as in Fig. 8.
Figura 10 - Componente transversal da aceleração térmica total. A fonte de energia térmica é o Sol. Os ângulos de inclinação do eixo de rotação do satélite são os mesmos da Fig. 8.
Figure 11 - The along-track component of the total thermal acceleration. The thermal energy sources are the earth and the sun . The satellite spin axis inclination angles are the same as in figure 8. The acceleration analysis is carried out through, approximately, 24 years (from 1976 to 2000).
Figura 11 - Componente transversal da aceleração térmica total. As fontes de energia térmica são a Terra e o Sol. Os ângulos de inclinação do eixo de rotação do satélite são os mesmos da figura 8. A análise da aceleração é realizada, aproximadamente, durante 24 anos (de 1976 a 2000).
the analysis of the situation of a satellite in orbit 24 years must be of the order of this time.
Moreover, the complete analysis must consider, simultaneously, the two effects (night-day and summer-winter) and the two thermal sources (Sun and Earth). Figure (11) presents the total thermal acceleration for a period from 1976 to 2000. For this analysis, all the constants related in Table (1) were considered, excepting the constants of absorption, emission, average temperature and average radiance. The following values had been used (Slabinski, 1996): α = 0.30 (two times bigger than the value given by Slabinski, α = 0.15), ε = 0.81, with T0 = 307 K, I0 = 1370 W m-2 for the solar heating and T
0 = 144 K, I0
= 65,6 W m-2 for the Earth.
In Figure (11), we notice that the points where the amplitude presents peaks of unexpected maximum and minimum are separated by quiet periods that would last from 16 years to a few months or days. The special case when the rotation axis is in the orbital plane (ϑ = 0°, ϑSol = 87°) is especially interesting since, a satellite with such pattern will go through about 16 quiet years and then when the year 1994 is approached will start to present unexpected peaks of maximum and minimum, that would remain unexplained if you do not have an appropriate model for the thermal re-emission.
The other extreme, is the case where the rotation axis is perpendicular to the orbital plane (ϑ = 90°,
ϑSol = 03°) when it is observed that the orbital
residuals due to the thermal re-emission will be minimum and, therefore, highly desirable from the point of view of the orbit stability.
These patterns are, however, insufficient because the accurate knowledge of the position of the LAGEOS satellite’s rotation axis is necessary (Bertotti & Iess, 1991). Rubincam et al. (1997) present a table with LAGEOS I spin axis orientation data between the years of 1988 and 1995. This table is reproduced, except the inclinations ϑ and ϑSun , obtained from Eqs. (29) and (31), and added for each date.
The θ* represents the colatitude of the LAGEOS’s
spin axis, measured from the north pole of the Earth;
λ* is the east longitude of the spin axis, measured from
the vernal equinox.
The inertial coordinates of the spin axis are obtained from the following relations:
* *
cos
sinθ λ
= x
k (32a)
∗ ∗
=sinθ sinλ y
k (32b)
cos ∗
= θ
z
k , (32c)
where (32 a, b, c) are the components of the unit vector k, that points to the spin axis (+ z) direction with respect to the Inertial Reference System (XYZ) (Rubincam et al., 1997).
Notice, in Table (2), that the inclinations ϑ of the spin axis for the years of 1992 and 1993 vary around 25° and 4°, respectively. The joint analysis of Figure (11) for first and the second set of inclinations (ϑ = 0° with ϑSun = 87°; and ϑ = 20° with ϑSun = 73°) with the data of Table (2) indicates that from 1990 (whose date are not shown in this table) to 1992 the behavior of the along-track acceleration would have to follow predominantly the standard pattern 20-73°.
CONCLUSIONS
Finally, we conclude that it is important to work with a unified thermal model that takes into account, simultaneously, the effects of sun and earth heating.
The complex sinusoidal functions are able to explain how the peaks of maximum and minimum occur unexpectedly after more then ten years of the LAGEOS I orbital evolution.
The LAGEOS I satellite residuals observed can be predicted and explained by the unified thermal model. Different spin axis inclinations will lead to different LAGEOS I behavior. From the point of view of thermal re-emission forces, the satellite spin axis inclination is very important, because the periodicity and amplitude of the perturbations depends, directly, on it.
REFERENCES
Afonso, G.B. & Foryta, D.W., 1989. An
anisothermical emission model for small bodies, in Orbital Dynamics of Natural and Artificial Objects (editado por R. Vieira-Martins, D. Lazarro and W. Sessin), pp. 73-83. Observatório Nacional, Rio de Janeiro.
Afonso, G.B., Barlier, F.; Berger, C., Mignard, F. & Walch, J.J., 1985. Reassessment of the
charge and neutral drag of LAGEOS and its geophysical implications, J. Geophys. Res., 90: 9381-9398.
Afonso, G.B., Barlier, F., Carpino, M., Farinella, P., Mignard, F., Milani, A. & Nobili, A.M., 1989. Orbital effects of LAGEOS seasons and
eclipses. Annalae Geophysicae, 7: 501-514.
Bertotti, B. & Iess, L., 1991. The rotation of
LAGEOS. J. Geophys. Res., 96: 2341-2440.
Duha, J., 1996. Modelling and Aplications of the
Summer-Winter Effect, M.Sc. Thesis, UFPR.
Duha, J., 2000. Modelling of the Thermal
Re-emission Effects on Artificial Satellites: LAGEOS and GPS, PhD. Thesis, UFPR.
Duha, J. & Afonso, G. B., 1999. Thermal force
effects on satellites. Brazilian J. Geophys.,
17(2,3): 163-174.
Duha, J. & Afonso, G. B., 2000. Thermal force
effects on satellites. Advances in Space Dynamics, 358-367, São José dos Campos.
Farinella, P., Vokrouhliký, D. & Barlier, F., 1996.
The rotation of LAGEOS and its long-term semimajor axis decay; a self-consistent solution. J. Geophys. Res., 101, 17: 861-17,872.
Marshall, J. A., Klosko, S. M. & Ries, J. C., 1995. Dynamics of SLR tracked satellites.
Reviews of Geophys., 353-360.
Martin, C.F. & Rubincam, D.P., 1996. Effects of
Earth albedo on the LAGEOS I satellite. J. Geophys. Res., 101, 3215-3226.
Metris, G., Vokrouhlicky, D., Ries, J.C. & Eanes, R.J., 1997. Nongravitational effects and
the LAGEOS eccentricity excitations. J. Geophys. Res., 102: 2711-2729.
Mignard, F., Afonso, G.B., Barlier, F., Carpino, M., Farinella, P., Milani, A. & Nobili, A.M., 1990. LAGEOS: ten years of quest for the
non-gravitational forces. Adv. Space Res., 10: 221-227.
Rubincam, D.P., 1987. LAGEOS orbit decay due
to infrared radiation from Earth. J. Geophys. Res.,
92: 1287-1294.
Rubincam, D.P., 1988. Yarkovsky thermal drag on
LAGEOS. J. Geophys. Res., 93: 13,805-13,810.
Rubincam, D.P., 1990. Drag on the LAGEOS
satellite. J. Geophys. Res., 95: 4881-4886.
Rubincam, D.P., Currie, D.G. & Robbins, J.W., 1997. LAGEOS I once-per-revolution force due
to solar heating. J. Geophys. Res., 102: 585-590.
Scharroo, R., Wakker, K.F., Ambrosius, B.A.C. & Noomen, R., 1991. On the along-track
acceleration of the LAGEOS satellite. J. Geophys. Res., 96: 729-740.
Schutz, B.E., 1997. New observational techniques
and precise orbit determination of artificial satellites. Celestial Mechanics & Dynamical Astronomy, 66(1): 79-85.
Slabinski, V.J., 1997. A numerical solution for
O primeiro satélite geodinâmico a LASER – LAGEOS I (desenvolvido exclusivamente para medições geodinâmicas utilizando técnicas de rastreio a LASER), lançado em 1976 pela NASA, tem sido continuamente rastreado por estações de base vinculadas ao Goddard Space Flight Center. Os satélites LAGEOS I e II (lançado em 1992) foram projetados para se deslocarem ao longo de órbitas conhecidas e supostamente estáveis. O formato esférico do satélite e os parâmetros orbitais foram escolhidos com o objetivo de minimizar os efeitos das forças de perturbação (Alfonso et al., 1980, 1985, 1989). Apesar da órbita do LAGEOS ter sido modelada com extrema acurácia, após a subtração de todas as forças conhecidas atuando no satélite, como o geopotencial, a atração gravitacional do sol e da lua, e a pressão da radiação solar direta, resta ainda, uma aceleração transversal residual a ser explicada (Scharroo et al., 1991; Rubincam, 1988, 1990). Rubincam et al. (1997), concluíram que apesar da radiação solar poder explicar a maioria das forças desconhecidas atuando no LAGEOS I, entre os anos de 1980-1983, ainda é necessário um modelo térmico capaz de explicar o comportamento da aceleração transversal a partir de 1990, quando os picos mais significativos de máximos e mínimos aparecem. Os efeitos conhecidos há muito tempo e já modelados, não têm sido capazes, até então, de explicar a amplitude das excitações de excentricidade anômalas observadas nos satélites LAGEOS durante os últimos anos. Métris et al. (1997) realizaram uma análise das excitações de excentricidade do LAGEOS I. De acordo com trabalhos anteriores (Tapley et al., 1993; Farinella et al., 1996; Martin & Rubincam, 1996) utilizaram milisegundos de arco por ano (mas/yr) como unidades de excitação de excentricidade. Apesar da excentricidade ser um número puro, a sua variação pode ser transformada em um deslocamento orbital (da mesma forma que em um ângulo) multiplicando e por um comprimento (tipicamente, o semi-eixo maior). Em seu trabalho, Metris et al. (1997) mostram as excitações de excentricidade do LAGEOS I versus tempo. Eles comparam os resíduos observados com os seguintes efeitos: a pressão da radiação solar direta relativa à redefinição da estimativa do coeficiente de refletividade, o efeito Yarkosky-Schach (re-emissão térmica devida ao aquecimento solar) e o efeito da reflexão assimétrica na superfície do satélite. De acordo com Métris et al. (1997) a maior parte do aumento de sinal entre os anos de 1989 e 1993 é devido ao efeito Yarkovsky-Schach, que apresenta forte correlação com a evolução intrincada do eixo de rotação do LAGEOS I. A principal imperfeição deste modelo é não predizer os picos entre 1990 e 1996, claramente relacionados a orientação do eixo de rotação. Eles argumentam que parte desta discrepância pode ser atribuída aos erros na modelagem da evolução do eixo de rotação, no entanto, esclarecem que uma análise detalhada dos diversos aspectos que compõe o sinal modelado mostra que uma mudança na orientação do eixo de rotação da ordem de 10°- 20° não é suficiente para explicar a grande magnitude dos picos observados. Eles concluíram, finalmente, que não é possível melhorar a modelagem de forma significativa e obter uma concordância maior com os dados do LAGEOS e atribuíram esta impossibilidade a falta de informação detalhada e as dificuldades da modelagem física das forças de perturbação. É apresentado, no presente trabalho, um modelo unificado e simples que é capaz de prever a evolução da aceleração térmica do LAGEOS I desde que este foi lançado. Este modelo leva em consideração, simultaneamente, o efeito das duas principais fontes de calor para o satélite: terra e sol. É mostrado como uma inclinação diferente do eixo de rotação pode alterar a aceleração residual ao longo dos anos, e quanto diferente pode ser o comportamento do satélite LAGEOS, se diferentes valores de inclinação forem levados em consideração. Baseando-se nos resultados obtidos neste trabalho, conclui-se que a magnitude dos picos de máximo e mínimo pode ser completamente explicada por um modelo térmico apropriado. Estes picos são uma conseqüência natural do comportamento da força de re-emissão térmica total e portanto, são previsíveis.
EFEITOS DE RE-EMISSÃO TÉRMICA NO SATÉLITE LAGEOS I VERSUS ORIENTAÇÃO DO EIXO DE ROTAÇÃO
NOTE ABOUT THE AUTHORS