2.1
A CLASS OF REGRESSION-CUM-RATIO ESTIMATORS IN TWO-PHASE SAMPLING
FOR UTILIZING INFORMATION FROM HIGH RESOLUTION SATELLITE DATA
Bijoy K. Handique
North Eastern Space Applications Centre, Department of Space, Umiam 793103 Meghalaya, India
bkhandique@rediffmail.com
KEY WORDS: two-phase sampling, regression-cum-ratio estimator, high resolution satellite data, mean square error
ABSTRACT:
Two-phase sampling design offers a variety of possibilities for effective use of auxiliary information such as those from high resolution remote sensing data. Continuous satellite data with large area coverage provide scope for deriving population values of the auxiliary variables, which can effectively be used for estimating the population parameters of the variable of interest. This study has been made to examine the possibilities of different forms of auxiliary information derived from remote sensing data in two-phase sampling design and suggest an appropriate estimator that will be of broad interest and applications. A new class of regression-cum-ratio estimators has been proposed for two-phase sampling using information on two auxiliary variables derived from high resolution satellite data. The bias and the mean square error (MSE) of the proposed estimators have been obtained up to first order approximation. Efficiency comparison of the proposed estimators has been made with some traditional estimators. The proposed estimator is found to be more efficient than the usual regression and ratio estimators. Numerical illustration has been carried out to examine the efficiency of the estimator in case of forest timber volume estimation utilizing tree crown diameter and tree height as auxiliary variables. It is shown that these estimators can be employed in a variety of conditions where there is strong correlation of satellite derived information with sample based ground measurements and when the cost of ground measurements is relatively high.
1. INTRODUCTION
With the relatively recent widespread availability of operational fine spatial resolution imagery from satellites, there is more opportunity to conduct spatial sampling with combinations of spatial resolution data (Haack and Rafter, 2010). Estimation of required parameters can efficiently be done with ratio and regression method of estimation with two-phase sampling or double sampling (Cochran, 1999) technique. There is large volume of theoretical developments with ratio and regression estimators in two-phase sampling suggesting a large number of estimators to suit different conditions (Khan and Tripathi, 1967; Sarndal and Swenson, 1987). Most of the estimators differ in the sense of availability of different auxiliary variables and number of phases considered (Srivastava and Jhajj, 1981). In addition, a large deal of work has been done in suggesting regression and ratio type estimators, regression in regression, regression in ratio and ratio in regression estimators (Kiregyera, 1984; Mukerjee et al., 1987; Ahmed, 1998; Senapati and Sahoo, 2006). Similarly, there has been significant theoretical work on transform auxiliary variables (Mohanty and Sahoo, 1995; Singh, 2001). Since most of the estimators are suggested based on their efficiency on theoretical comparison, practical applications are limited. Moreover, with the scope of utilizing wide range of remote sensing derived auxiliary variables, there is scope for suggesting new estimators, which will be of broad interest and applications.
Two-phase sampling design offers a variety of possibilities for effective use of auxiliary variables such as those from high resolution remote sensing data (Schreuder et al., 1993; Johnson, 2000). The estimation method consists of first using a coarser spatial resolution sensor over a large area. For selected samples, a second delineation is done with a finer spatial resolution system or ground based observations which are presumed to be
more accurate. Regression and ratio estimators were effectively used to integrate AVHRR-GAC and Landsat MSS digital data to estimate forest area in the continental United States (Nelson, 1989). Köhl, and Kushwaha (1994) demonstrated a four-phase sampling method for assessing standing volume using Landsat TM data, aerial photography and field measurements.
In the past decade, the use of high resolution satellite images, such as IKONOS, QUICKBIRD, Kompsat2 etc., has allowed the development of interactive models of photo interpreting biometrical parameters of stands and trees (Barnoaiea, 2007). With such high-spatial-resolution commercial images as well as the advancement of image processing techniques, there is significant improvement in population estimation accuracies (Goetz, et al., 2003). QuickBird satellite images when used to extract auxiliary variables (image data), such as photogrammetric crown diameter, stand volume, stand density and diameter distribution, using visual interpretation was found to be significantly cost-efficient. (Kamwi and Katsch, 2009). Similarly, satellite derived NDVI can be used as auxiliary variable in many applications while estimating study variables such as biomass, fuelwood etc. A double sampling technique could be effectively used with NDVI and field data to have a rapid estimate of fuelwood in northern Zimbabwe. (Mutanga, & Skidmore, 2004). In this paper, a new class of regression-cum-ratio estimators is proposed and efficiency of the estimator is tested with satellite derived auxiliary variables.
2. METERIALS AND METHODS
Regression and ratio estimators in two-phase sampling
There are two types of two-phase sampling design. In the first type, the auxiliary variable does not depend on the measurements, but is purely an indicator variable showing the
stratum to which the variable of interest is to be allocated. This type is termed as two-phase sampling for stratification. In the second type, the relationship between the auxiliary variables and the variables of interest is described by means of ratio or regression. In this case, the design is termed as two-phase sampling with ratio estimators and two-phase sampling with regression estimators.
In the ratio method, the first sample which is usually a large one of sizen is selected with probability sampling design to obtain good estimate
′
x
′
of X and then a probability sample of size either out of n or from remaining units of the population to observe the main character y under study. Assuming Simple Random Sampling without Replacement (SRSWOR) in both the phases, two phase sample estimate of the population mean given byn ′ N−n′
(
y x)
x ylr = / ′The regression type estimators of the population mean or total of y assume advance knowledge of either population mean X
or total Xof the auxiliary variable
x
. In the absence of such information a large one of size n′is selected to observex
and thereby to estimate X while a subsample of size nis drawn to measure y. Thus the two-phase regression type estimator of population mean Y isy y B(
x x)
lr= + ˆ ′− .
Now suppose that information on yet another auxiliary variable z is available on all units of the population, with population meanZN. Mohanty (1967) suggested the following regression
in ratio estimator assuming that the population mean of the second auxiliary variable (z) is known; x being the first auxiliary variable. M
T
(
)
[
]
z
Z
x
x
b
y
T
M=
+
yx′
−
(1)Chand (1975) proposed the chain ratio type estimator with similar conditions. C
T
⎟⎟ ⎠ ⎞ ⎜⎜ ⎝ ⎛ ′ ⎟ ⎠ ⎞ ⎜ ⎝ ⎛ ′ = z Z x x yTC (2)
Singh et al. (2007) suggested a transformed chain ratio type estimator for the population mean Y utilizing the known correlation coefficient
(
of the second auxiliary character through a simple transformation for estimating the population mean of auxiliary character more precisely in the first phase (preliminary) sampleas)
xz ρ ⎟⎟ ⎠ ⎞ ⎜⎜ ⎝ ⎛ + ′ + ⎟ ⎠ ⎞ ⎜ ⎝ ⎛ ′ = xz xz S ρ z ρ Z x x yT (3)
taking,
v
i=
z
i+
ρ
xz(
i
=
1
,
2
,...
N
)
so that 'V = Z'+ρ
xz is the sample mean of the transformed variable v in the first-phase sample and V=Z+ρ
xzis the corresponding population mean.2.2 Proposed Estimator
Motivated with the above estimators we propose a class of regression cum ratio estimators Tp Considering the fact that in practical situations it is easy to construct regression equation of y on x or y on z and utilizing the known correlation coefficient
between the auxiliary variables as additive factor to the second variable.
(
)
[
]
xz xz yx Pρ
z
ρ
Z
x
x
b
y
T
+
′
+
−
′
+
=
(4)Mean Square Error (MSE) of the estimator upto first order of approximation is derived as –
(
)
{
}
[
2 2 2]
2 2 2 3 2 1 2 yz y yz y z yx y
y f C f C C C
C f
Y −
ρ
+θ
−ρ
−ρ
= For xz Z Z
ρ
θ
+= (5)
Notations are defined as follows-
,
1
1
,
1
1
' 2 1⎟
⎠
⎞
⎜
⎝
⎛
−
=
⎟
⎠
⎞
⎜
⎝
⎛ −
=
N
n
f
N
n
f
, , , 2 2 2 2 2 2 2 2 2 Z S C X S C Y SC x x z z
y
y = = =
, , , , z y yz yz z y yz yz z x xz xz y x xy xy S S S S S S S S S S S S = = =
=
ρ
ρ
ρ
ρ
(
)
(
)
(
)
, 1 1 , 1 1 , 1 1 2 1 2 2 1 2 2 12
∑
∑
∑
= = = − − = − − = − − = N i i z N i i x N i i
y z Z
N S X x N S Y y N S
(
)(
)
(
)(
)
, 1 1 , 1 1 1 1 Z z X x N S Y y X x N S i N i i xz i N i ixy= −
∑
− − = −∑
− −= =
(
y Y)(
z Z)
N
S i
N
i i
xy = −
∑
− −=1
1 1
Derivation of MSE of the proposed estimator is given in the appendix.
2.3 Efficiency comparison
To compare the efficiency of estimator with similar estimators such those given in Equations 1-3, we write the MSE of the estimators as
(
)
{
}
⎥ ⎥ ⎦ ⎤ ⎢ ⎢ ⎣+ − − xz yz z y yz y yz y z yx M C C f C C C C C f T ρ ρ ρ ρ 3 2 2 2 1 2 2 3 2 1 2 )( =Y ⎡ y −f y +f
MSE 2 ρ (6)
( )
{
(
)
}
(
)
{
}
⎥⎥⎦ ⎤ ⎢ ⎢ ⎣ ⎡ − − + − − + = 2 2 2 2 2 2 2 3 2 1 2 yz y yz y z yx y yx y x y C C C C f C C C f C f Y T MSEρ
ρ
ρ
ρ
(7)( )
(
)
(
)
{
}
⎥⎥⎦ ⎤ ⎢ ⎢ ⎣ ⎡ − − + − + = 2 2 2 2 2 2 2 3 2 1 2 yz y yz y z yx y x y S C C C f C C f C f Y T MSEρ
ρ
θ
ρ
(8)( )
(
)
{
}
⎥
⎥
⎦
⎤
⎢
⎢
⎣
⎡
−
−
+
−
=
2 2 2 2 2 2 3 2 1 2 yz y yz y z yx y y PC
C
C
f
C
f
C
f
Y
T
MSE
ρ
ρ
θ
ρ
(9)MSE(T )- MSE(TM P)>0 if
(
)
{
}
[
− 2 − 2 2]
>1 2
yz y yz y
z C C
C f
Y
ρ
ρ
(
)
{
}
[
2 2 2]
2 2
yz y yz y
z
C
C
C
f
Y
θ
−
ρ
−
ρ
Or
MSE(TM)- MSE(Tp)>0 if
(
)
{
}
[
− 2]
>1 2
yz y z C
C f
Y
ρ
[
2{
(
)
2}
]
2
yz y z
C
C
f
Y
θ
−
ρ
Or
MSE(TM)- MSE(Tp)>0 if
C
z>
θ
C
zandf
1>
f
2 We have,C
z>
θ
C
z Sincexz
Z
Z
ρ
θ
+
=
so,
z xz
z
C
Z
Z
C
.
ρ
+
>
for any positive value of
ρ
xz, which will be true in all practical situations under study. It is obvious that for situations where double sampling is used.2 1 f
f >
MSE(T )- MSE(TC P) >0 if
(
)
{
}
[
−
2−
2 2]
>
3 2
yx y yx y
x
C
C
C
f
Y
ρ
ρ
[
2 2]
3 2
yx y
C f
Y −
ρ
, and
(
)
{
}
[
− 2− 2 2]
>2 2
yz y yz y
z C C
C f
Y
ρ
ρ
(
)
{
}
[
2 2 2]
2 2
yz y yz y
z
C
C
C
f
Y
θ
−
ρ
−
ρ
We have shown that
C
z>
θ
C
z so,(
)
{
}
[
− 2− 2 2]
>2 2
yz y yz y
z C C
C f
Y
ρ
ρ
(
)
{
}
[
2 2 2]
2 2
yz y yz y
z
C
C
C
f
Y
θ
−
ρ
−
ρ
(
)
{
}
[
−
2−
2 2]
>
3 2
yx y yx y
x
C
C
C
f
Y
ρ
ρ
2[
3 2 2]
yx y
C f
Y −
ρ
will be always true since
(
will always be positive,)
2yx y
x
C
C
−
ρ
Hence, MSE(TC)- MSE(TP)>0 MSE(TS)- MSE(TP)>0 if
(
)
[
2−
2 2]
>
3 2
yx y
x
C
C
f
Y
ρ
Y
2[
−
f
3C
y2ρ
yx2]
will bealways true since Cx2 will always be greater than 0. So we may conclude for all practical situations under double sampling scheme with two auxiliary variables, MSE (TP) will be lesser than MSE (TM), MSE (TC) and MSE (TS).
2.3 Empirical Studies
Let us assume that the samples are selected by SRSWOR. Then the appropriate estimator based on single phase sampling without using any auxiliary variable is the mean per unit estimator
y
, whose variance is given by( )
1 1 2y
S N n y
V ⎟
⎠ ⎞ ⎜ ⎝ ⎛ −
= = f1Sy2
2 2 1Y Cy
f
=
It may be shown that the ratio method of estimation will give a more precise result whenever
y x S RS
>
ρ
2 or
( )
) ( 2CV y
x CV
>
ρ or
y x
C C
2
> ρ
To examine the relative efficiencies of various estimators discussed in the chapter, we considered three population data two used earlier by others and one with remote sensing data. Relative efficiency has been measured as
Relative Efficiency (RE) = 100V (
y
)/MSE (Y
ˆ
)2.3.1 Population I: Murthy (1967)
We have considered this population, which has widely been used by many authors (Singh and Singh, 1991; Patel and Patel, 2012) so as to test the efficiency of the proposed estimators. Here,
N=34
y: Area under wheat in 1964 x: Area under wheat in 1963 z: Cultivated area in 1961
=
Y
199.44,X
=
208.89,Z
=
747.59,C
y=
.75318=
x
C
0.72C
Z=
0.59=
yx
ρ
0.98ρ
yz=
0.91,ρ
xz=
0.90 Taking n=7 andn
′
=102.3.2 Population II: Handique et al. (2011)
The second population is selected from the dataset under a research project carried by Handique et al. (2011) A sample study site was selected from a subtropical semievergreen forest in north eastern India with a dimension of 250 Hactre. The site is a part of Borail reserve forest in North Cachar Hills district of Assam. Topography of the forest is undulating with elevation ranging from 600 meter MSL to 960 meter MSL. Distribution of timber species is quite good as the area is fairly undisturbed. Important timber species available are, Mesua ferrea, Michelia champaca and Amoora wallichii. Lagerstroemia spp. pterospermum acerifolium, Duabanga spp., Elaeocarpus rugosus, Vatica lanceaefolia, etc. are major co-dominant species. IKONOS images were used to measure the plot wise average crown diameter and photogrammetric mean tree height per sample plot (Figure 1). As per convention of the local forest department, 0.1 Ha plot was made, which makes population size 2500 for the sample area. Following parameters have been derived to make the population estimate and calculate the MSE. We derive the parameters of the estimator as-
N=2500
y: forest timber volume in cubic meter (Cum) in 0.1 ha sample plot
x: average tree height in the sample plot in meter (m) z: average crown diameter in the sample plot in meter (m)
Figure1. IKONOS image of the part of study area The plot centres were located on IKONOS images and estimates of the amounts of timber volume, average stand height and average crown diameter were made on each plot with the help of standard volume tables. The extent of relationship among these three variables is given in Figures 2, 3 and 4. Average stand height (variable x) has greater correlation (r=0.794) with timber volume estimates than the average crown diameter (variable z; r=0.718). The estimates could be made rapidly when images were viewed stereoscopically. This method is definitely much faster and cost effective than the traditional field inventories.
Figure 2. Relation of timber volume with tree height
Figure 3. Relation of timber volume with crown diameter
0
25
50
100
Meters
Figure 4. Relation of tree height with crown diameter Here our concern is that since the volume tables were based on regional data rather than local measurements they are not very accurate. In addition there is likelihood of photointerpreter bias. To overcome this, 25 plots from image were randomly selected using sampling without replacement and enumerated in the field in traditional manner. Following parameters were estimated from image and ground based observations-
=
Y
4.63, X =21.09, Z=13.55,C
y=
0.95C
x=
0.98=
Z
C
0.64ρ
yx=
0.79ρ
yz=
0.72,ρ
xz=
0.66Taking
n
=25 andn
′
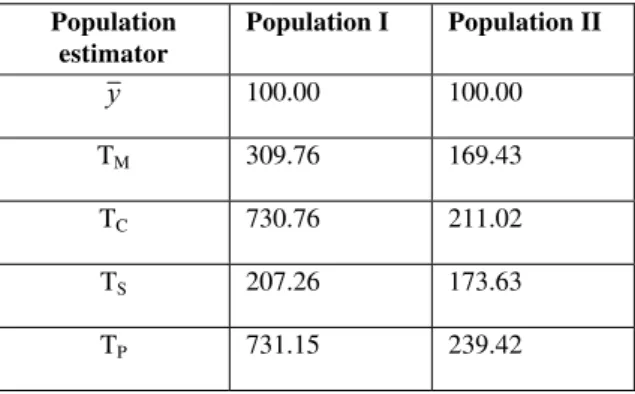
=200, MSE of the estimates were made using the formulae given in Equations 6-8 for both the populations I and II. Relative efficiencies of the proposed and existing estimators are given in Table 1.Table 1. Relative efficiency of proposed and existing estimators Population
estimator
Population I Population II
y 100.00 100.00
TM 309.76 169.43
TC 730.76 211.02
TS 207.26 173.63
TP 731.15 239.42
3. Conclusions
We have observed that even with relatively low correlation values in population II, the proposed estimator has outperformed the existing estimators in terms of accuracy of the estimates.
This suggests that the proposed estimator can be employed in a variety of conditions where there is significant correlation of study variable and auxiliary variables exist. Satellite derived information with sample based ground measurements can be best utilised with the proposed estimator, where we can evaluate inter-relation of the auxiliary variables by means of regression. Appropriate cost function can be built to optimise the sampling design in case of cost is a limiting factor. Interested workers can evaluate the efficiency of the proposed estimator with the LIDAR derived auxiliary variables such as those used by Wang and Glenn, (2008) and Tesfamichael et al., (2010) which is expected to have even better fit in the regression models and will result higher accuracy in the population estimates.
References
Ahmed, M.S., 1998. A note on regression-type estimators using multiple auxiliary information. Australian & New Zealand Journal of Statististics, 40(3), pp. 373-376.
Barnoaiea, I., 2007. Aspects regarding the use of IKONOS images in stand volume assessments, Proceedings of Romanian Academy, Series B, 2, pp. 159–163.
Chand, L.,1975. Some ratio-type estimators based on two more auxiliary variables, Unpublished Ph.D. dissertation, Iowa State University, Ames.
Cochran, W.G., 1999. Sampling Technique, John Wiley & Sons (Asia) Pvt. Ltd. pp.327-355.
Goetz, S. J., Wright, R. K., Smith, A. J., Zinecker, E. and Schaub, E., 2003. IKONOS imagery for resource management: tree cover, impervious surfaces and riparian buffer analyses in the mid-Atlantic region. Remote Sensing of Environment, 88, pp.195-208.
Haack, B. & Rafter, A.,2010. Regression estimation techniques with remote sensing: a review and case study. Geocarto International, 25(1), pp. 71-82.
Handique, B.K., Das, G., and Kalita, M.C., 2011. Comparative studies on forest sampling techniques with satellite remote sensing inputs, Project Report, NESAC, pp.12-40.
Johnson, E.W., 2000. Forest Sampling Desk Reference, CRC Press, pp. 811-844.
Kamwi, J.M., Kätsch, C., 2009. Using high-resolution satellite imagery and double sampling as a cost-effective means of collecting forest inventory data – the case of Hans Kanyinga Community Forest, Namibia. Southern Forests: a Journal of Forest Science,71(1), pp.49-58.
Khan, S. and Tripathi, T.P., 1967. The use of multivariate auxiliary information in double sampling, Journal of Indian Statistical Association, 5, pp. 42-48.
Kiregyera, B., 1984., Regression-type estimators using two auxiliary variables and the model of double sampling from finite populations. Metrica, 31, pp. 215-226.
Köhl, M., Kushwaha, S.P.S., 1994. A four-phase sampling method for assessing standing volume using Landsat TM data, aerial photography and field measurements. Commonwealth Forestry Review, 73 pp. 35-42.
M. N. Murthy,.1967., Sampling Theory and Methods, Statistical Publishing Society, Calcutta,p.399.
Mohanty, S. and Sahoo, J., 1995., A note on improving the ratio method of estimation through linear transformation using known population parameters. Sankhya: The Indian Journal of Statistics, 57(Series B pt1), pp. 93-102.
Mohanty, S., 1967. Combination of regression and ratio estimates. Journal of the Indian Statistical Association ,5, pp.1– 14.
Mukerjee R, Rao,T.J. and Vijayan, K., 1987. Regression type estimators using multiple auxiliary information. Australian Journal of Statistics, 29, pp. 224-254.
Mutanga, O. and Skidmore, A.K., 2004. Merging double sampling with remote sensing for a rapid estimation of fuelwood. Geocarto International, 19(4), pp. 49-55.
Nelson, R.,1989. Regression and ratio estimators to integrate AVHRR and MSS data. Remote Sensing of Environment. 30(3), pp. 201-216.
Patel, P. A. and Patel J. S., 2012. Model-assisted nonnegative variance estimator of the ratio estimator under the Midzuno-Sen sampling scheme. Pakistan Journal of Statists and Operation Research ,VIII (1), pp.55-64
Sarndal, C.E. and Swensson, B., 1987. A general view of estimation for two phases of selection with applications to two phase sampling and non-response, International Statistical Review, 55, pp. 279-294.
Schreuder, H.T., Gregoire, T.G. and Wood, G.B., 1993.
Sampling methods for multiresource forest inventory. Wiley New York, pp. 112-122.
Senapati, S.C. and Sahoo, L.N., 2006. An alternate class of estimators in double sampling. Bulletin of the Malaysian Mathematical Society(Second Series), 29, pp. 89-94.
Singh G.N., 2001. On the use of transformed auxiliary variable in the estimation of population mean in two phase sampling.
Statistics in Transition, 5(3), pp. 405-416.
Singh V.K. and Singh G.N., 1991. Chain type regression estimators with two auxiliary variables under double sampling scheme. Metron, XLIX, pp. 279-289.
Singh, R., Chauhan P. and Sawan, N., 2007. A family of estimators for estimating population mean using known correlation coefficient in two phase sampling. Statistics in Transition-new series, 8(1), pp. 89-96.
Srivastava, S.K. and Jhajj, H.S., 1981. A class of estimators of population mean in survey sampling using auxiliary information. Biometrica, 68, pp.341-343.
Tesfamichael, S.G., van Aardt, J.A.N., Ahmed, F., 2010. Estimating plot-level tree height and volume of Eucalyptus grandis plantations using small-footprint, discrete return lidar data. Progress in Physical Geography, 34(4), pp. 515–540. Wang, C. and Glenn, N.F., 2008. A linear regression method for tree canopy height estimation using airborne LiDAR data,
Canadian Journal of Remote Sensing, 34(2), pp. S217-S227. Acknowledgements
The author would like to thank Dr. S. Sudhakar, Director, North Eastern Space Applications Centre, for his guidance and encouragements. Thanks also due to officials and field staff of North Cachar Hills Autonomous District Council for their support in collecting forest inventory field data.
Appendix
Derivation of Bias and MSE of the proposed estimator Tp: Let us consider,
y
=
(
Y +e0)
,
x
=
(
X
+
e
1)
,
x
'
=
(
X
+
e
1')
,
2
e
bxz =
β
xz +,
z=(
Z +e3)
,
z′=⎜⎝⎛Z +e3′⎟⎠⎞ such thatE
(
e
0)
=E( )
e
1 =E( )
e
1' =E(
e
2)
= E( )
e
3 = E⎜
⎝
⎛ ′
e
3⎟
⎠
⎞
=0 E( )
e
02 =f1Y
C2y, E( )
e
12 =f1X
C2x,E
( )
e
1'2 =f2X
Cx2, E( )
e
32 =f1Z
C2z,E
( )
e
0e
1 =f1YXCyCxρ
yx,E( )
e0e1' = f2YXCyCxρ
yx, E(
e
0e
3)
=
f
1Y
Z
C
yC
zρ
yz,
E
( )
e
1e
1'=
f
2X
2C
x2E
(
e1e3)
= f1XZCxCzρ
xz,E( )
e1'e3 = f2XZρ
CxCzρ
xz,xz z xC C Z X f e e
E⎜⎝⎛ 1' 3′⎟⎠⎞= 2
ρ
ρ
Writing Tp in terms of e’s we get,
(
)
13 1 1 2 0
1
−⎟
⎠
⎞
⎜
⎝
⎛
+
′
⎥⎦
⎤
⎢⎣
⎡
⎟
⎠
⎞
⎜
⎝
⎛
+
′
−
−
+
+
+
=
Y
e
e
X
e
X
e
e
T
pβ
yxθ
Where
xz
Z
ρ
θ
+
=
1
as we haveWe assume that e0 <1,θe2 <1, so that and are expandable.
(
)
11
1
+
e
−(
12
1
+
θ
e
)
−
Expanding the right hand side of xxx and retaining terms up to first powers of e’s, we have
⎟
⎠
⎞
⎜
⎝
⎛
−
′
⎥⎦
⎤
⎢⎣
⎡
⎟
⎠
⎞
⎜
⎝
⎛
′
−
+
+
=
Y
e
0e
1e
11
e
3T
pβ
yxθ
E
(
T
p)
=
Y
Taking expectations on both sides in xxx and then subtracting
Yfrom both sides, we get the bias of the estimator , up to the first order of approximation as
P
T
⎥⎦ ⎤ ⎢⎣ ⎡ ⎟− ′ ⎠ ⎞ ⎜ ⎝ ⎛ ′− + += Y e0 e1 e1 Ye3
Tp
β
yxθ
( )
T E( )
T Y E Y e e e Ye YB P = P − = ⎢⎣⎡ + 0+
β
yx⎝⎜⎛ 1′− 1⎠⎞⎟−θ
3′⎤⎥⎦−( )
⎟
−
′
⎠
⎞
⎜
⎝
⎛
′
−
+
=
e
0e
1e
1Y
e
3T
B
Pβ
yxθ
( )
[
( )
]
2p p P ET ET
T
MSE = −
2
3 1 1
0 ⎥⎦⎤
⎢⎣ ⎡ ⎟− ′ ⎠ ⎞ ⎜ ⎝ ⎛ ′− +
=E e
β
yx e eθ
Ye⎥ ⎥ ⎥ ⎥ ⎦ ⎤ ⎢ ⎢ ⎢ ⎢ ⎣ ⎡ ′ − ⎟ ⎠ ⎞ ⎜ ⎝ ⎛ ′− ′ − ⎟ ⎠ ⎞ ⎜ ⎝ ⎛ ′− + ′ + ⎟ ⎠ ⎞ ⎜ ⎝ ⎛ ′− + = 3 0 1 1 3 1 1 0 2 3 2 2 2 1 1 2 2 0 2 2 2 e e Y e e e Y e e e e Y e e e E yx yx yx
θ
θ
β
β
θ
β
(
)
(
)
yx y x yx y z yzz x yx y
C
C
X
Y
Y
f
C
C
X
Y
f
f
C
Z
Y
f
C
X
f
f
C
Y
f
ρ
θ
ρ
β
θ
β
2 1 2 2 2 2 2 2 2 2 2 1 2 12
2
−
−
+
+
−
+
=
(
)
(
)
y x yx y z yzx y yx z x x y yx y C C X Y Y f C C X Y C X C Y f f C Z Y f C X C X C Y f f C Y f
ρ
θ
ρ
ρ
θ
ρ
2 1 2 2 2 2 2 2 2 2 2 2 2 2 2 1 2 2 1 22 − −
+
+ −
+ =
After simplification, we get,
(
)
{
}
[
2 2 2]
2 2 2 3 2 1 2 )
(TP Y fCy fCy yx f Cz Cy yz Cy yz
MSE = − ρ + θ − ρ − ρ