Metabolome
Emma Dixon1,5, Cynthia Clubb1,5, Sara Pittman1,5, Larry Ammann1,5, Zeehasham Rasheed2,5, Nazia Kazmi4, Ali Keshavarzian4, Pat Gillevet3,5, Huzefa Rangwala2,5, Robin D. Couch1,5*
1Department of Chemistry and Biochemistry, George Mason University, Manassas, Virginia, United States of America,2Department of Computer Science and Engineering, George Mason University, Fairfax, Virginia, United States of America,3Department of Environmental Science and Policy, George Mason University, Manassas, Virginia, United States of America,4Department of Medicine, Rush University Medical Center, Chicago, Illinois, United States of America,5The Microbiome Analysis Center, George Mason University, Manassas, Virginia, United States of America
Abstract
The diagnostic potential and health implications of volatile organic compounds (VOCs) present in human feces has begun to receive considerable attention. Headspace solid-phase microextraction (SPME) has greatly facilitated the isolation and analysis of VOCs from human feces. Pioneering human fecal VOC metabolomic investigations have utilized a single SPME fiber type for analyte extraction and analysis. However, we hypothesized that the multifarious nature of metabolites present in human feces dictates the use of several diverse SPME fiber coatings for more comprehensive metabolomic coverage. We report here an evaluation of eight different commercially available SPME fibers, in combination with both MS and GC-FID, and identify the 50/30mm CAR-DVB-PDMS, 85mm CAR-PDMS, 65mm DVB-PDMS, 7mm PDMS, and 60mm PEG SPME fibers as a minimal set of fibers appropriate for human fecal VOC metabolomics, collectively isolating approximately 90% of the total metabolites obtained when using all eight fibers. We also evaluate the effect of extraction duration on metabolite isolation and illustrate that ex vivo enteric microbial fermentation has no effect on metabolite composition during
prolonged extractions if the SPME is performed as described herein.
Citation:Dixon E, Clubb C, Pittman S, Ammann L, Rasheed Z, et al. (2011) Solid-Phase Microextraction and the Human Fecal VOC Metabolome. PLoS ONE 6(4): e18471. doi:10.1371/journal.pone.0018471
Editor:Hassan Ashktorab, Howard University, United States of America
ReceivedDecember 19, 2010;AcceptedMarch 1, 2011;PublishedApril 8, 2011
Copyright:ß2011 Dixon et al. This is an open-access article distributed under the terms of the Creative Commons Attribution License, which permits unrestricted use, distribution, and reproduction in any medium, provided the original author and source are credited.
Funding:This study was supported by NIH grant 1RC 2 AA019405. The funders had no role in study design, data collection and analysis, decision to publish, or preparation of the manuscript.
Competing Interests:The authors have declared that no competing interests exist.
* E-mail: [email protected]
Introduction
Volatile organic compounds (VOCs) are a large and highly diverse group of carbon-based molecules, generally related by their volatility at ambient temperature. The diagnostic potential of VOCs in biological specimens has begun to receive considerable attention and correlations between the VOC metabolome and various diseases are emerging [1–9]. Specialized headspace sampling methods, such as solid-phase microextraction (SPME), have greatly facilitated the isolation of VOCs from biological specimens [10–13]. A typical headspace SPME analysis involves the extraction of the VOCs via partitioning into a polymeric coating adhered to a fused silica rod (fiber), subsequent desorption of the VOCs by heating the fiber in the injection port of a gas chromatograph, separation of the VOCs by gas-liquid partition chromatography, and detection of the VOCs via flame ionization and/or mass spectrometry.
The duration of extraction and choice of polymeric coating are two important considerations when performing a SPME analysis. Ideally, a quantitative analysis is performed when the analyte distribution is in equilibrium between the sample and the SPME fiber coating, such that small deviations in extraction duration do not significantly alter analyte titers [14]. Several SPME fiber coatings are currently commercially available, including poly-acrylate (PA), polydimethylsiloxane (PDMS),
carbowax-polyethyl-ene glycol (PEG), and mixed phases of carboxen (CAR)-PDMS, divinylbenzene (DVB)-PDMS, and CAR-DVB-PDMS. While the polarity of the analyte of interest is typically used to guide the selection of a particular SPME fiber [13], metabolomic analyses generally strive to isolate and identify numerous, chemically diverse types of analyte molecules. Thus, a single SPME fiber coating may be insufficient for a comprehensive analysis of the complex analyte mixtures typically present in biological samples. The multifarious nature of biological sample composition also complicates the SPME procedure, as compounds with higher affinity for the fiber may compete with and displace those with lower affinity [15].
fiber type on the number and type of metabolites isolated. Overall we illustrate that a comprehensive analysis requires the use of all eight SPME fiber types. However, approximately 90% coverage is achieved using five of the fibers, better accommodating sample throughput.
Materials and Methods
Fecal samples
Fecal samples (,25 g) were collected from asymptomatic
donors and, within 1 hour of passage, sealed in a 50 mL sterile conical tube then frozen by immersing the tube in liquid nitrogen. The frozen samples were dispensed in 0.2 g aliquots into 4 mL WISP style screw thread amber glass vials and sealed with Black Top Hat PTFE/Silicone caps (J.G. Finneran, Vineland, NJ). All samples were stored at 280uC until analyzed. This study was
Table 1.GC Inlet temperatures per fiber type.
SPME Fiber GC-MS and GC-FID Inlet Temperature (6C)
65mm DVB-PDMS 250
85mm PA 280
75mm CAR-PDMS 300
85mm CAR-PDMS 280
100mm PDMS 250
7mm PDMS 320
60mm PEG 240
50/30mm CAR-DVB-PDMS 270
doi:10.1371/journal.pone.0018471.t001
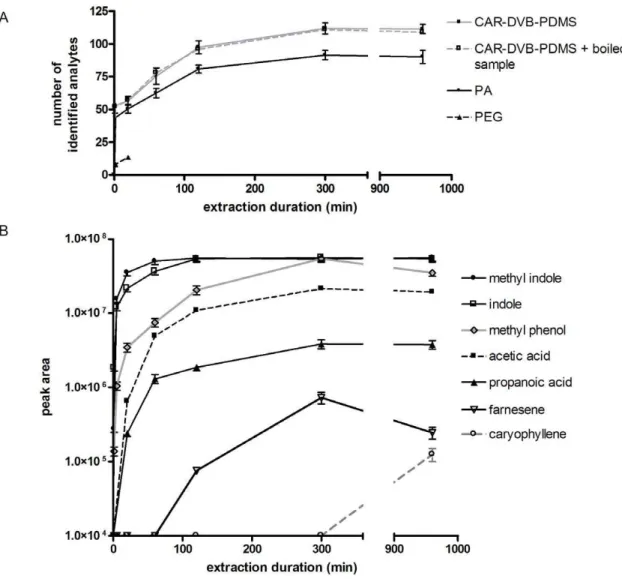
Figure 1. Extraction duration and headspace SPME of human feces.A) A plot of identified analytes as a function of extraction time. Nonlinear regression fitting the hyperbolic extraction curve yields a Ymaxof 114+/23 for the CAR-DVB-PDMS fiber (R2= 0.9937) and 94+/24 for the PA
fiber (R2= 0.9791). The PEG plot could not be extended beyond 20 min due to an unknown analyte overwhelming the MS detector. Also shown in this plot is the number of identified analytes obtained from a sample that was pretreated by boiling for 5 min before extraction. Essentially no difference in analyte number or composition is observed with the pretreated sample (CAR-DVB-PDMS+boiled sample) relative to an untreated sample (CAR-DVB-PDMS). All samples were analyzed in duplicate. See text for further discussion. B) A plot of area under the chromatographic curve as a function of time for the indicated analytes obtained using the CAR-DVB-PDMS fiber. Differences in extraction rates for the indicated metabolites are apparent.
approved by the Institutional Review Boards at George Mason University and Rush University Medical Center. Study partici-pants provided written informed consent.
Headspace solid-phase microextraction procedure Sample vials were heated to 60uC for 30 minutes then a SPME fiber assembly was manually positioned into the headspace above the feces and the fiber exposed to the volatiles for the duration indicated (the sample vial temperature was held at 60uC for the duration of the exposure). Extraction conditions were tightly controlled to ensure reproducible and quantitative SPME results, particularly with nonequilibrium extraction durations [16]. The fiber assembly was then placed into the GC inlet for thermal desorption of the analytes. The following SPME fibers (Supelco, Bellefonte, PA) were used in our investigation: DVB-PDMS 65mm, PA 85mm, CAR-PDMS 75mm, CAR-PDMS 85mm, PDMS 100mm, PDMS 7mm, PEG 60mm, and CAR-DVB-PDMS 50/30mm. All fibers were preconditioned before use, as per the manufacturer’s instructions. After every sample analysis, the fiber was reanalyzed (without exposure to a sample) to ensure complete desorption of analytes. All analyses were performed in duplicate.
Instruments
Samples were analyzed using an Agilent 7890A GC and 5975C inert XL mass selective detector (MSD) with triple axis detector
(Agilent, Palo Alto, CA) or an Agilent 6890 Plus GC-FID. The GC-MS was equipped with a DB5-MS capillary column (Agilent), 30 m in length, 0.25 mm ID, and 0.25mm film thickness, and a 0.75 mm ID SPME injection port liner operated in splitless mode at varying inlet temperatures, dependent upon the SPME fiber used (see Table 1). The GC-FID was equipped with a DB5-MS capillary column (Agilent, Palo Alto, CA), 15 m in length, 0.25 mm ID, and 0.25mm film thickness, and a 0.75 mm ID SPME injection port liner operated in splitless mode at varying inlet temperatures (Table 1).
GC-MS and GC-FID conditions
For the GC-MS, helium carrier gas was set to 1.17 mL/min flow rate and the GC oven was held at an initial temperature of 35uC for 1 min, ramped to 80uC at 3uC/min, then to 120uC at 10uC/min, and finally to 260uC at 40uC/min. The final temperature of 260uC was held for 1.5 min. The total run time for the analysis method was 25.0 min. The Agilent 5975C MSD was scanned from 30 to 550 amu at a rate of 2.81 scans/s. Compounds were identified using the National Institute of Standards and Technology (NIST, Washington, DC) Automated Mass Spectral Deconvolution and Identification System (AMDIS, ver 2.69) software and mass spectral library (NIST08).
The GC-FID system used helium carrier gas at a flow rate of 1.5 mL/min and the GC oven was held at an initial temperature of 35uC for 1 min, ramped to 80uC at 3uC/min, then to 120uC at
Figure 2. Heat sterilization of human feces.A) Human fecal aliquots, dispensed in vials, were either autoclaved or placed in a boiling water bath then used as inoculum for liquid cultures incubated aerobically or anaerobically, as described in Materials and Methods. While untreated (not autoclaved or boiled) fecal samples display growth in all three media compositions (LB – Luria Bertani media, TSB-cys – tryptic soy broth+0.1% cysteine media, Chamberlain – Chamberlain media) and culturing conditions, autoclaving or boiling the samples abolishes growth. Reported values are average of duplicates. B) Aliquots of a human fecal sample were incubated at 60uC for the indicated duration then used as inoculum for LB-agar plates, as detailed in Materials and Methods. A plot of colony forming units (cfu) as a function of incubation duration illustrates the loss of enteric microbial viability over the first hour of 60uC incubation, with no growth observed after 2 hours and beyond. The experiment was performed in duplicate.
10uC/min, and finally to 260uC at 40uC/min. The final temperature of 260uC was held for 1.5 min. The total run time for the analysis was 25.0 min.
Data processing
Ymaxwas defined by nonlinear regression fitting the extraction duration plot to Y = Ymax*X/(K+X).
Heat maps were prepared from AMDIS analyzed chromato-grams as follows. Only compounds with a spectral match score greater than or equal to 90% were considered. For each fiber type, the analysis was performed in duplicate and the replicate metabolite lists were combined by averaging appropriate peak areas to eliminate redundancies. A color plot matrix was generated, with the fibers as the columns and compound identity as the rows. Peak area values were related to color intensities using indole as the reference compound, as it was ubiquitous to all fibers. Binary plots were generated using retention times from GC-MS and GC-FID chromatograms. Chromatograms were manually aligned and then peaks were partitioned into bins according to retention time values. Replicate samples were combined to eliminate redundancies. A binary matrix was generated, with the fibers as the columns and median bin value as the rows. To condense the overall size of the matrix, rows were excluded if all columns were empty. Black shading identifies the presence of a peak within a bin.
Culturing conditions
Anaerobic and aerobic growth was evaluated by aseptically dispensing 3 mL of Luria-Bertani (LB), tryptic soy broth (TSB) supplemented with 0.1% cysteine, or Chamberlain’s media into 136100 mm glass culture tubes then inoculating using a sterile loop.
The inoculum was obtained from a frozen fecal sample equilibrated to room temperature for 5 min or from frozen fecal samples pre-sterilized before use by immersion in a boiling water bath for 5 min or autoclaving for 15 min, 15 psi, 121uC (negative controls). Aerobic incubations were performed at 37uC, 250 rpm for 18 hr. Anaerobic incubations were performed by placing the culture tube into an activated GasPak EZ pouch (BD Diagnostic Systems, Sparks, MD, USA) then incubating at 37uC for 18 hr. Optical density of the cultures (OD600) was determined using an Agilent 8453 UV-Vis spectrophotometer. All reported values are relative to uninoculated media and are the average of duplicate experiments. To determine colony forming units (cfu), fecal samples were heated to 60uC for the indicated duration, resuspended to an OD600of 1.2 using sterile phosphate buffered saline (PBS), diluted by a series of 10-fold serial dilutions (in PBS), then 100mL of each dilution was used to inoculate duplicate TSB+0.1% cysteine agar plates. Microbial colonies were titered after overnight incubation at 37uC.
Results and Discussion
Extraction duration
different SPME fibers (a 50/30mm CAR-DVB-PDMS, 85mm PA, and a 60mm PEG fiber) in conjunction with GC-MS to identify and quantify the volatile metabolites. To perform the analysis, samples were heated to 60uC for 30 min, then a SPME fiber was placed into the headspace above the sample for various time intervals (ranging from 1 min to 16 hr; the temperature was held constant at 60uC throughout the extraction). Extracted analytes were then immediately desorbed into a GC-MS system and spectral comparison with the NIST08 database facilitated analyte identification. Only compounds with a 90% or greater probability of match to a molecule in the NIST08 library were scored. Figure 1a illustrates a plot of the number of analytes identified as a function of extraction duration. As observed in the Figure, regardless of the extraction duration, the CAR-DVB-PDMS fiber isolated a greater number of identifiable analytes from the sample than did the other tested fibers, highlighting the influence of fiber choice on fecal VOC metabolomics (further addressed below). For both the PA and CAR-DVB-PDMS fibers,
total analyte extraction appears hyperbolic, with a near maximum value (Ymax) occurring with a 960 minute extraction duration (98% of Ymax). In contrast, prolonged extractions with the PEG fiber are problematic, as an unidentified metabolite floods and overwhelms the detector at extraction durations beyond 20 min. As illustrated with the CAR-DVB-PDMS fiber (Fig. 1b), individual analyte extraction rates are analyte specific, with some metabolites (such as indole and methyl indole) rapidly reaching equilibrium and others (such as acetic acid, propanoic acid, and caryophyllene) proceeding more slowly. In some cases (such as observed with methyl phenol and farnesene), metabolite titers plateau then subsequently wane with increased exposure duration, a phenom-ena attributed to higher affinity compounds displacing those with lower affinity for the fiber, thereby lowering the titer of the latter [15].
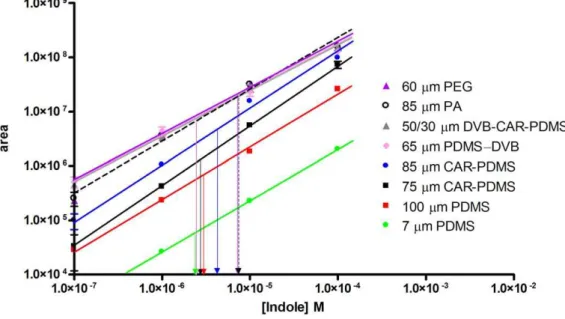
With the exception of the PEG fiber, Fig. 1 illustrates how the number of identified analytes increases with extended extraction duration, reflecting changes in chromatographic peak areas as well Figure 4. Indole standard curves generated by headspace SPME.Chromatographic peak area is plotted as a function of indole concentration, illustrating fiber-dependent differences in the partition coefficient for indole. Peak areas taken from Fig. 3 were used to determine the concentration of indole extracted using each fiber (arrows).
doi:10.1371/journal.pone.0018471.g004
Table 2.Fiber-dependent extraction of metabolites.
SPME Fiber GC-MS (Identities) GC-MS (Retention Time) GC-FID (Retention Time)
totala uniqueb total unique total unique
75mm CAR-PDMS 45 (60) 5 93 (35) 10 109 (50) 6
85mm CAR-PDMS 46 (62) 1 119 (44) 15 119 (54) 6
50/30mm CAR-DVB-PDMS 47 (63) 6 107 (41) 13 157 (71) 16
85mm PA 32 (44) 3 53 (20) 8 82 (37) 4
65mm DVB-PDMS 32 (45) 1 122 (46) 21 138 (63) 8
7mm PDMS 28 (36) 0 90 (34) 20 76 (35) 5
100mm PDMS 29 (49) 1 98 (37) 9 80 (37) 1
60mm PEG 18 (26) 2 74 (28) 12 88 (41) 8
abracketed values are the percentage of total metabolites identified. bnumber of metabolites exclusively associated with the fiber type.
as the appearance of additional peaks in the chromatograms obtained with prolonged extractions. To determine if enteric microbial fermentation occurs during these prolonged extractions, potentially contributing towards the total number of identified analytes (producedex vivo), we compared the VOCs isolated from
unboiled and boiled (sterile) fecal samples and also evaluated the survival of enteric microbes at 60uC. As shown in Fig. 2a, liquid culture media inoculated with boiled or autoclaved fecal samples are devoid of growth under both anaerobic and aerobic conditions, in contrast to cultures inoculated with unboiled samples. Subsequent SPME analysis of the boiled and unboiled samples (60uC extraction; 50/30mm CAR-DVB-PDMS fiber) identifies no discernible difference in either the total number of headspace analytes or the analyte composition (Fig. 1a). Additionally, as shown in Fig. 2b, when the fecal sample is heated to 60uC, the number of viable enteric microbes rapidly declines (90% of microbial viability is lost after 1 hr), with near complete absence of viability observed after 2 hours of heating. Collectively, the results indicate that when headspace SPME of human feces is performed at 60uC, 99.5% of enteric microbial viability is lost after 2 hrs andex vivo microbial
fermentation does not significantly contribute to the headspace VOC composition. Therefore, a 16 hr extraction duration (fiber type permitting) appears well suited to a metabolomic analysis aimed at isolating and identifying the maximum number of analytes. An analyte-specific quantitative analysis, on the other hand, may require individual optimization, as competitive displace-ment may significantly affect metabolite titers.
SPME fiber comparison
1. Using GC-MS and Metabolite Identities. To permit a comparison of all eight commercially available SPME fibers, fecal samples were heated to 60uC for 30 min then the headspace was extracted with an individual fiber for 20 min (the temperature was maintained at 60uC throughout the extraction). Extracted analytes were identified by GC-MS and comparison with the NIST08 mass spectral library. Again, only those compounds with 90% or greater probability of match to a molecule in the mass spectral library were named.
As illustrated in Fig. 3, under the extraction conditions employed, a total of 73 different compounds were identified. Overall, the 73 compounds encompass a wide range of molecular weight and polarity and belong to 10 chemical classes: alcohols (8), ketones (12), aldehydes (13), acid/acid esters (10), amines (1), ethers (2), organosulfurs (5), aromatics (4), alkanes (9), and alkenes (9). Compounds such as acetic acid, propanoic acid, butanoic acid, pentanoic acid, methyl phenol, indole, methyl indole, and butanone are ubiquitously isolated from the sample, regardless of the fiber type. For many of these, fiber-dependent differences in partition coefficients are considerable. Indole, for example, displays a 200 fold difference in peak area among the fiber types (Fig. 3). Indole standard curves indicate that a near identical amount of indole (2.4–7.4mM) was extracted from the sample using each of the tested fibers (Fig. 4), underscoring the importance of standard curves when performing a quantitative, multi-fiber comparative analysis.
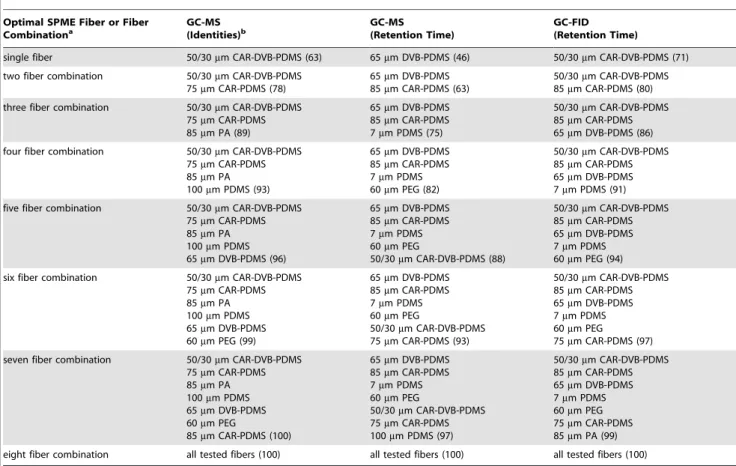
Table 3.Top fiber combinations.
Optimal SPME Fiber or Fiber Combinationa GC-MS (Identities)b GC-MS (Retention Time) GC-FID (Retention Time)
single fiber 50/30mm CAR-DVB-PDMS (63) 65mm DVB-PDMS (46) 50/30mm CAR-DVB-PDMS (71)
two fiber combination 50/30mm CAR-DVB-PDMS 75mm CAR-PDMS (78)
65mm DVB-PDMS 85mm CAR-PDMS (63)
50/30mm CAR-DVB-PDMS 85mm CAR-PDMS (80)
three fiber combination 50/30mm CAR-DVB-PDMS 75mm CAR-PDMS 85mm PA (89)
65mm DVB-PDMS 85mm CAR-PDMS 7mm PDMS (75)
50/30mm CAR-DVB-PDMS 85mm CAR-PDMS 65mm DVB-PDMS (86)
four fiber combination 50/30mm CAR-DVB-PDMS 75mm CAR-PDMS 85mm PA 100mm PDMS (93)
65mm DVB-PDMS 85mm CAR-PDMS 7mm PDMS 60mm PEG (82)
50/30mm CAR-DVB-PDMS 85mm CAR-PDMS 65mm DVB-PDMS 7mm PDMS (91)
five fiber combination 50/30mm CAR-DVB-PDMS 75mm CAR-PDMS 85mm PA 100mm PDMS 65mm DVB-PDMS (96)
65mm DVB-PDMS 85mm CAR-PDMS 7mm PDMS 60mm PEG
50/30mm CAR-DVB-PDMS (88)
50/30mm CAR-DVB-PDMS 85mm CAR-PDMS 65mm DVB-PDMS 7mm PDMS 60mm PEG (94)
six fiber combination 50/30mm CAR-DVB-PDMS 75mm CAR-PDMS 85mm PA 100mm PDMS 65mm DVB-PDMS 60mm PEG (99)
65mm DVB-PDMS 85mm CAR-PDMS 7mm PDMS 60mm PEG
50/30mm CAR-DVB-PDMS 75mm CAR-PDMS (93)
50/30mm CAR-DVB-PDMS 85mm CAR-PDMS 65mm DVB-PDMS 7mm PDMS 60mm PEG 75mm CAR-PDMS (97)
seven fiber combination 50/30mm CAR-DVB-PDMS 75mm CAR-PDMS 85mm PA 100mm PDMS 65mm DVB-PDMS 60mm PEG
85mm CAR-PDMS (100)
65mm DVB-PDMS 85mm CAR-PDMS 7mm PDMS 60mm PEG
50/30mm CAR-DVB-PDMS 75mm CAR-PDMS 100mm PDMS (97)
50/30mm CAR-DVB-PDMS 85mm CAR-PDMS 65mm DVB-PDMS 7mm PDMS 60mm PEG 75mm CAR-PDMS 85mm PA (99)
eight fiber combination all tested fibers (100) all tested fibers (100) all tested fibers (100)
abased on maximal coverage of the total metabolites identified.
bbracketed values are the percentage of total metabolites obtained using all eight fibers.
In terms of total number of metabolites identified, fiber-dependent differences are also observed. Of the 73 total compounds, the 50/30mm CAR-DVB-PDMS fiber affords the greatest proportion, with 47 associated molecules, 6 of which are uniquely obtained with that fiber (Table 2). The 85mm and 75mm CAR-PDMS fibers perform similarly, isolating 46 and 45 total identified metabolites, respectively. Collectively, the results suggest that a human fecal metabolomic analysis intent on obtaining the maximum number of different VOCs requires the use of all but one of the SPME fibers tested (the 7mm PDMS fiber), as this lone fiber does not appear to contribute any unique metabolites to the collective. Alternatively, combinatorial analysis and comparison of optimal fiber combinations identifies a three-, four-, and five-fiber grouping that affords substantial (89–96%) coverage of the total metabolites identified (Table 3) while reducing the number of extractions required, thereby enhancing the throughput of sample analysis. However, before defining an ideal fiber combination, the presence of numerous additional, unidentified peaks associated with each fiber prompted us to compare these results to those obtained from an analysis using peak retention times.
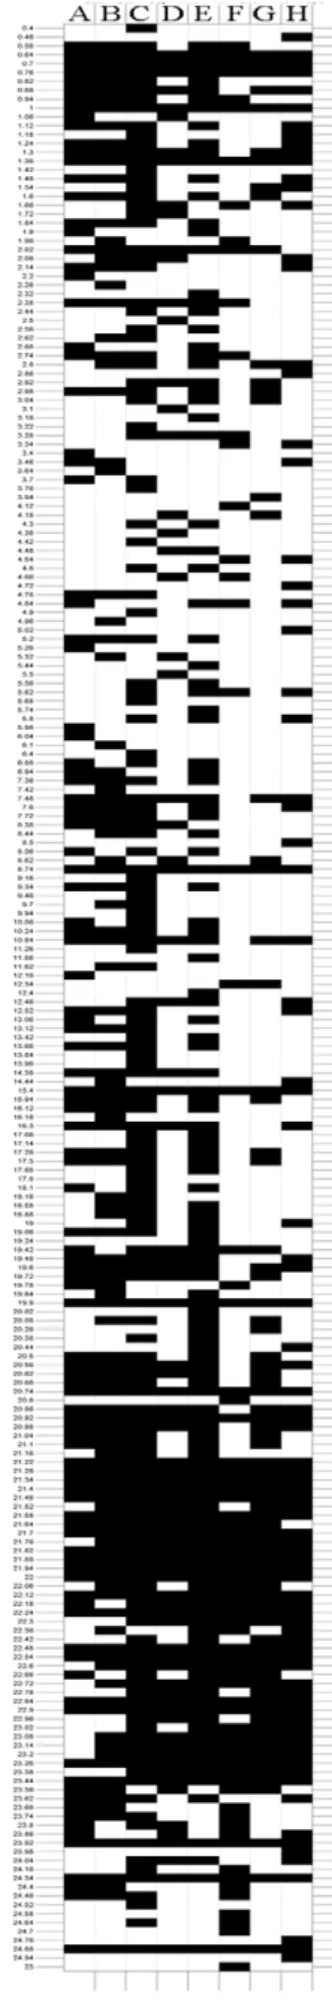
2. Using GC-MS Peak Retention Times. A consequence of focusing solely on identifiable compounds within the GC-MS chromatogram is that a considerable number of metabolites are overlooked. For instance, with the probability-of-match threshold set to 90%, the mass spectral deconvolution and metabolite identification software tentatively identifies an average of 41% of the total number of chromatographic peaks collectively observed in the multi-fiber analysis described above. Since differential metabolomics can be performed in the absence of peak identities, we elected to also compare the eight SPME fibers by evaluation of their total number of associated chromatographic peaks. As illustrated in Fig. 5, under the extraction conditions described above, a total of 267 chromatographic peaks are identified. The majority of these peaks are associated with the 65mm DVB-PDMS, 85mm CAR-PDMS, and 50/30mm CAR-DVB-PDMS fibers, extracting 122, 118, and 108 metabolites, respectively (Table 2). In contrast to the identity-based comparison described above, all of the fiber types are associated with unique peaks, indicating that a comprehensive metabolomic analysis is achieved only when all eight of the tested fibers are used (rather than seven, as suggested above). Combinatorial analysis identifies an optimal five-fiber combination that is sufficient to achieve 88% coverage of the total chromatographic peaks (Table 3), specifically highlighting the grouping of the 50/30mm CAR-DVB-PDMS, 85mm CAR-PDMS, 65mm DVB-PDMS, 7mm PDMS, and 60mm PEG fibers. Interestingly, these fibers represent five of the six different fiber coatings evaluated in our study. To see if this propensity is also observed with an alternative detector type, we next compared fiber-associated chromatographic peaks obtained using GC-FID.
3. SPME fiber comparison using GC-FID. As illustrated in Fig. 6, using extraction conditions identical to those described above, a total of 267 chromatographic peaks are obtained using the eight commercially available SPME fibers in combination with GC-FID. As was observed using GC-MS, the majority of the total peaks are associated with the 50/30mm CAR-DVB-PDMS, Figure 5. Binary plot illustrating the GC-MS chromatographic peaks (metabolites) associated with each SPME fiber.Columns represent the fibers while rows indicate peak retention times. Each extraction was performed in duplicate and replicates combined. Fiber legend: A - 75mm CAR-PDMS, B - 85mm CAR-PDMS, C - 50/30mm CAR-DVB-PDMS, D - 85mm PA, E - 65mm DVB-PDMS, F - 7mm PDMS, G -100mm PDMS, H - 60mm PEG.
65mm DVB-PDMS, and 85mm CAR-PDMS fibers, extracting 71%, 63%, and 54% of the total metabolites, respectively (Table 2). Every fiber tested has at least one associated unique peak, again indicating that a comprehensive analysis requires the use of all eight fibers. However, also in agreement with the GC-MS outcome, combinatorial analysis highlights the grouping of the 50/30mm CAR-DVB-PDMS, 85mm CAR-PDMS, 65mm DVB-PDMS, 7mm PDMS, and 60mm PEG fibers to achieve significant coverage of the total chromatographic peaks (94%; Table 3) while economizing sample processing.
Conclusions
While pioneering fecal VOC metabolomic investigations employed only a 75mm CAR-PDMS fiber, we hypothesized that a single fiber is insufficient for a comprehensive metabolomic analysis due to the chemical diversity of analyte molecules anticipated to be present in human feces. As detailed in Tables 2 and 3, in support of our hypothesis, both GC-MS and GC-FID analyses indicate that maximum metabolite coverage requires the Figure 6. Binary plot illustrating the GC-FID chromatographic peaks (metabolites) associated with each SPME fiber.Columns represent the fibers while rows indicate peak retention times. Each extraction was performed in duplicate and replicates combined. Fiber legend: A - 75mm CAR-PDMS, B - 85mm CAR-PDMS, C - 50/30mm CAR-DVB-PDMS, D - 85mm PA, E - 65mm DVB-PDMS, F - 7mm PDMS, G -100mm PDMS, H - 60mm PEG.
doi:10.1371/journal.pone.0018471.g006
Table 4.Recommended fiber combinations.
Suggested SPME Fiber
Combination Percent coveragea
GC-MS (Identities)
GC-MS (Retention Time)
GC-FID (Retention Time)
50/30mm CAR-DVB-PDMS 85mm CAR-PDMS 65mm DVB-PDMS 7mm PDMS 60mm PEG 75mm CAR-PDMS 85mm PA
99 97 99
50/30mm CAR-DVB-PDMS 85mm CAR-PDMS 65mm DVB-PDMS 7mm PDMS 60mm PEG 75mm CAR-PDMSb
93 93 97
50/30mm CAR-DVB-PDMS 85mm CAR-PDMS 65mm DVB-PDMS 7mm PDMS 60mm PEG
87 88 94
50/30mm CAR-DVB-PDMS 85mm CAR-PDMS 65mm DVB-PDMS 7mm PDMS
84 81 91
50/30mm CAR-DVB-PDMS 85mm CAR-PDMS 65mm DVB-PDMS
78 71 86
apercentage of total metabolites obtained using all eight fibers. bsubstitution with the 85
mm PA fiber results in 92, 92, and 97% coverage, respectively.
use of multiple fibers. While comparison of metabolite identities suggested the 7mm PDMS fiber may be expendable, the corresponding GC-MS chromatogram contains 20 unique un-identified peaks (Table 2). Additionally, GC-FID analysis identifies at least one unique peak associated with every tested fiber, further indicating that maximal metabolite coverage requires the use of all eight commercially available fibers.
Utilizing a 16 hr extraction duration, a reasonably well equipped lab can manually process 8–10 fiber extractions per day. Thus, the number of available samples and study duration will dictate if the use of a complete fiber set is feasible. In an effort to achieve a balance between a comprehensive analysis and enhanced sample throughput, we used a combinatorial examina-tion of the GC-MS and GC-FID results to propose fiber combinations that yield the greatest metabolite coverage (Table 4). For a GC-FID analysis, we suggest a five fiber combination that includes the 50/30mm CAR-DVB-PDMS, 85mm CAR-PDMS, 65mm DVB-PDMS, 7mm PDMS, and 60mm PEG fibers. Collectively, these five fibers encompass 94% of the GC-FID chromatographic peaks obtained using all eight fibers (Table 4). While these same five fibers cover 88% of the total
metabolites detected by GC-MS, this analysis may benefit from the addition of a 75mm CAR-PDMS fiber, as the combination of these six fibers increases the coverage to 93%. It is noteworthy that these same fiber combinations produced similar total metabolite coverage (+/22%) in samples obtained from three different
healthy donors. Additionally, although the five fiber set comprises five of the six different fiber coatings evaluated, it is also noteworthy that the inclusion of the sixth fiber coating (85mm PA) is not as effective as inclusion of the 75mm CAR-PDMS fiber (Table 4).
Acknowledgments
We graciously thank Brian A. Eckenrode for fruitful discussions and assistance with this project.
Author Contributions
Conceived and designed the experiments: ED CC ZR AK PG HR RC. Performed the experiments: ED CC SP LA ZR NK RC. Analyzed the data: ED CC SP LA ZR AK PG HR RC. Contributed reagents/ materials/analysis tools: AK PG HR RC. Wrote the paper: RC.
References
1. Dragonieri S, Annema JT, Schot R, van der Schee MP, Spanevello A, et al. (2009) An electronic nose in the discrimination of patients with non-small cell lung cancer and COPD. Lung Cancer 64: 166–170.
2. Garner CE, Smith S, de Lacy Costello B, White P, Spencer R, et al. (2007) Volatile organic compounds from feces and their potential for diagnosis of gastrointestinal disease. Faseb J 21: 1675–1688.
3. De Lacy Costello B, Ewen R, Ewer AK, Garner CE, Probert CSJ, et al. (2008) An analysis of volatiles in the headspace of the faeces of neonates. J Breath Res 2: 037023.
4. Garner CE, Smith S, Bardhan PK, Ratcliffe NM, Probert CS (2009) A pilot study of faecal volatile organic compounds in faeces from cholera patients in Bangladesh to determine their utility in disease diagnosis. Trans R Soc Trop Med Hyg 103: 1171–1173.
5. Garner CE, Ewer AK, Elasouad K, Power F, Greenwood R, et al. (2009) Analysis of faecal volatile organic compounds in preterm infants who develop necrotising enterocolitis: a pilot study. J Pediatr Gastroenterol Nutr 49: 559–565. 6. Dallinga JW, Robroeks CM, van Berkel JJ, Moonen EJ, Godschalk RW, et al. (2010) Volatile organic compounds in exhaled breath as a diagnostic tool for asthma in children. Clin Exp Allergy 40: 68–76.
7. Phillips M, Altorki N, Austin JH, Cameron RB, Cataneo RN, et al. (2007) Prediction of lung cancer using volatile biomarkers in breath. Cancer Biomark 3: 95–109.
8. Gallagher M, Wysocki CJ, Leyden JJ, Spielman AI, Sun X, et al. (2008) Analyses of volatile organic compounds from human skin. Br J Dermatol 159: 780–791. 9. Phillips M, Cataneo RN, Cheema T, Greenberg J (2004) Increased breath biomarkers of oxidative stress in diabetes mellitus. Clin Chim Acta 344: 189–194.
10. Boland W, Ney P, Jaenicke L, Gassmann G (1984) Analysis of Volatiles; Schreier P, ed. pp 371–380.
11. Schulz S, Fuhlendorff J, Reichenbach H (2004) Identification and synthesis of volatiles released by the myxobacterium Chondromyces crocatus. Tetrahedron 60: 3863–3872.
12. Arthur CL, Pawliszyn J (1990) Solid-Phase Microextraction with Thermal-Desorption Using Fused-Silica Optical Fibers. Analytical Chemistry 62: 2145–2148.
13. Alpendurada MD (2000) Solid-phase microextraction: a promising technique for sample preparation in environmental analysis. Journal of Chromatography A 889: 3–14.
14. Pawliszyn J (1999) Quantitative aspects of SPME; Pawliszyn J, ed. Cambridge: The Royal Society of Chemistry.
15. Koziel J, Jia M, Pawliszyn J (2000) Air sampling with porous solid-phase microextraction fibers. Anal Chem 72: 5178–5186.