Article
Printed in Brazil - ©2011 Sociedade Brasileira de Química0103 - 5053 $6.00+0.00
A
*e-mail: [email protected]
Multiresidue Methods for Determination of Pesticides using SPME and SPE
Followed by GC-NPD System: a Comparative Study
Maria A. L. Milhome,a Paula L. R. Sousa,b Denis De Keukeleirec and
Ronaldo F. Nascimento*,d
aDepartamento de Engenharia Hidráulica e Ambiental, Bloco 713, Centro de Tecnologia and dDepartamento de Química Analítica e Físico-Química, bloco 940, Centro de Ciências,
Universidade Federal do Ceará, Campus do Pici, 60451-970 Fortaleza-CE, Brazil
bFundação Núcleo de Tecnologia Industrial do Ceará (NUTEC), Rua Rômulo Proença s/n, Pici,
60455-700 Fortaleza-CE, Brazil
cGhent University, Faculty of Pharmaceutical Sciences, 9000 Ghent, Belgium
Neste estudo, métodos multirresíduos usando extração em fase sólida (SPE) e microextração em fase sólida (SPME) são comparados na determinação de pesticidas em amostras aquosas. Parâmetros como tipo de fibras e espessura, solvente de eluição, volume da amostra, tempo de equilíbrio, coeficiente de partição e solubilidade foram investigados. Resultados satisfatórios foram obtidos para a análise de pesticidas usando cartuchos C18 e acetato de etila como eluente, com taxas de recuperação entre 75-107%. As melhores condições para SPME foram com uma fibra PDMS 100 µm de espessura, volume de amostra de 40 mL, e tempo de equilíbrio de 45 min. O método SPME é o mais adequado para a análise de pesticidas em água, devido à sua rapidez e simplicidade e ao não uso de solventes. Os limites de detecção e quantificação são inferiores aos limites de concentração máximos estabelecidos pelas autoridades brasileiras, sendo portanto aceitável.
In this study, multiresidue method using solid phase extraction (SPE) and solid phase microextraction (SPME) are compared in the determination of pesticides in aqueous samples. Parameters such as fiber type and thickness, elution solvent, sample volume, equilibration time, partition coefficient and solubility were investigated. Satisfactory results were obtained for the analysis of pesticides using C18 cartridges and ethyl acetate as eluent, whith recovery rates
between 75-107%. The best conditions for SPME fiber were PDMS with a 100 µm thick, sample
volume of 40 mL, and reaction time was 45 min. SPME method is most suitable for the analysis of pesticides in water, due to its speed and simplicity and solvent-free. The limits of detection and quantification are below the maximum concentration limits established by Brazilian authorities and therefore acceptable.
Keywords: pesticides, SPME, water analysis, microextraction, partition coefficient
Introduction
The protection of water quality is a real concern of government agencies that control public health. The worldwide intensive use of pesticides plays a key role in environmental contamination, especially in water resources. In the last years, Brazil has been considered the largest consumer of pesticides in the world.1 Only in
2009, around 1 million ton of pesticides were sold in the
country,mainly applied in soybean, corn, sugarcane and cotton cultures.1 According to ANDEF, there were about
475 active ingredients and 1278 products registered.2
Pesticides that remain in the environment or reach the aquatic systems pose risks to animal species by their toxicity and ability to bio-accumulate along the food chain.3
The European Community has set the value of 0.1 mg L-1
for any individual pesticide and 0.5 mg L-1 for the total
Ministry of Health, by The National Environment Council (CONAMA) Resolution No. 357/2005(classification of water resources), and, recently, by CONAMA Resolution No. 396/2008 (groundwater).4-6
The analysis of pesticides in water is commonly performed by chromatographic methods due to the high accuracies and sensitivities.7 Selective nitrogen and
phosphorus (NPD) detectors are particularly suitable for the analysis of organophosphorus pesticides. However, low-limit of detection of pesticides in aqueous wastes, as required by environmental agencies, necessitates development of highly efficient and reliable extraction procedures. Various techniques have been used for the extraction of pesticide residues in aqueous matrices, such as liquid-liquid extraction and solid-phase extraction (SPE).8-10
Although efficient techniques are known, appropriate adaptation is needed in order to reduce the volume of organic solvents and the analysis time.
Solid-phase extraction is a widely used method that requires small volumes of solvent for elution. However, to achieve very low concentration detection limits in the chromatographic system, analyses in water require large sample volumes. Solid-phase microextraction is simple and fast, therefore, the technique has been applied for the determination of micro-pollutants, including non-volatile and volatile organic compounds, phenolics, polycyclic aromatic hydrocarbons, and pesticides.11,12 The application
of SPME for retention of pesticides has been reported in various matrices including soil,8 food,13,14 river water,15
rain water,16 raw and treated water,17 groundwater18,19
and aqueous matrizes.20-26 The technique consists in the
extraction of analytes using a silica fiber coated with a layer of sorbent, which is exposed directly in the sample or in the headspace. After the equilibrium time has been reached, the fiber is introduced into the chromatographic system for desorption of the analytes. Optimization of SPME involves mainly the selection of the type and the thickness of the fiber, the determination of the exposure time of the analyte in the fiber to reach equilibrium, the influence of the sample volume, the time and the temperature of desorption.27
Several methods have been published multiresidues using detection by mass spectrometry.28-31 However,
nitrogen and phosphorus detector combined with an appropriate extraction method is also able to detect different classes of pesticides with high sensitivity. Our study aimed at comparing SPE and SPME extraction procedures for pre-concentration of selected pesticides from aqueous matrices in order to achieve the detection levels required by Brazilian legislation. The pesticides were selected based on high consumption in regional cultures as well as on control measures by environmental agencies.32
Experimental
Reagents and chemicals
The standard pesticides used in this work were molinate (Sigma, Brazil, purity 99%), methyl parathion (Sigma, Brazil, purity 99.8%), malathion (Sigma, Brazil, purity 99%), chlorpyrifos (Sigma, Brazil, purity 99%), fenitrothion (Sigma, Brazil, purity 99%), pendimethalin (Thorium, Brazil, purity 98.8%), triazophos (Sigma, Brazil, purity 99%). The main physicochemical characteristics of the pesticides studied are given in Table 1.
Methanol (Vetec, Brazil ), ethyl acetate (Vetec, Brazil), hexane (Vetec, Brazil), acetone (Vetec, Brazil), and dichloromethane (Vetec, Brazil ) and Milli-Q water was used for the preparation of solutions and the extraction of samples.
Standards and samples
Stock solutions of individual pesticides were prepared by diluting 10 mg of the analyte in 10 mL of ethyl acetate. Solutions of mixtures of pesticides (10 mg L-1) were
prepared from solutions of individual pesticides. Calibration curve were obtained in the range 0.005-1.500 mg L-1 and
value of the correlation coefficient (R) of each compound.
Solid-phase extraction (SPE)
The recovery of the pesticides was achieved by solid-phase extraction (SPE) using a Manifold System (Supelco, São Paulo, Brazil), which enables extraction of up to 12 samples simultaneously. C18 and Florisil cartridges of 500 mg per 6 mL were used. Different solvents (dichloromethane, ethyl acetate and hexane:acetone) were tested for elution of the analytes. The SPE cartridge was previously conditioned with 10 mL methanol:water (80:20 v/v) and 10 mL methanol (30% v/v). Aqueous solutions containing the pesticides (250 mL) were percolated through the cartridges at a flow rate of 2 mL min-1.
The analytes were eluted with 1 mL of an adequate solvent and then injected in duplicate in a gas chromatograph coupled to a selective nitrogen-phosphorus detector (GC-NPD). Four concentrations (1.0, 2.0, 4.0 and 8.0 µg L-1) were used to
investigate the recovery of the pesticides for each cartridge and eluting solvent selected. Calibration curves were allowed to obtain the value of the correlation coefficient (R) of each compound.
Solid-phase microextraction (SPME)
(75 µm thickness) were evaluated for their extraction efficiencies towards the pesticides. The fibers were initially conditioned for at least 1 h at 250-300 °C, according to the manufacturer’s instructions. The conditioned fiber was immersed into the aqueous solution and maintained at the equilibrium time under stirring (150 rpm) at ambient temperature (28 ± 2 °C). After extraction, the fiber was thermally desorbed during 5-10 min into the glass liner of the GC injection port. The equilibrium time was determined by varying the exposure time of the fiber in 30 mL of a spiked sample (4 µg L-1) for 15, 30, 45 and 60 min. The
effects of the sample volumes on the retention of the
pesticides were evaluated using volumes of 20, 40 and 80 mL. A five-level calibration curve was constructed using aqueous standards (1.0 to 8.0 µg L-1) that were extracted in
the same conditions as those applied for the samples. The values of the limits of detection and of quantification were calculated by equations 1 and 2, respectively,
LOD = 3.3 × (s/S) (1) LOQ = 10 × (s/S) (2)
where s is the standard deviation of the lower level of detection (7 injections) and S is the slope of the curve.
Table 1. Main physicochemical characteristics of the pesticides studied
Pesticide Structure Class Toxicity Solubility / (mg L-1) log K
ow
Molinate Thiocarbamates II 1100 2.86
Methyl parathion Organophosphates I 55 3.00
Fenitrothion Organophosphates II 19 3.32
Malathion Organophosphates III 148 2.75
Clorpyrifos Organophosphates II 1.05 4.70
Pendimethalin Dinitroanilines III 0.33 5.20
Chromatographic conditions
The analyses of the pesticides were performed using a gas chromatograph (GC-Trace, Thermo Finnigan) equipped with a split/splitless injector and a selective nitrogen-phosphorus detector (NPD). All separations were accomplished on a OV-5 column (30 m × 0.25 mm I.D. × 0.25 µm thickness). The initial temperature of the oven was 100 °C and the temperature was increased to 150 °C at a rate of 25 °C min-1, then to 290 ºC at a rate
of 30 °C min-1. The temperatures of the injector and the
detector were set at 250 °C and 300 °C, respectively. The splitless injection mode was used (at 2 min) and 2 µL of the sample volume was injected. Helium was used as the carrier gas at a flow rate of 1 mL min-1.
Results and Discussion
Chromatographic separation and calibration curves
Initially, solutions of individual pesticides were studied in order to determine the retention time in GC system, afterwards the mixture of the pesticides was separated using a suitable temperature program. The retention times and the calibration curves are given in Table 2. The calibration curves for all five analytes were linear over the range 0.005-1.500 mg L-1, as shown in Table 2. The coefficient of
correlation, R, exceeded 0.99 for all the compounds studied.
Solid-phase extraction (SPE)
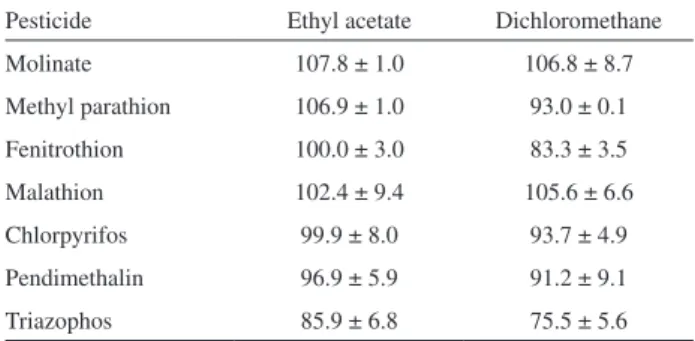
Selection of adsorbent and eluent
Experiments were conducted to evaluate the recovery of the pesticides using C18 and florisil cartridges. The best results were obtained for C18 cartridges with recoveries between 75% and 107%, while low recoveries were observed using florisil cartridges. Ethyl acetate (ACET) and dichloromethane (DCM) were suitable eluents on the C18 cartridges (Table 3). Ethyl acetate was selected in
view of the superior recoveries (85-107%) with respect to dichloromethane (75-106%).
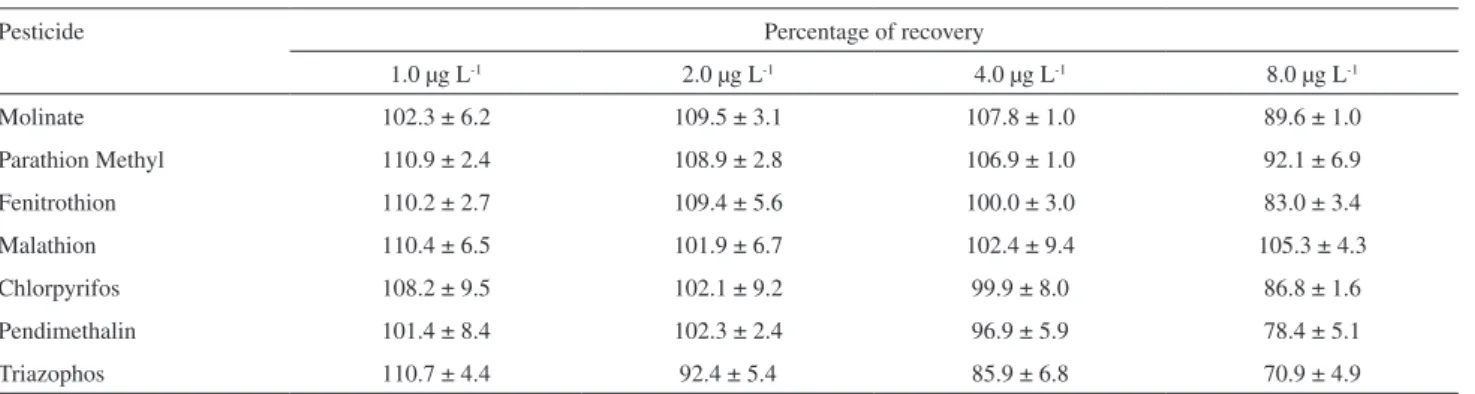
Accuracy, precision and linearity
The recoveries obtained for each concentration (Table 4) proved to be reproducible, as represented by the low values of the standard deviations. Neto and Siqueira,9
also used C18 cartridges and ethyl acetate as eluent to monitor organophosporus pesticides.
Solid-phase microextraction (SPME)
Effect of film thickness and nature fiber on the extraction of pesticides
Figure 1 shows the results of the extraction of pesticides by using two different SPME fibers. Clearly, the 100 µm PDMS fiber shows a higher efficiency than the 75 µm carboxen-PDMS. Besides the type of the fiber, the thickness may also influence the extraction efficiency, because thicker fibers tend to retain higher amounts of analytes.11
PDMS fiber values mass calculated for parathion, malathion, chlorpyrifos, pendimethalin and triazophos were higher than carboxen-PDMS fiber, except for molinate. Thereby the values mass on PDMS fiber for chlorpyrifos and pendimethalin are particularly noteworthy because it is around 5 times higher than the
Table 3. Selection of eluent using C18 cartridges of 500 mg per 6 mL
Pesticide Ethyl acetate Dichloromethane
Molinate 107.8 ± 1.0 106.8 ± 8.7
Methyl parathion 106.9 ± 1.0 93.0 ± 0.1
Fenitrothion 100.0 ± 3.0 83.3 ± 3.5
Malathion 102.4 ± 9.4 105.6 ± 6.6
Chlorpyrifos 99.9 ± 8.0 93.7 ± 4.9
Pendimethalin 96.9 ± 5.9 91.2 ± 9.1
Triazophos 85.9 ± 6.8 75.5 ± 5.6
Table 2. Retention times and calibration curves of the pesticides in water
Pesticide Retention time / min Curve R
Molinate 6.9 y = 2055331.3x − 91606.9 0.9949
Methyl parathion 11.9 y = 45023892.6x − 3525506.1 0.9937
Fenitrothion 12.7 y = 45919859.5x − 3359386.9 0.9963
Malathion 13.0 y = 36381803.7x − 1460032.9 0.9981
Chlorpyrifos 13.4 y = 44159628.2x − 1695684.8 0.9987
Pendimethalin 14.3 y = 1497785.7x − 79709.3 0.9952
pesticides cited. This can be verified by the values of log Kow, shown in Table 1. The pesticides whith lower
polarity, chlorpyrifos (log Kow = 4.7) and pendimentalina
(log Kow = 5.2), showed a higher amount of mass retained
due to higher affinity for the PDMS fiber (nonpolar). Similar results were found by Beltran et al.33and Silva et
al.34 for extraction of organophosphorus pesticides using
PDMS and PA fibers.
According to Dugay et al.,12 carboxen-PDMS fibers
are particularly suitable for lower-molecular-weight and more volatile analytes. Thus, the PDMS fiber of 100 µm thickness was used in the subsequent studies.
Experimental determination of the partition coefficient (K)
It’s well known that the equilibration time depends on the partition coefficient (K) and for higher the K value, more the larger the amount extracted at equilibrium.35 The
results may be interpreted via the partition coefficients (K)
of the analyte between the stationary and the aqueous phase. According to equation 3, higher values of K give higher extraction efficiencies:
(3)
where ns is the number of moles of analyte, Vaq is the sample
volume, Vs is the volume of the stationary phase and Caq
is the initial concentration of the analyte. The value of Vs
can be calculate as
Vs = π L ( e2 + ea) (4)
where e is the film thickness and a is the diameter of the fiber of the silica rod.
Taking into account the precision on both Vs and n, and
the fact that equilibrium should be reached before n values can be determined, the partition coefficient values can only be approximated.
The values of K have been determined using two types of fibers and the values are shown in Table 5. The high values of K were obtained for the PDMS fiber. Although an analyte may have been more efficiently retained, the K values depend also the fiber thickness.The results obtained in this study show that K values can vary with film thickness, depending on the analyte.
Table 5. K values as a function of the film thickness of fibers at equilibrium
Pesticides KCARB/PDMS (75 µm) KPDMS (100 µm)
Molinate 4.03 × 10² 3.15× 10²
Methyl parathion 1.20 × 10² 2.53 × 10²
Fenitrothion 1.15 × 10² 6.16 × 10²
Malathion 1.38 × 10² 3.09 × 10²
Chlorpyrifos 2.07 × 10² 7.77 × 10²
Pendimethalin 1.66 × 10² 8.95 × 10²
Triazophos 1.88 × 10² 6.73 × 10²
Table 4. Results of percentages of recovery of the pesticides in water sample using SPE
Pesticide Percentage of recovery
1.0 µg L-1 2.0 µg L-1 4.0 µg L-1 8.0 µg L-1
Molinate 102.3 ± 6.2 109.5 ± 3.1 107.8 ± 1.0 89.6 ± 1.0
Parathion Methyl 110.9 ± 2.4 108.9 ± 2.8 106.9 ± 1.0 92.1 ± 6.9
Fenitrothion 110.2 ± 2.7 109.4 ± 5.6 100.0 ± 3.0 83.0 ± 3.4
Malathion 110.4 ± 6.5 101.9 ± 6.7 102.4 ± 9.4 105.3 ± 4.3
Chlorpyrifos 108.2 ± 9.5 102.1 ± 9.2 99.9 ± 8.0 86.8 ± 1.6
Pendimethalin 101.4 ± 8.4 102.3 ± 2.4 96.9 ± 5.9 78.4 ± 5.1
Triazophos 110.7 ± 4.4 92.4 ± 5.4 85.9 ± 6.8 70.9 ± 4.9
Determination of the equilibrium time
The study of the equilibrium time was carried out by determining the extracted amount as a function of the exposure time obtained with the PDMS fiber at a concentration of 4.0 µg L-1. According to the results the
equilibrium is reached in about 30 min for most compounds, except for chlorpyrifos and pendimethalin. Thus, we adopted a time of 45 min for further studies to ensure total retention of the pesticides. Other authors also found times between 15 and 45 min suitable for extraction of pesticides from water.16,36,37
Clearly, water solubility was important, but not the only, factor in determining the overall partition ratio for a given analyte between the carboxen- PDMS fiber coating and water.
Variation of the sample volume
Different volumes were investigated for the extraction of pesticides by SPME. As shown in Table 6, it appears that a volume of 40 mL is sufficient for recovery of the pesticides under the conditions used, and, therefore, this volume was used for subsequent experiments.
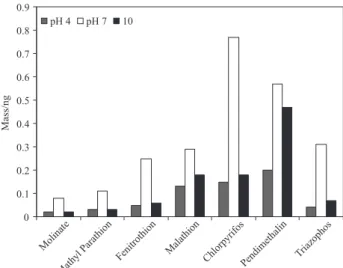
Influence of pH of the sample
The Figure 2 shows the effect of pH of the sample in the retention of pesticides using SPME. According to the results, at pH 3, 7 and 9 did not significantly influence the extraction of pesticides molinate, atrazine, methyl parathion, fenitrothion, pendimentalina and triazophos. The pesticide malathion and chlorpyrifos were extracted with higher efficiency at pH 7.
Efficiency of extraction by SPME
The efficiency of extraction of the pesticides was evaluated using four concentrations. The response was linear in the concentration range studied (1.0 to 8.0 µg L-1),
as represented by the correlation coefficients of about 1. The calibration curves and recoverie rates of the pesticides after extraction by SPME are show in Table 7.
Comparison of SPE and SPME extraction efficiencies
Table 8 summarizes the limits of detection (LOD) and limits of quantification (LOQ) values calculated for
Figure 2. Influence of pH of the sample. Experimental conditions: 100 µm PDMS, 30 min extraction; sample volume 30 mL; stirring (150 rpm) and 1 µg L-1 of each analyte.
Table 6. Sample volume used for extraction of pesticides by SPME
Volume / mL mass / ng
Molinate Methyl parathion Fenitrothion Malathion Chlorpyrifos Pendimethalin Triazophos
20 0.86 0.61 1.49 0.78 3.12 3.94 1.00
40 0.87 0.77 1.68 0.91 3.38 3.96 1.79
80 0.73 0.84 1.78 1.03 3.54 3.12 1.46
Table 7. Calibration curves and percentage of recovery of the pesticides after extraction by SPME
Pesticide Percentage of recovery
Curve R
1.0 µg L-1 2.0 µg L-1 4.0 µg L-1 8.0 µg L-1
Molinate 94.1 ± 5.2 97.5 ± 7.8 104.4 ± 8.3 99.1 ± 5.3 y = 151049182.6x + 157838.5 0.9985
Methyl parathion 102.8 ± 9.8 96.2 ± 6.2 101.6 ± 3.7 99.8 ± 6.8 y = 2893135373.9x + 683244.3 0.9996
Fenitrothion 99.1 ± 6.3 95.2 ± 7.1 94.3 ± 4.6 101.4 ± 4.2 y = 9057371182.6x – 1214367.4 0.9959
Malathion 74.8 ± 9.1 102.6 ± 8.4 109.1 ± 8.4 98.0 ± 5.6 y = 2803993600.0x + 2588769.0 0.9923
Chlorpyrifos 108.6 ± 4.2 87.3 ± 5.9 101.0 ± 6.8 100.2 ± 8.3 y = 9226153156.5x + 7819595.9 0.9964
Pendimethalin 105.0 ± 8.7 93.2 ± 7.3 91.7 ± 4.5 102.0 ± 7.4 y = 389266365.2x + 134198.1 0.9914
all analytes studied, beyond maximum limit permitted in the Brazil. The LOD values using SPME for parathion, malathion, fenitrothion, chlorpyrifos, pendimethalin and triazophos were lower than LOD using SPE, except for molinate. Thereby the LOD value using SPME for malathion is particularly noteworthy because it is around 50 times lower than the regulatory limit cited in CONAMA (Brazil). Tomkins and Ilgner,38 found similar results for
malathion using a 65-mm thickness polydimethylsiloxane-divinylbenzene (PDMS-DVB) fiber.
Table 9 gives the detection limit of some pesticides found by other authors33,39 by using different SPME fibers
with detection by GC-NPD or GC-MS system. The values are comparable to those found in the present study.
The extraction efficiencies for SPME and SPE are comparable and concentration levels below those required in current legislation were attained (Table 8). For routine analysis, SPME should be preferred because of the rapidity, sensibility, and free-solvent.
Conclusions
The present study shows that both solid-phase extraction (SPE) and solid-phase microextraction (SPME)
are highly efficient for the analysis of pesticides using C18 cartridges and ethyl acetate as the eluent, as represented by the high recovery rates. The best conditions for SPME were obtained with a PDMS fiber of 100 µm thickness, a sample volume of 40 mL, and an equilibration time of 45 min. Both procedures showed a linear response in the concentration range between 1.0 and 8.0 µg L-1. SPME is most suitable
for the analysis of pesticides in water based on the rapidity of the method and the restricted use of eluent. The limits of detection and the limits of quantification are well below the maximum limits set by the Brazilian authorities.
Acknowledgments
The authors are grateful to the support from CNPq, CAPES, FUNCAP and Fundação Nucleo de Tecnologia Industrial do Ceará - NUTEC (Proc. No. 223.02.00/09).
References
1. http://www.visaobrasil.org/2010/03/ accessed in March 2011. 2. http://www.mmcbrasil.com.br/ accessed in April 2010.
3. Spiro, T. G.; Stigliani,W. M.; Química Ambiental; Pearson: São Paulo, Brasil, 2008.
Table 8. Limits of detection (LOD) and limits of quantification (LOQ) of pesticides analized whith SPE and SPME, and the maximum limit permitted in Brazil
Pesticide SPE SPME Maximum limit permitted / (µg L-1)
LOD / (µg L-1)
LOQ / (µg L-1)
LOD / (µg L-1)
LOQ / (µg L-1)
Portaria MS 518/2004
Conama 357/2005
Conama 396/2008
Molinate 0.23 0.70 0.36 1.08 6 - 6
Methyl parathion 0.09 0.27 0.02 0.07 - -
-Fenitrothion 0.12 0.36 0.01 0.03 - -
-Malathion 0.21 0.63 0.07 0.22 - 100 190
Chlorpyrifos 0.37 1.14 0.03 0.09 - - 30
Pendimethalin 0.36 1.08 0.08 0.23 20 - 20
Triazophos 0.23 0.69 0.08 0.25 - -
-Table 9. Limits of detection (LOD) of the pesticides using different analytical techniques and comparison with our results
Pesticide LOD / (µg L-1)
PDMS/GC-NPD (present study) PA / GC-MS38 PDMS / GC-NPD38 CW-DVB / GC-NPD12
Molinate 0.356
Methyl parathion 0.023 0.136
Fenitrothion 0.010 0.008 0.03
Malathion 0.072 0.04
Chlorpyrifos 0.030 0.03
Fenamiphos 0.05 0.02
Pendimethalin 0.076
Triazophos 0.083 0.056
4. http://portal.saude.gov.br/portal/arquivos/pdf/portaria_518.pdf accessed in May 2011.
5. http://www.mma.gov.br/port/conama/res/res05/res35705.pdf accessed in May 2011.
6. h t t p : / / w w w. m m a . g o v. b r / p o r t / c o n a m a / l e g i a b r e . cfm?codlegi=562 accessed in May 2011.
7. Brito, N. M.; Junior, O. P. A.; Polese, L.; Pesticidas: R. Ecotoxicol. Meio Ambiente2003, 13, 129.
8. Rissato, S. R.;, Libânio, M.; Giafferis, G. P.; Gerenutti, M.;
Quim. Nova2004,27, 739.
9. Neto, A. J. S.; Siqueira, M. E. P. B.; Quim. Nova2005, 28, 747. 10. Eaton, A. D.; Clesceri, L. S.; Rice, E. W.; Greenberg, A.
E.; Standard Methods for the Examination of Water and Wastewater, 21th ed.; American Public Health Association:
Washington, 2005, ch. 6.
11. Pawliszyn, J.; Solid Phase Microextraction - Theory and Practice, Wiley-VCH: Canada, 1997.
12. Dugay, J.; Miege, C.; Hennion, M.-C.; J. Chromatogr., A1998,
795, 27.
13. Fytianos, K.; Raikos, N.; Theodoridis, G.; Velinova, Z.; Tsoukali, H.; Chemosphere2006, 65, 2090.
14. Blasco, C.; Fernández, M.; Pico, Y.; Font, G.; J. Chromatogr., A2004, 1030, 77.
15. Chagas, C. M.; Queiroz, M. E. L. R.; Neves, A. A.; Queiroz, J. H.; Oliveira, T. T.; Nagem, T. J.; Quim. Nova1999, 22, 506. 16. Sauret-Szczepanski, N.; Mirabel, P.; Wortham, H.; Environ.
Pollut. 2006, 139, 133.
17. Simões, N. G.; Cardoso, V. V.; Ferreira, E.; Benoliel, M. J.; Almeida, C. M. M.; Chemosphere2007, 68, 501.
18. Tomkins, B. A.; Ilgner, R. H.; J. Chromatogr., A2002, 972, 183. 19. Filho, A. M.; dos Santos, F. N.; Pereira, P. A. P.; Microchem. J.
2010, 96, 139.
20. Sng, M. T.; Lee, F. K.; Lakso, H. A.; J. Chromatogr., A1997,
759, 225.
21. Boussahel, S.; Bouland, K. M.; Moussaoui, M.; Baudu, A.;
Water Res. 2002, 36, 1909.
22. Sakamoto, M.; Tsutsumi, T.; J. Chromatogr., A2004,1028, 63. 23. Dong, C.; Zeng, Z.; Yang, M.; Water Res. 2005, 39, 4204. 24. Passeport, E.; Guenne, A.; Culhaoglu, T.; Moreau, S.; Bouyé,
J.-M.; Tournebize, J.; J. Chromatogr., A 2010, 1217, 5317. 25. Pinto, M. I.; Sontag, G.; Bernardino, R. J.; Noronha, J. P.;
Microchem. J.2010, 96, 225.
26. Tankiewicz, M.; Fenik, J.; Biziuk, M.; TrAC, Trends Anal. Chem.
2000, 29, 1050.
27. Krutz, J.; Senseman L. S.A.; Sciumbato, A. S.; J. Chromatogr., A2003, 999, 103.
28. Quintana, J.; Martí, I.; Ventura, F.; J. Chromatogr., A 2001, 938,
3.
29. Natangelo, M.; Tavazzi, S.; Fanelli, R.; Benfenati, E.;
J. Chromatogr., A1999,859, 193.
30. Nogueira, J. M. F.; Sandra, T.; Sandra, P.; Anal. Chim. Acta
2004, 505, 209.
31. Gervais, G.; Brosillon, S.; Laplanche, A.; Helen C.;
J. Chromatogr., A 2008, 1202, 163.
32. Milhome, M. A. L.; Sousa, D. O. B.; Lima, F. A. F.; Nascimento, R. F.; Eng. Sanit. Ambient. 2009, 14, 363.
33. Beltran, J.; Lopez, F. J.; Cepria, O.; Hernandez, F.; J. Chromatogr., A1998, 808, 257.
34. Silva, F. C.; Cardel, Z. L.; Carvalho, C. R.; Quim. Nova1999,
22,197.
35. Zimmermann, T.; Ensinger, W. J.; Schmidt, T. C.;
J. Chromatogr., A 2006, 1102, 51.
36. Barrionuevo W. R.; Lanças, F. M.; Quim. Nova2001, 24, 172. 37. Komatsu, E.; Vaz, J. M.; Quim. Nova2004, 27, 720. 38. Tomkins, B. A.; Ilgner, R. H.; J. Chromatogr., A2002, 972, 183. 39. Valor, I.; Moltó, J. C.; Apraiz, D.; Font, G.; J. Chromatogr., A
1997,767, 195.
Submitted: March 19, 2011