CPD
4, 1265–1287, 2008Tibetan plateau glacial forcing and
Holocene climate
L. Jin et al.
Title Page
Abstract Introduction
Conclusions References
Tables Figures
◭ ◮
◭ ◮
Back Close
Full Screen / Esc
Printer-friendly Version
Interactive Discussion
Clim. Past Discuss., 4, 1265–1287, 2008 www.clim-past-discuss.net/4/1265/2008/
© Author(s) 2008. This work is distributed under the Creative Commons Attribution 3.0 License.
Climate of the Past Discussions
Climate of the Past Discussionsis the access reviewed discussion forum ofClimate of the Past
Modeling sensitivity study of the possible
impact of snow and glaciers developing
over Tibetan Plateau on Holocene
African-Asian summer monsoon climate
L. Jin1, Y. Peng1, F. Chen1, and A. Ganopolski2
1
Key Laboratory of Western China’s Environmental Systems (Ministry of Education), Lanzhou University, Lanzhou 730000, China
2
Potsdam Institute for Climate Impact Research, Potsdam, Germany
Received: 13 October 2008 – Accepted: 14 November 2008 – Published: 11 December 2008
Correspondence to: L. Jin ([email protected])
CPD
4, 1265–1287, 2008Tibetan plateau glacial forcing and
Holocene climate
L. Jin et al.
Title Page
Abstract Introduction
Conclusions References
Tables Figures
◭ ◮
◭ ◮
Back Close
Full Screen / Esc
Printer-friendly Version
Interactive Discussion
Abstract
The impacts of various scenarios of snow and glaciers developing over the Tibetan Plateau on climate change in Afro-Asian monsoon region and other regions during the Holocene (9 kyr BP–0 kyr BP) are studied by using the coupled climate model of inter-mediate complexity, CLIMBER-2. The simulations show that the imposed snow and 5
glaciers over the Tibetan Plateau in the mid-Holocene induce global summer tempera-ture decreases, especially in the northern parts of Europe, Asia, and North America. At the same time, with the imposed snow and glaciers, summer precipitation decreases strongly in North Africa and South Asia as well as northeastern China, while it in-creases in Southeast Asia and the Mediterranean. For the whole period of Holocene 10
(9 kyr BP–0 kyr BP), the response of vegetation cover to the imposed snow and glaciers cover over the Tibetan Plateau is not synchronous in South Asia and in North Africa, showing an earlier and a more rapid decrease in vegetation cover in North Africa from 9 to 6 kyr BP while it has only minor influence on that in South Asia until 5 kyr BP. Im-posed gradually increased snow and glacier cover over the Tibetan Plateau causes 15
temperature increases in South Asia and it decreases in North Africa and Southeast Asia during 6 kyr BP to 0 kyr BP. The precipitation decreases rapidly in North Africa and South Asia while it decreases slowly or unchanged during 6 kyr BP to 0 kyr BP with
imposed snow and glacier cover over the Tibetan Plateau. The different scenarios of
snow and glacier developing over the Tibetan Plateau would result in differences in
20
variation of temperature, precipitation and vegetation cover in North Africa, South Asia and Southeast Asia. The model results show that the response of climate change in African-Asian monsoon region to snow and glacier cover over the Tibetan Plateau is
in the way that the snow and glaciers amplify the effect of vegetation feedback and,
CPD
4, 1265–1287, 2008Tibetan plateau glacial forcing and
Holocene climate
L. Jin et al.
Title Page
Abstract Introduction
Conclusions References
Tables Figures
◭ ◮
◭ ◮
Back Close
Full Screen / Esc
Printer-friendly Version
Interactive Discussion
1 Introduction
Holocene climate change is one of the focus themes both in paleoclimate modeling and proxy data reconstruction communities. By examining 50 globally distributed pale-oclimate records, Mayewski et al. (2004) revealed as many as six periods of significant rapid climate change during the Holocene which were synchronous of the whole Earth. 5
It is suggested that changes in insolation related both to Earth’s orbital variations and to solar variability played a central role in the global scale changes in climate of the last 11.5 cal kyr (Mayewski et al., 2004). This insolation driving mechanism in the Holocene climate change is supported by climate modeling experiments of the variation of trop-ical monsoon climate in North Africa and South Asia (Kutzbach and Guetter, 1986; 10
COHMAP Members, 1988) and of changes in the African-Asian monsoon precipita-tion (Weber et al., 2004). However, external forcing, e.g., the Earth’s orbital variaprecipita-tions and the solar variability, can be amplified and modified through a number of feedbacks within the climate system leading to marked climate variations in the Holocene (Fo-ley et al., 1994; TEMPO Members, 1996; Claussen and Gayler, 1997; Ganopolski et 15
al., 1998b; Wang, 1999). The atmosphere-vegetation feedback is an important am-plifying factor of the North Africa’s abrupt climate transition from a wet phase to a dry phase starting at around 6 kyr BP (Texier et al., 1997; Claussen et al., 1999). Stud-ies from lake sediment pollen and carbonate records showed the arid phase in South Asia probably started around 5 kyr BP (Maxwell, 2001; Singh, 2002), coinciding with 20
a stepwise weakening of the southwest monsoon (Gupta and Anderson, 2005), which was closely linked to North Atlantic cold spells, e.g., the millennial-scale cold events during 4.6–4.2 kyr BP (Gupta et al., 2003). In addition, it is indicated that the so-called “Megathemal” or “Holocene Optimum” from 8.5–3.0 kyr BP often mentioned in the Chi-nese Quaternary and paleoclimate community (Huang, 1998; Qin, 2002), as defined 25
by peak precipitation or effective moisture, is asynchronous in eastern Asian monsoon
CPD
4, 1265–1287, 2008Tibetan plateau glacial forcing and
Holocene climate
L. Jin et al.
Title Page
Abstract Introduction
Conclusions References
Tables Figures
◭ ◮
◭ ◮
Back Close
Full Screen / Esc
Printer-friendly Version
Interactive Discussion
The Tibetan Plateau, with a mean elevation of ca 4.5 km above sea level and an area
of 2.5×10⁶km2, is one of the most imposing topographic features in Central Asia and
the greatest glaciated areas outside the Polar Regions. The Tibetan Plateau has a pro-found influence on regional and global atmospheric circulation and is therefore impor-tant for our understanding the dynamics of global environmental and climatic change 5
(Ruddiman and Kuzbach, 1989; Molnar and England, 1990; Prell and Kutzbach, 1992; Yanai et al., 1992). Studies of glacier changes during the late Quaternary were con-ducted over the Tibetan Plateau and significant progress has been made in recent years (Lehmkuhl and Oven, 2005). Earlier study has revealed that there were inter-vals of glacier advances over the Tibetan Plateau during the Holocene at about 8.2– 10
7.2 kyr BP, 5.8–4.9 kyr BP, 3 kyr BP and 300–450 yr BP, respectively (Lehmkuhl, 1997).
Observation from the Dasuopu glacier (28◦23′N, 85◦43′E) (located in the
southwest-ern region of the Tibetan Plateau) shows a gradually increase of snow accumulation from AD 1600 to 1817, and then a significant increase persisted until AD 1880
(Thomp-son et al., 2000). At another glacier site, the Guliya ice cap (35◦17′N, 81◦29′E) which
15
is located in northwestern region of the Tibetan Plateau and whose records is believed to cover more than 100 000 years, spanning the whole Holocene to the last interglacial
(Christner et al., 2003) showed a rapid decrease in temperature up to 3∼4◦C during
the period of 7–5 kyr BP (Thompson et al., 1997; Yao et al., 2000). Glaciers at Nanga
Parbat (35◦14′15′′N, 74◦35′21′′E), north western Himalaya Mountains, expanded
dur-20
ing the early to middle Holocene ca. 9.0–5.5 ka (Phillips et al., 2000). Evidence from oxygen isotope records in the Bay of Bengal shows that during early-middle Holocene, the Himalayas experienced at least two significant episodes of aridity and intensified glaciation at 5–4.3 kyr BP and ca. 2 kyr BP (Chauhan, 2003). Recently, evidence based on radiocarbon ages of fossil wood buried in moraines, lichen-dated moraines and 25
bal-CPD
4, 1265–1287, 2008Tibetan plateau glacial forcing and
Holocene climate
L. Jin et al.
Title Page
Abstract Introduction
Conclusions References
Tables Figures
◭ ◮
◭ ◮
Back Close
Full Screen / Esc
Printer-friendly Version
Interactive Discussion
ance for the Tibetan Plateau for the present day, and for the past simulations, under the insolation forcings at 3 kyr BP, 6 kyr BP, 8 kyr BP and 11 kyr BP. Their result show that the area with positive ice-sheet mass balance expands from 11 kyr BP to 0 kyr BP (Casal et al., 2004, Fig. 11). Both observation and modeling of glacier development over the Tibetan Plateau suggest that the Tibetan Plateau may have experienced a 5
glacier fluctuation during the Holocene. There are different suggestions concerning
the controlling factors on glacier expansion over Tibetan Plateau during the Holocene. Thompson et al. (2006) suggest that glacier expansion on the southern and central Ti-betan Plateau is driven mainly by variation in monsoonal precipitation that is modulated by precession-driven insolation changes, while Yang et al. (2008) argued that it is the 10
temperature change rather than precipitation change caused by variations of the south Asian summer monsoon that is the controlling factor for glacier fluctuation during the late Holocene.
In a previous model study using CLIMBER-2, Jin et al. (2005) studied the impacts of ice and snow cover over the Tibetan Plateau on Holocene climate change and the sim-15
ulation results suggest that the snow and glacier environment over the Tibetan Plateau is an important factor for Holocene Africa-Asian monsoon retreating and an amplifier for monsoon regional climate variability. In their transient modeling experiments (Jin et al., 2005), the changes of snow and glaciers over the Tibetan Plateau was set to be simply linear increasing from 9 kyr BP to present. However, the assumption that 20
the snow and glaciers developing on the Tibetan Plateau were in a linear way is not possible the real case as it were due to the complexity of snow and glacier
develop-ment. Because the different scenarios of snow and glaciers developing on the Tibetan
Plateau may have different effects on climate change, here, as a follow-up research of
Jin et al. (2005), we conduct a series of sensitivity experiments by using CLIMBER-2 25
focusing on the impacts of different scenarios of snow and glaciers developing over the
CPD
4, 1265–1287, 2008Tibetan plateau glacial forcing and
Holocene climate
L. Jin et al.
Title Page
Abstract Introduction
Conclusions References
Tables Figures
◭ ◮
◭ ◮
Back Close
Full Screen / Esc
Printer-friendly Version
Interactive Discussion
2 Model and experimental set-up
2.1 The model
The Earth system model of intermediate complexity, CLIMBER-2, used in this study was developed in Potsdam Institute for Climate Impact Research (PIK) in Germany to perform the long-term simulations. The model consists of modules describing at-5
mosphere, ocean, sea ice, and terrestrial vegetation. The model of the atmosphere is based on the statistical-dynamical approach and explicitly resolves the large-scale circulation patterns such as subtropical jet streams, Hadley, Ferrel and polar cells, monsoon and centers of action of the Siberian high-pressure area and the Aleutian low-pressure area. It does not resolve individual synoptic weather systems but rather 10
predicts their statistical characteristics, including the fluxes of heat, moisture, and mo-mentum associated with ensembles of synoptic systems. The vertical structure in-cludes a planetary boundary layer, a free troposphere (including cumulus and strati-form clouds) and a stratosphere. Radiative fluxes are computed on 16 vetical levels. The ocean model is a multibasin, zonally averaged model similar to the one used by 15
Stocker et al. (1992), including a model of sea-ice thickness, concentration, and ad-vection. Vertically the ocean is subdivided into 20 uneven layers. Parameterizations for its vorticity balance and Ekman transport are employed. The model of terrestrial veg-etation (Brovkin et al., 2002) describe the dynamics of vegveg-etation cover, i.e., fractional coverage of a grid cell by trees, grass, and desert (bare soil), as well as net primary 20
productivity, leaf area index, biomass, and soil carbon pool. Hence, CLIMBER-2 is able to describe changes in vegetation cover that can be interpreted as shifts in vegetation zones smaller than the spatial resolution of the model. Atmosphere and ocean interact through the surface fluxes of heat, fresh water and momentum. The model does not employ flux adjustments. The CLIMBER-2 model has been validated against present-25
CPD
4, 1265–1287, 2008Tibetan plateau glacial forcing and
Holocene climate
L. Jin et al.
Title Page
Abstract Introduction
Conclusions References
Tables Figures
◭ ◮
◭ ◮
Back Close
Full Screen / Esc
Printer-friendly Version
Interactive Discussion
2.2 The experimental set-up
To mimic various scenarios of snow and glaciers developing over the Tibetan Plateau, five scenarios of snow and glacier area growth over the Tibetan Plateau were set up for the 9 kyr transient simulation, namely ICE0, ICE1, ICE2, ICE3 and ICE4, respectively (see Table 1 for detail).
5
In all experiments except ICE0, the fraction of snow and glaciers in the grid cell which
contain the Tibetan Plateau (30◦–40◦N, 40◦–90◦E) in the model is prescribed starting
with 0 at 9 kyr BP and ending with 0.2 at 0 kyr BP, with different scenarios of variations
of fraction of snow and glaciers over the Tibetan Plateau through 9 kyr BP to 0 kyr BP (See Fig. 1a and Table 1 for a detail).
10
Three simulations using CLIMBER-2 were conducted for each scenario for snow and glacier area over the Tibetan Plateau for the Holocene. Firstly, the fully coupled atmosphere-ocean-terrestrial vegetation model (AOV) was employed for the transient simulation for the past 9000 years. Secondly, the coupled atmosphere-ocean model (AO) with vegetation cover fixed with 9 kyr BP vegetation as in the equilibrium run at 15
9 kyr BP was performed. Finally, the simulation AV was run with interactive vegetation (coupled atmosphere-vegetation model), while ocean characteristics were fixed as in the equilibrium run at 9 kyr BP. The AO and AV simulations are intended to investigate
interactive effects of ocean and terrestrial vegetation cover, respectively. All transient
simulations start from an equilibrium with orbital forcing at 9 kyr BP for 9000 years until 20
present day. The global and seasonal change of the orbital insolation is computed with the algorithm after Berger (1978). No flux corrections between the atmospheric and oceanic modules are applied in the model in any simulation. The atmospheric
CO2 concentration is kept constant at 280 ppmv, and the solar constant is fixed at
1365 W m−2.
CPD
4, 1265–1287, 2008Tibetan plateau glacial forcing and
Holocene climate
L. Jin et al.
Title Page
Abstract Introduction
Conclusions References
Tables Figures
◭ ◮
◭ ◮
Back Close
Full Screen / Esc
Printer-friendly Version
Interactive Discussion
3 Results
3.1 Temperature, precipitation and vegetation changes in the last 9 kyr
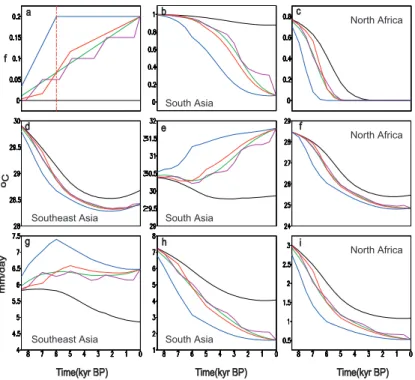
The transient simulations revealed pronounced responses of CLIMBER-2 to changes in orbital parameters as well as the impacts of snow and glacier cover over the Tibetan Plateau on climate. Figure 1e illustrates that changes in boreal summer temperature 5
in South Asia are quite different from that in Southeast Asia (Fig. 1d) and North Africa
(Fig. 1f). Since 6 kyr BP, the summer temperature in South Asia began to increase with the fraction of snow and glacier cover increased over the Tibetan Plateau in all imposed ice scenarios (except for ICE0). The quicker increase of snow and glacier cover over the Tibetan Plateau would cause a faster increase in summer temperature 10
in South Asia, as can be seen when compared scenario ICE4 with ICE1, ICE2, and ICE3 in Fig. 1e. In Southeast Asia and North Africa, the faster increased snow and glacier cover over the Tibetan Plateau leads to an earlier decrease in summer temper-ature during 8 kyr BP–5 kyr BP, but after 5 kyr BP, even though the snow and glaciers are still growing in all ice scenarios, the summer temperature have a small change 15
(Fig. 1d, f). The summer precipitation in Southeast Asia (Fig. 1g) increases rapidly dur-ing the early to mid-Holocene (9 kyr BP to 6 kyr BP) with the gradually increased snow and glacier cover over the Tibetan Plateau, in which the faster the snow and glacier grows (scenario ICE4), the more summer precipitation increases. Since 6 kyr BP, even though the snow and glacier are still growing (scenarios ICE1, ICE2, and ICE3), the 20
summer precipitation in Southeast Asia no more increases or even began to decrease with the fraction of snow and glacier cover over the Tibetan Plateau was kept constant (corresponding to scenario ICE4). In North Africa, the strongest decrease in sum-mer precipitation appears around 5.5–6.5 kyr BP in scenario ICE0 (no-ice) simulation (grey line in Fig. 1i), while in scenarios ICE1 (green), ICE2 (purple), ICE3 (red), and 25
CPD
4, 1265–1287, 2008Tibetan plateau glacial forcing and
Holocene climate
L. Jin et al.
Title Page
Abstract Introduction
Conclusions References
Tables Figures
◭ ◮
◭ ◮
Back Close
Full Screen / Esc
Printer-friendly Version
Interactive Discussion
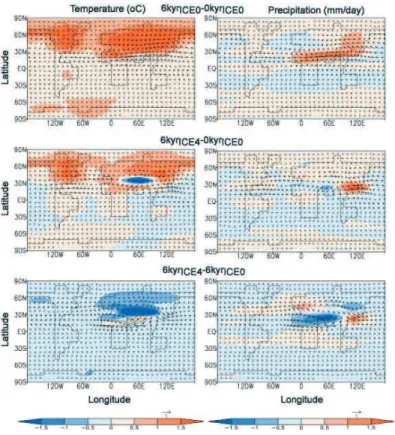
similar to that in North Africa. Compared to scenario ICE0 (no-ice), the ice scenarios (ICE0, ICE1, ICE2, ICE3, and ICE4) show a pronounced increase in summer precip-itation in Southeast Asia (Fig. 1g), and a decrease in South Asia (Fig. 1h) and Africa (Fig. 1i). The tendency for the pattern of rapidly increased precipitation in Southeast Asia and decreased in South Asia and North Africa during the early to mid-Holocene 5
may reflect the tendency for the large-scale weakened African-Asian summer mon-soon circulation to shift the locus of monmon-soon rains southeastward (Fig. 2), as a result of the thermal-driving monsoon circulation to be adjusted to the changes in thermal contrast between the African and Eurasian continent and Indian Ocean during the bo-real summer, and showing the gradually weakened seasonal cycle of solar insolation 10
in the northern hemisphere began to take into effect, as is also evidenced from the
paleoclimate records (Morrill et al., 2003; Tang et al., 2000).
Compared to the changes in near-surface air temperature and precipitation, the
frac-tion f of vegetation cover changed differently. Figure 1b, c shows responses of the
changes in the fractionf of vegetation cover to the different scenarios of gradually
in-15
creased snow and glaciers over the Tibetan Plateau in South Asia and North Africa. In North Africa (Fig. 1c), the vegetation cover decreases earlier and more rapidly than that in South Asia (Fig. 1b) in all imposed ice scenarios. Complete desertification in North Africa appears around 3.5 kyr BP with no-ice imposed over the Tibetan Plateau (sce-nario ICE0), and by 5.0 kyr BP (sce(sce-narios ICE1, ICE2, ICE3), and 6 kyr BP (sce(sce-nario 20
ICE4), respectively (Fig. 1c), showing a strong feedback effect of snow and glacier
cover over the Tibetan Plateau on North African vegetation development. In South Asia, the response of the changes in vegetation cover to the gradually increased snow and glaciers over the Tibetan Plateau lags behind North Africa a few thousand years
(the fraction of vegetation cover in South Asia reduces only 10% (∆f∼−0.1) for the first
25
5 kyr for scenarios of ICE1, ICE2, and ICE3) (Fig. 1b), while the fraction of vegetation cover in North Africa reached almost zero at 5 kyr BP (Fig. 1c). The snow and glacier influence on changes of vegetation cover in South Asia began after 5 kyr BP, with a
scenar-CPD
4, 1265–1287, 2008Tibetan plateau glacial forcing and
Holocene climate
L. Jin et al.
Title Page
Abstract Introduction
Conclusions References
Tables Figures
◭ ◮
◭ ◮
Back Close
Full Screen / Esc
Printer-friendly Version
Interactive Discussion
ios of ICE1, ICE2, and ICE3. In scenario ICE4, even the snow and glacier cover would not increase any more after 6 kyr BP (Fig. 1a, blue line), its influence last for the rest of the Holocene vegetation evolution compared with scenario ICE0 (Fig. 1b). The sim-ulated fraction of vegetation cover in North Africa are generally coincident with proxy records of changes in vegetation cover evidenced from ocean temperature and terrige-5
nous dust in marine sediment cores offwestern Africa (deMenocal et al., 2000). The
percentage of terrigenous dust contents indicates a dramatic increase in the amount of dust that relates directly to the changes in vegetation as the Sahara expanded across North Africa during 5.7 kyr BP to 5.0 kyr BP (deMenocal et al., 2000).
3.2 Analysis on imposed ice-albedo effect on Holocene climate change in North
10
Africa and South Asia
In order to investigate the synergy of ice-albedo effect with solar insolation and
veg-etation effects, we performed three other transient simulations AO, AV, AOV with and
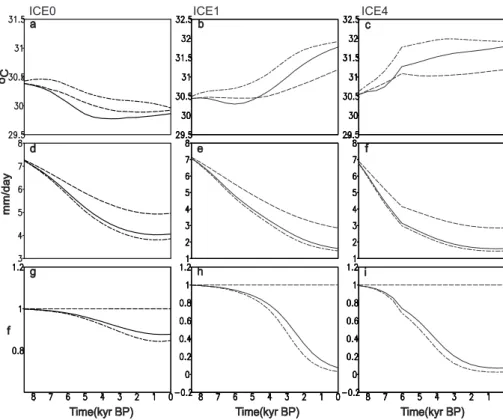
without imposed snow and glacier cover over the Tibetan Plateau. Figure 3 shows simulated results in North Africa for the last 9000 years from simulations AO, AV, AOV 15
with no-ice scenario ICE0, and with ice scenarios ICE1 and ICE4. About 1 kyr ear-lier rapidly decrease in near-surface air temperature during the mid-Holocene in ICE4 scenario than in scenario ICE1, and 2 kyr earlier than in scenario ICE0 can be seen in simulations AV and AOV (Fig. 3a, b, c). Similar results are in changes in summer precipitation (Fig. 3d, e, f) and vegetation cover in North Africa (Fig. 3g, h, i). Results 20
of experiments AV and AOV for North Africa show a similar response of CLIMBER-2 to changes in orbital parameters and ice-imposed forcing over the Tibetan Plateau while results of experiment AO show a less variation in all ice-imposed scenarios. It
indi-cates that the effect of snow and glaciers over the Tibetan Plateau could play a role
through the vegetation feedbacks, i.e. the ice and snow amplifies the vegetation feed-25
CPD
4, 1265–1287, 2008Tibetan plateau glacial forcing and
Holocene climate
L. Jin et al.
Title Page
Abstract Introduction
Conclusions References
Tables Figures
◭ ◮
◭ ◮
Back Close
Full Screen / Esc
Printer-friendly Version
Interactive Discussion
In South Asia, the imposed effect of snow and glacier forcing over the Tibetan
Plateau shows a different impact on summer near-surface air temperature (Fig. 4b,
c) and vegetation cover (Fig. 4h, i) compared to that in North Africa (Fig. 3). With a linear increase in snow and glacier cover over the Tibetan Plateau in scenario ICE1, the near surface summer air temperature in South Asia began to increase after around 5
6 kyr BP in simulations AO, AV, AOV (Fig. 4b), while in North Africa, it still decreases after 6 kyr BP. In scenario ICE4 (Fig. 4c), the near surface summer air temperature in South Asia began to increase almost along with the increase of snow and glacier cover over the Tibetan Plateau at the early Holocene (Fig. 4c). The rapidly increased near surface summer air temperature in South Asia is closely related to the rapid decreases 10
in summer precipitation (Fig. 4e, f) and vegetation cover (Fig. 4h, i) in this region. Figure 4e, f shows that the summer precipitation in South Asia is more sensitive to
the effect of snow and glacier cover over the Tibetan Plateau (scenarios ICE1, ICE4)
compared to that in no ice scenario (ICE0) (Fig. 4d) in AO, AV, and AOV simulations. Similarly, it is shown that the faster increase in snow and glacier cover over the Tibetan 15
Plateau (scenarios ICE1, ICE4) would cause an earlier (about 1000–2000 years) and rapidly decrease in vegetation cover in South Asia (Fig. 4h, i) compared to that in no-ice scenario (ICE0) (Fig. 4g). The rapid decrease in summer precipitation and in vegeta-tion cover in South Asia is probably responsible for the rapid increase in near surface summer air temperature after 5 kyr BP.
20
Figure 5a, b shows the simulated differences in sea surface temperatures (SSTs)
be-tween 9 kyr BP and 0 kyr BP in simulation AOV without imposed snow and glacier over the Tibetan Plateau (scenario ICE0), indicating a negative SST anomaly in North Indian
Ocean (40◦E–95◦E, 0◦N–20◦N) in the early Holocene. Figure 5c shows the simulated
SST evolution for the last 9 kyr in North Indian Ocean (40◦E–95◦E, 0◦N–20◦N), with a
25
CPD
4, 1265–1287, 2008Tibetan plateau glacial forcing and
Holocene climate
L. Jin et al.
Title Page
Abstract Introduction
Conclusions References
Tables Figures
◭ ◮
◭ ◮
Back Close
Full Screen / Esc
Printer-friendly Version
Interactive Discussion
Asia (Fig. 4a) does not follow the SST evolution in North Indian Ocean (Fig. 5c), indicat-ing that the near surface summer air temperature increase in South Asia after 5 kyr BP can not be attributed to the increase in SST in North Indian Ocean. This is because an increased latent heat flux would release over sea surface and transport to air over continent in South Asia from North Indian Ocean due to increased SST, and hence 5
increases the summer temperature in South Asia, but the increase of evaporation over the ocean and a stronger moisture transport from ocean also increase the cloudiness that may compensate release of latent heat. It is suggested from our modeling ex-periment that the rapid decrease in precipitation and vegetation cover after 5 kyr BP (Fig. 4e, h) could reduce the albedo of underlying surface in this region, which in return 10
increases the absorbtion of solar radiation and hence increases the temperature.
4 Summary and concluding remarks
Using the climate system model of intermediate complexity, CLIMBER-2, the Holocene climate changes were simulated forced by various scenarios of snow and glaciers de-veloping over the Tibetan Plateau. The simulations show an additional decrease in 15
boreal summer temperature in mid-Holocene (6 kyr BP) when snow and ice glaciers are imposed over the Tibetan Plateau, especially in the northern parts of Europe, Asia, and North America. An increase in snow and glaciers over the Tibetan Plateau for the last 9000 years would lead to an earlier and more rapidly climate change in African-Asian monsoon region as well as the changes in summer temperature in South Asia 20
and summer precipitation in Southeast Asia. The faster the snow and glaciers in-crease, the earlier the rapid decrease in boreal summer temperature and precipitation as well as vegetation cover in North Africa. However, the faster increase in snow and glaciers over the Tibetan Plateau would cause an increase in near surface summer air temperature in South Asia. The rapid decrease in vegetation in South Asia was lagged 25
CPD
4, 1265–1287, 2008Tibetan plateau glacial forcing and
Holocene climate
L. Jin et al.
Title Page
Abstract Introduction
Conclusions References
Tables Figures
◭ ◮
◭ ◮
Back Close
Full Screen / Esc
Printer-friendly Version
Interactive Discussion
plays only a minor role.
The surface albedo and latent heat flux must be important in boreal summer temper-ature change in South Asia, where is adjacent to the northern Indian Ocean, and may release more latent heat in boreal summer. The vegetation and ocean feedbacks and the synergy between them are important for climate variability in South Asia.
5
The simulation results show that the vegetation feedback can be amplified by ice-albedo feedback which reflects an additional synergy in the climate system through ice glacier, therefore a more detailed feedback analysis with additional runs is warranted. It must be emphasized that the horizontal resolution in the model is too coarse to capture
accurately effects of land surface changes on climate, more sensitivity experiments with
10
mesh refinement or nesting with regional model are necessary.
Acknowledgements. This study was supported by the National Natural Science Foundation of
China (NSFC) (Grant No. 40571169), the NSFC Innovation Team Project (Grant No. 40421101) and the 111 Project (Grant No. B06026). Bette Otto-Bliesner of National Center for Atmo-spheric Research (NCAR) is thanked for her helpful reviewing and English improvement of the
15
manuscript.
References
An, Z. S., Porter, S. C., Kutzbach, J. E., Wu, X., Wang, S., Liu, X. D., Li, X. Q., and Zhou, W. J.: Asynchronous Holocene optimum of the East Asian monsoon, Quaternary Sci. Rev., 19, 743–762, 2000.
20
Berger, A. L.: Long-term variations of daily insolation and quaternary climatic changes, J. Atmos. Sci., 35, 2362–2367, 1978.
Brovkin, V., Bendtsen, J., Claussen, M., Ganopolski, A., Kubatzki, C., Petoukhov, V., and An-dreev, A.: Carbon cycle, vegetation, and climate dynamics in the Holocene, Experiments with the CLIMBER-2 model, Global Biogeochem. Cy., 16(4), 1139, doi:10.1029/2001GB001662,
25
CPD
4, 1265–1287, 2008Tibetan plateau glacial forcing and
Holocene climate
L. Jin et al.
Title Page
Abstract Introduction
Conclusions References
Tables Figures
◭ ◮
◭ ◮
Back Close
Full Screen / Esc
Printer-friendly Version
Interactive Discussion Casal, T. G. D., Kutzbach, J. E., and Thompson, L. G.: Present and past ice-sheet mass
balance simulations for Greenland and the Tibetan Plateau, Clim. Dynam., 23, 407–425, 2004.
Chauhan, O. S.: Past 20,000-year history of Himalayan aridity: Evidence from oxygen isotope records in the Bay of Bengal, Curr. Sci. India, 84(1), 90–93, 2003.
5
Claussen, M., Kubatzki, C., Brovkin, V., Ganopolski, A., Hoelzmann, P., and Pachur, H.: Simu-lation of an abrupt change in Saharan vegetation in the mid-Holocene, Geophys. Res. Lett., 24(14), 2037–2040, 1999.
COHMAP Members: Climatic changes of the 18,000 years: Observations and model simula-tion, Science, 241, 1043–1052, 1988.
10
Christner, B. C., Mosley-Thompson, E., Thompson, L. G., and Reeve, J. N.: Bacterial recovery from ancient glacier ice, Environ. Microbiol., 5, 433–436, 2003.
Claussen, M. and Gayler, V.: The greening of Sahara during the mid-Holocene: Results of an interactive atmospheric-biome model, Global Ecol. Biogeogr., 6, 369–377, 1997.
deMenocal P., Ortiz, J., Guilderson, T., and Sarnthein, M.: Coherent high- and low-latitude
15
climate variability during the Holocene warm period, Science, 288, 2198–2202, 2000. Foley, J. A., Kutzbach, J. E., Coe, M. T., and Levis, S.: Feedbacks between climate and boreal
forests during the Holocene epoch, Nature, 371, 52–54, 1994.
Ganopolski, A., Rahmstorf, S., Petoukhov, V., and Claussen, M.: Simulation of modern and glacial climates with a coupled model of intermediate complexity, Nature, 391, 351–356,
20
1998a.
Ganopolski, A., Kubatzki, C., Claussen, M., Brovkin, V., and Petoukhov, V.: The influence of vegetation-atmosphere-ocean interaction on climate during the mid-Holocene, Science, 280, 1916–1919, 1998b.
Gupta, A. K. and Anderson, D. M.: Mysteries of the Indian Ocean monsoon system, J. Geol.
25
Soc. India, 65, 54–60, 2005.
Gupta, A. K., Anderson, D. M., and Overpeck, J. T.: Abrupt changes in the Asian southwest monsoon during the Holocene and their links to the North Atlantic Ocean, Nature, 421, 354– 357, 2003.
Huang, C. C.: Environmental changes, Beijing: Science Press, 121–145, 1998 (in Chinese).
30
CPD
4, 1265–1287, 2008Tibetan plateau glacial forcing and
Holocene climate
L. Jin et al.
Title Page
Abstract Introduction
Conclusions References
Tables Figures
◭ ◮
◭ ◮
Back Close
Full Screen / Esc
Printer-friendly Version
Interactive Discussion doi:10.1029/2005GL023202, 2005.
Jin, L., Chen, F., Ganopolski, A., and Claussen, M.: Response of East Asian climate to Dans-gaard/Oeschger and Heinrich events in a coupled model of intermediate complexity, J. Geo-phys. Res., 112, D06117, doi:10.1029/2006JD007316, 2007.
Kutzbach, J. E. and Guetter, P. J.: The influence of changing orbital parameters and surface
5
boundary conditions on climate simulation for the past 18,000 years, J. Atmos. Sci., 43, 1726–1759, 1986.
Lehmkuhl, F.: Late Pleistocene, late-glacial and Holocene glacier advances on the Tibetan Plateau, Quatern. Int., 38–39, 77–83, 1997.
Lehmkuhl, F. and Oven, L. A.: Late Quaternary glaciation of Tibetan and the bordering
moun-10
tains: a review, Boreas, 34, 87–100, 2005.
Maxwell, A. L.: Holocene changes inferred from lake sediments pollen and carbonate records, northeastern Cambodia, Quatern. Res., 56, 390–400, 2001.
Mayewski, P. A., Rohling, E. E., Starge, J. C., Karlen, W., Maasch, K. A., Meeker, L., Meyerson, E. A., Gasse, F. G., Kreveld, S. V., Holmgren, K., Thorp, J. L., Rosqvist, G., Rack, F.,
Staub-15
wasser, M., Schneider, R. R., and Steig, E. J.: Holocene climate variability, Quatern. Res., 62, 243–255, 2004.
Molnar, P. and England, P.: Late Cenozoic uplift of mountain ranges and global climatic change: Chicken or egg?, Nature, 246, 29–34, 1990.
Morrill, C., Overpeck, J. T., and Cole, J. E.: A synthesis of abrupt changes in the Asian summer
20
monsoon since the last deglaciation, Holocene, 13, 465–476, 2003.
Petoukhov, V., Ganopolski, A., Brovkin, V., Claussen, M., Eliseev, A., Kubatzki, C., and Rahm-storf, S.: CLIMBER-2: A climate system model of intermediate complexity. Part I: Model description and performance for present climate, Clim. Dynam., 16, 1–17, 2000.
Petoukhov, V., Ganopolski, A., Brovkin, V., Claussen, M., Eliseev, A., Kubatzki, C., and
Rahm-25
storf, S.: CLIMBER-2: A climate system model of intermediate complexity. Part II: Model sensitivity, Clim. Dynam., 17, 735–751, 2001.
Phillips, W. M., Sloan, V. F., Sharma, P., Clarke, M. L., and Rendell, H. M.: Asynchronous glaciation at Nanga Parbat, northwestern Himalaya Mountains, Pakistan, Geology, 28, 431– 433, 2000.
30
Prell, W. and Kutzbach, J.: Sensitivity of the Indian monsoon to forcing parameters and impli-cations for its evolution, Nature, 360, 647–652, 1992.
Bei-CPD
4, 1265–1287, 2008Tibetan plateau glacial forcing and
Holocene climate
L. Jin et al.
Title Page
Abstract Introduction
Conclusions References
Tables Figures
◭ ◮
◭ ◮
Back Close
Full Screen / Esc
Printer-friendly Version
Interactive Discussion jing: Science Press, 5–6, 2002.
Ruddiman, W. F. and Kuzbach, J. E.: Forcing of late Cenozoic Northern Hemisphere climate by plateau uplift in southern Asia and the American west, J. Geophys. Res., 94, D15, 18409– 18427, 1989.
Singh, I. B.: Late Quaternary evolution of Ganga Plain and proxy records of climate change,
5
neotectonics and anthropogenic activity, Pragdhara, 12, 1–25, 2002.
Stocker, T. F., Wright, D. G., and Mysak, L. A.: A zonally averaged, coupled ocean-atmosphere model for the paleoclimate studies, J. Climate, 5, 773–797, 1992.
TEMPO Members: Potential role of vegetation feedback in the climate sensitivity of high-latitude regions: A case study at 6000 years B.P., Global Biogeochem., Cy., 10, 727–736, 1996.
10
Texier, D., de Noblet, N., Harrison, S. P., Haxeltine, A., Jolly, D., Joussaume, S., Laarif, F., Pren-tice, I. C., and Tarasov, P.: Quantifying the role of biosphere-atmosphere feedbacks in climate change: coupled model simulations for 6000 years BP and comparison with palaeodata for northern Eurasia and northern Africa, Clim. Dynam., 13, 865–882, 1997.
Thompson, L. G., Yao, T., Davis, M. E., Henderson, K. A., Mosley-Thompson, E., Lin, P. N.,
15
Beer, J., Synal, H. A., Cole-Dai, J., and Bolzan, J. F.: Tropical climate instability: The last glacial cycle from a Qinghai-Tibetan ice core, Science, 276, 1821–1825, 1997.
Thompson, L. G., Yao, T., Mosley-Thompson, E., Davis, M. E., Henderson, K. A., and Lin, P. N.: A high-resolution millennial record of the south Asian monsoon from Himalayan ice cores, Science, 289, 1916–1919, 2000.
20
Thompson, L. G., Mosley-Thompson, E., Davis, M. E., Mashiotta, T. A., Henderson, K. A., Lin, P. N., and Yao, T.: Ice core evidence for asynchronous glaciation on the Tibetan Plateau, Quatern. Int., 154–155, 3–10, 2006.
Tang, L., Shen, C., Liu, K. B., and Overpeck, J. T.: Changes in south Asian monsoon: new high-resolution paleoclimatic records from Tibet, Chin. Sci. Bull., 45, 87–91, 2000.
25
Wang, H. J.: Role of vegetation and soil in the Holocene megathermal climate over China, J. Geophys. Res., 104, 9361–9367, 1999.
Weber, S. L. and Oerlemans, J.: Holocene glacier variability: three case studies using an intermediate-complexity climate model, The Holocene, 13(3), 353–363, 2003.
Weber, S. L., Crowley, T. J., and van der Schrier, G.: Solar irradiance forcing of centennial
30
climate variability during the Holocene, Clim. Dynam., 22, 539–553, 2004.
CPD
4, 1265–1287, 2008Tibetan plateau glacial forcing and
Holocene climate
L. Jin et al.
Title Page
Abstract Introduction
Conclusions References
Tables Figures
◭ ◮
◭ ◮
Back Close
Full Screen / Esc
Printer-friendly Version
Interactive Discussion Yang, B., Brauning, A., Dong, Z., Zhang, Z., and Jiao, K.: Late Holocene monsoonal
tem-perature glacier fluctuations on the Tibetan Plateau, Global Planet. Change, 60, 126–140, doi:10.1016/j.gloplacha.2006.07.035, 2008.
Yao, T. D., Liu, X. D., and Wang, N. L.: On amplitudes of climatic variation in Qinghai-Tibetan Plateau, Chinese Sci. Bull., 45, 98–106, 2000 (in Chinese).
CPD
4, 1265–1287, 2008Tibetan plateau glacial forcing and
Holocene climate
L. Jin et al.
Title Page
Abstract Introduction
Conclusions References
Tables Figures
◭ ◮
◭ ◮
Back Close
Full Screen / Esc
Printer-friendly Version
Interactive Discussion
Table 1.Imposed snow and glacier scenarios in modeling experiments.
Scenarios Variations of fractionf of ice cover over the Tibetan Plateau
ICE0 f is fixed at zero for all simulations AO, AV, AOV (grey line in Fig. 1a)
ICE1 linearly increasing for the 9 kyr-transient simulation, starting with 0 at 9 kyr BP and ending with 0.2 at 0 kyr BP (green line in Fig. 1a)
ICE2 linearly increasing by 0.05 (1/4 of the maximum of fractional ice cover at 0 kyr BP as in ICE1) during four periods including 7.2– 8.2 kyr BP, 4.9–5.8 kyr BP, 2.4–3.32 kyr BP and 3.0–4.5 kyr BP, and fixed with the values the previous period reached maximum during other periods, which are mainly based on result in work of Lehmkuhl (1997) (purple line in Fig. 1a)
ICE3 linearly and slightly increasing in the early Holocene (9–7 kyr BP), starting with 0 at 9 kyr BP and reaching to 0.017 at 7 kyr BP, then prescribed linearly and rapidly increasing in the mid-Holocene (7–5 kyr BP), reaching to 0.117 at 5 kyr BP, finally prescribed linearly and slightly increasing between 5 and 0 kyr BP, end-ing with 0.2 at 0 kyr BP, which mimic the Nigardsbreen Glacier (62◦N,7◦E) expansion during the Holocene (reference results
from a process-based glacier model coupled to the intermediate-complexity climate model (ECBilt), Weber et al., 2003) (red line in Fig. 1a)
ICE4 linearly increasing between 9 and 6 kyr BP, starting with 0 at 9 kyr BP and reaching to the maximum 0.2 at 6 kyr BP, then fixed at 0.2 between 6 and 0 kyr BP, which mimic Abramov glacier (40◦N, 72◦E) variation during the Holocene resulted from ECBilt
CPD
4, 1265–1287, 2008Tibetan plateau glacial forcing and
Holocene climate
L. Jin et al.
Title Page
Abstract Introduction
Conclusions References
Tables Figures
◭ ◮
◭ ◮
Back Close
Full Screen / Esc
Printer-friendly Version
Interactive Discussion
oC f
mm/day
m
m
/d
a
y
a b c
d e f
g h i
Time(kyr BP) Time(kyr BP) Time(kyr BP) Time(kyr BP) Time(kyr BP) Time(kyr BP)
North Africa North Africa North Africa
South Asia South Asia South Asia
Southeast Asia Southeast Asia
Fig. 1.Transient simulation using CLIMBER-2 for the last 9 kyr.(a)Prescribed various scenar-ios of snow and glaciers developing over the Tibetan Plateau in transient simulation (f: fraction of snow and glaciers);(b) Simulated changes of fractionf of vegetation cover in South Asia (40◦E–95◦E, 20◦N–30◦N) in simulation AOV with di
fferent imposed ice scenarios in (a); (c) Same as (b) but for North Africa (15◦W–40◦E, 20◦N–30◦N);(d)Same as (b) but for summer
(June, July, August, JJA) near-surface air temperature in Southeast Asia (95◦E–145◦E, 20◦N–
30◦N);(e)Same as (d) but for South Asia (40◦E–95◦E, 20◦N–30◦N);(f)Same as (e) but for
CPD
4, 1265–1287, 2008Tibetan plateau glacial forcing and
Holocene climate
L. Jin et al.
Title Page
Abstract Introduction
Conclusions References
Tables Figures
◭ ◮
◭ ◮
Back Close
Full Screen / Esc
Printer-friendly Version
Interactive Discussion
Fig. 2. Boreal summer near-surface air temperature (◦) (left panel) and precipitation (mm/day)
CPD
4, 1265–1287, 2008Tibetan plateau glacial forcing and
Holocene climate
L. Jin et al.
Title Page
Abstract Introduction
Conclusions References
Tables Figures
◭ ◮
◭ ◮
Back Close
Full Screen / Esc
Printer-friendly Version
Interactive Discussion
Time(kyr BP) Time(kyr BP) Time(kyr BP)
Time(kyr BP) Time(kyr BP) Time(kyr BP)
oC
mm/daym
m
/d
a
y
f
a b c
d e f
g h i
ICE0 ICE1 ICE4
Fig. 3. (a)Summer (June, July, August, JJA) near-surface air temperature (a,b,c), precipitation (d, e, f), and vegetation cover(g, h, i)changes in North Africa (15◦W–40◦E, 20◦N–30◦N) for
CPD
4, 1265–1287, 2008Tibetan plateau glacial forcing and
Holocene climate
L. Jin et al.
Title Page
Abstract Introduction
Conclusions References
Tables Figures
◭ ◮
◭ ◮
Back Close
Full Screen / Esc
Printer-friendly Version
Interactive Discussion
oC
mm/daym
m
/d
a
y
f
Time(kyr BP)
Time(kyr BP) Time(kyr BP) Time(kyr BP) Time(kyr BP) Time(kyr BP)
a b c
d e f
g h i
ICE0 ICE1 ICE4
CPD
4, 1265–1287, 2008Tibetan plateau glacial forcing and
Holocene climate
L. Jin et al.
Title Page
Abstract Introduction
Conclusions References
Tables Figures
◭ ◮
◭ ◮
Back Close
Full Screen / Esc
Printer-friendly Version
Interactive Discussion a
b
c
oC
Latitude
L
a
ti
tu
d
e
Latitude
L
a
ti
tu
d
e
Longitude
Longitude
Longitude
Longitude
Time(kyr BP)
Time(kyr BP)
Fig. 5.Differences in sea surface temperatures (SSTs) between 9 kyr BP and 0 kyr BP in simu-lation AOV without imposed ice cover over the Tibetan Plateau (scenario ICE0) in boreal sum-mer(a)and winter(b); (c)boreal summer SST changes in North Indian Ocean (40◦E–95◦E,