of Coral Reef Fishes at Elevated Temperatures
Naomi M. Gardiner1,2*, Philip L. Munday1,2, Go¨ran E. Nilsson3
1School of Marine and Tropical Biology, James Cook University, Townsville, Australia,2Australian Research Council Centre of Excellence for Coral Reef Studies, James Cook University, Townsville, Australia,3Physiology Programme, Department of Molecular Biosciences, University of Oslo, Oslo, Norway
Abstract
The response of species to global warming depends on how different populations are affected by increasing temperature throughout the species’ geographic range. Local adaptation to thermal gradients could cause populations in different parts of the range to respond differently. In aquatic systems, keeping pace with increased oxygen demand is the key parameter affecting species’ response to higher temperatures. Therefore, respiratory performance is expected to vary between populations at different latitudes because they experience different thermal environments. We tested for geographical variation in respiratory performance of tropical marine fishes by comparing thermal effects on resting and maximum rates of oxygen uptake for six species of coral reef fish at two locations on the Great Barrier Reef (GBR), Australia. The two locations, Heron Island and Lizard Island, are separated by approximately 1200 km along a latitudinal gradient. We found strong counter-gradient variation in aerobic scope between locations in four species from two families (Pomacentridae and Apogonidae). High-latitude populations (Heron Island, southern GBR) performed significantly better than low-latitude populations (Lizard Island, northern GBR) at temperatures up to 5uC above average summer surface-water temperature. The other two species showed no difference in aerobic scope between locations. Latitudinal variation in aerobic scope was primarily driven by up to 80% higher maximum rates of oxygen uptake in the higher latitude populations. Our findings suggest that compensatory mechanisms in high-latitude populations enhance their performance at extreme temperatures, and consequently, that high-latitude populations of reef fishes will be less impacted by ocean warming than will low-latitude populations.
Citation:Gardiner NM, Munday PL, Nilsson GE (2010) Counter-Gradient Variation in Respiratory Performance of Coral Reef Fishes at Elevated Temperatures. PLoS ONE 5(10): e13299. doi:10.1371/journal.pone.0013299
Editor:Tamara Natasha Romanuk, Dalhousie University, Canada
ReceivedApril 8, 2010;AcceptedAugust 12, 2010;PublishedOctober 11, 2010
Copyright:ß2010 Gardiner et al. This is an open-access article distributed under the terms of the Creative Commons Attribution License, which permits unrestricted use, distribution, and reproduction in any medium, provided the original author and source are credited.
Funding:This work was financed by the ARC Centre of Excellence for Coral Reef Studies, James Cook University, and the University of Oslo. PLM is supported by an Australian Research Council Fellowship. The funders had no role in study design, data collection and analysis, decision to publish, or preparation of the manuscript.
Competing Interests:The authors have declared that no competing interests exist. * E-mail: [email protected]
Introduction
Elevated levels of atmospheric carbon dioxide are set to increase mean global temperatures by 2–4uC in the next century [1]. Ocean temperatures have already increased by 0.1uC in recent decades [2] and sea surface temperatures are predicted to increase up to 3uC within the next century [1,3,4]. The effect of higher temperatures on species’ distribution and abundance includes range shifts, population collapses, local extinctions, and phase shifts [5–11]. These patterns emerge from the combined responses of populations to increasing temperature throughout the species’ geographic range. Local adaptation to thermal gradients can cause populations in different parts of the geographic range to exhibit different responses to temperature variation [12–18]. Consequent-ly, comparing the effects of temperature increases in different populations is essential for generating robust predictions about the impact of global warming on animal communities at large spatial scales.
Comparing phenotypic variation in a species’ performance traits across a thermal gradient could produce several patterns [19–22]. (1) Thermal optima could be locally adapted to match the thermal environment, such that populations from warmer locations outperform populations from cooler locations at higher
In aquatic systems, comparisons of geographic variation amongst conspecific populations has predominantly focused on polar and temperate climates, and counter-gradient patterns have often been detected [22,23]. Counter-gradient variation can arise when there is a trade-off between traits or processes in order to compensate for detrimental effects of the environmental gradient on performance, such as that induced by temperatures above a population’s thermal optima [21,22]. For example, physiological processes may be locally adapted to maintain growth and developmental rates against a thermal gradient that has a negative effect on these traits [20,21]. Whether similar compensatory mechanisms occur in tropical marine species is largely unknown. While some tropical species appear to live close to their upper thermal limits [23,24], the capacity to acclimate may increase species flexibility to succeed in warmer temperatures [20]. With tropical ocean temperatures predicted to increase up to 3uC over the next 100 years [3,4], investigating the response of tropical marine taxa to higher temperatures has become increasingly important.
In water breathing animals, such as fish, a key mechanism affecting performance with increasing temperatures is aerobic capacity. The capacity of the circulatory and ventilatory systems to keep pace with higher oxygen demand at higher temperatures is thought to determine a species’ viability in a warmer environment [9,25]. Populations that can maintain their aerobic capacity at warmer temperatures have a higher thermal tolerance, and are thereby predicted to persist longer, than populations that
experience a decline in aerobic performance as temperature increases. Recently Nilsson and colleagues [26] demonstrated strong inter-familial differences in thermal tolerance amongst coral reef fish species. A temperature rise of just 2uC above current summer averages caused a loss of aerobic capacity in two cardinalfish species but only slight declines in aerobic performance of three damselfish species. Their results predict rising sea temperatures will alter reef fish community structure by causing more substantial declines in cardinalfish populations than in the damselfish populations. Deleterious effects of rising temperature on aerobic performance has already led to population collapses and ecosystem shifts in polar and temperate regions [9], and similar effects might be expected to occur in tropical marine systems.
This study compares thermal performance curves of tropical fishes in two locations on the Great Barrier Reef, Australia, which are separated from each other by over 1200 km and that experience markedly different thermal regimes. Resting oxygen consumption (MO2Rest), maximal oxygen consumption (MO2Max)
and aerobic scope (MO2Max - MO2Rest) were measured for six
common coral reef fishes at temperatures up to 5uC above the summer average at Heron Island on the southern Great Barrier Reef and at Lizard Island on the northern Great Barrier Reef. These locations have average summer temperatures of 27.5uC and 28.9uC, respectively, and average annual thermal ranges of 6.3uC and 4.8uC respectively. Specifically, we tested if thermal effects on respiratory performance of the six species varied between the two
Figure 1. Theoretical patterns of thermal performance.A comparison of thermal performance in populations from warmer versus colder environments could exhibit (A) Local adaptation as predicted by optimality models in which thermal tolerance and optima has diverged amongst populations according to their local thermal experience. (B) Co-gradient variation whereby genetic and environmental influences are positively associated across a thermal gradient. (C) Counter-gradient variation whereby genetic and environmental influences are negatively associated across a thermal gradient or (D) No divergence in thermal performance amongst warm and cold locations. Figure modified from Fig 3.19 in Angiletta (2009) [20].
locations in a manner consistent with local adaptation to differences in average summer temperatures. Under this scenario, populations from the warmer, lower latitude would outperform populations from the cooler, higher latitude when exposed to warm temperatures. However, given evidence for gene flow among populations of fishes on the Great Barrier Reef [27,28], local adaptation might be restricted and similar patterns of respiratory performance at the two locations may be expected. Alternatively, compensatory mechanisms might produce counter-gradient patterns of thermal performance. In this case populations from the cooler, high-latitude location would outperform popu-lations from the warmer low-latitude location when exposed to warmer temperatures.
Methods
Ethics Statement
This research was undertaken with approval of the James Cook University animal ethics committee (permit: A1270) and according to the University’s animal ethics guidelines.
Study sites and species
Thermal effects on respiratory performance were estimated for populations of six common coral reef fishes at Lizard Island (14u409S 145u289E) and Heron Island reef (23u279S, 151u579E) on the Great Barrier Reef, Australia. Experiments were conducted during the months in which maximal summer sea surface temperatures are typically reached for each location. Northern populations were sampled between December and January in 2008 and 2009. These Lizard Island data are from Nilsson and colleagues [26] supplemented with new measurements for Pomacentrus moluccensis. Southern population experiments were sampled between February and March 2009 at Heron Island Research Station. Average sea surface temperatures (1982–2008) for the three warmest months (January-March) are 28.9uC in the Lizard Island region and 27.5uC in the Heron Island region (Rayner et al. 2003, 2006). The warmest months are January in the Lizard Island region (mean 29.2uC) and February in the Heron Island region (mean 27.85uC). The average range of annual sea surface temperatures (warmest monthly mean - coldest monthly mean) are 4.8uC for Lizard Island and 6.3uC for Heron Island. Temperatures were obtained from http://badc.nerc.ac. uk/data/hadisst.
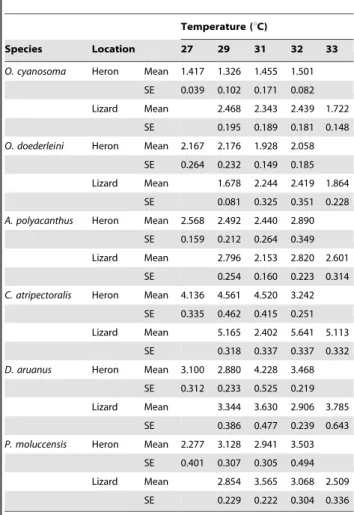
Six locally abundant species of reef fish from two families were examined: two cardinalfish (Ostorhinchus cyanosomaandO. doederleini) and four damselfish (Dascyllus aruanus,Chromis atripectoralis or Chromis viridis, Acanthochromis polyacanthus and Pomacentrus moluccensis). Wet mass (g) of fish used at each location and in each temperature treatment are shown in Table 1.
Respirometry experiments
Fish were captured from shallow lagoon and slope areas using clove oil anesthetic solution [29], small hand nets, or a 5 m barrier net. Methods of aquarium, feeding and temperature regimes, as well as the measurement of respiratory rates followed those previously described by O¨ stlund-Nilsson and Nilsson [30] and Nilsson et al. [26]. In brief, control and treatment fish were placed in identical 50-L aquaria and fed twice daily to satiation with commercial fish pellets. Control fish were maintained at the average summer temperatures for each location. Once fish had adjusted to aquaria conditions (commenced feeding and showed no abnormal behaviours), treatment temperatures were slowly increased over 1–3 days with aquarium heaters. Lizard Island experimental temperatures were 31, 32 and 33uC, in addition to a
control temperature of 29uC. Heron Island experimental temper-atures were 29, 31, and 32uC with a control temperature of 27uC. Maximal daily variation for treatment temperatures was60.5uC. Fish were kept at each temperature for 4–7 days before oxygen consumption was measured. A longer period was considered unnecessary since we have previously found that this has no significant effect on oxygen consumption in coral reef fish of these families [31]. Fish were starved for 24 h prior to measuring MO2Rest, then fed ad libitum during a 24 h rest period before
MO2Maxwas measured. It has been suggested that the aerobically
fuelled muscle mass in some fish is not large enough to force them to reach the maximum rate of oxygen uptake during maximal swimming performance [32]. Therefore, fish were fed prior to estimating MO2Max to ensure their oxygen demands were high
enough to engage the full capacity of the respiratory system. MO2Restand MO2Maxwere measured for 5–12 individuals per
species and location. MO2Rest indicate the cost of maintaining
basic metabolic functions and was measured as described by O¨ stlund-Nilsson and Nilsson [30]. In short, one fish at a time was put in a sealed cylindrical 750-ml Perspex chamber fitted with an oxygen electrode (OXI 340i from WTW, Germany). After running water through the chamber for 1–1.5 h (or longer if the fish showed signs of agitation) it was sealed and the fall in the dissolved oxygen concentration was recorded over 45–60 min. Table 1.Mean body mass (wet weight, g) of reef fish used in metabolism experiments at each location (Heron and Lizard Island) and temperature group.
Temperature (uC)
Species Location 27 29 31 32 33
O. cyanosoma Heron Mean 1.417 1.326 1.455 1.501 SE 0.039 0.102 0.171 0.082 Lizard Mean 2.468 2.343 2.439 1.722
SE 0.195 0.189 0.181 0.148 O. doederleini Heron Mean 2.167 2.176 1.928 2.058
SE 0.264 0.232 0.149 0.185 Lizard Mean 1.678 2.244 2.419 1.864
SE 0.081 0.325 0.351 0.228 A. polyacanthus Heron Mean 2.568 2.492 2.440 2.890
SE 0.159 0.212 0.264 0.349 Lizard Mean 2.796 2.153 2.820 2.601
SE 0.254 0.160 0.223 0.314 C. atripectoralis Heron Mean 4.136 4.561 4.520 3.242
SE 0.335 0.462 0.415 0.251 Lizard Mean 5.165 2.402 5.641 5.113
SE 0.318 0.337 0.337 0.332 D. aruanus Heron Mean 3.100 2.880 4.228 3.468
SE 0.312 0.233 0.525 0.219 Lizard Mean 3.344 3.630 2.906 3.785
SE 0.386 0.477 0.239 0.643 P. moluccensis Heron Mean 2.277 3.128 2.941 3.503
SE 0.401 0.307 0.305 0.494 Lizard Mean 2.854 3.565 3.068 2.509
SE 0.229 0.222 0.304 0.336 SE is standard error.
Experiments were ceased if dissolved oxygen fell below 60%. MO2Maxwas measured as described by Nilsson et al. [33] except
that a slightly larger chamber (500 ml) was used. In short, water was set in motion in a circular chamber by a 6 cm stirrer magnet and a wire mesh separated the fish from the magnet. A central cylinder created a circular swim chamber for the fish. Water speed was increased to a point where the fish only just keep up swimming against the current using the pectoral (aerobic) swimming mode. The fall in oxygen concentration in the sealed swimming chamber was recorded for 5–10 min during which time there was a linear fall in oxygen concentration. Oxygen levels during swimming trials were between 90 and 100% of air saturation. MO2Rest and
MO2Max were determined for each individual, but different
individuals were used for each temperature and location treatment.
The effect of location on MO2Rest, MO2Maxand aerobic scope
at the common treatment temperatures of 29, 31 and 32uC was compared using two-way fixed factor ANOVA. Because oxygen uptake varies with body mass, we first regressed oxygen consumption against body mass within each treatment tempera-ture at each location. The residuals of the regressions were then used in the ANOVA. This approach accounted for any differences in body size of the test fish between locations.
The range of temperatures tested differed between locations; 27–32uC at Heron Island and 29–33uC at Lizard Island. Therefore, in order to assess the effect of temperature rise on oxygen consumption across the full temperature range used, separate one-way ANOVAs were also conducted for each location. To account for minor differences in body size among temperature treatments the residuals from a regression of oxygen consumption against body mass for each location were used in the ANOVA. Following one-way ANOVA, Dunnett’s two-sided t-tests were used to compare the treatment temperatures against the control temperature (Heron = 27uC, Lizard = 29uC). Analysis of variance assumptions were verified using residual plots and Levene’s test. Due to heterogeneous variances in one location for one species, a Kruskal-Wallis test was required to compare the effect of temperature on resting metabolism.
Results
Maximal and resting respiration
At common treatment temperatures, four out of the six species showed significantly higher MO2Rest and MO2Max at the
high-latitude location (Heron Island, southern GBR) than at the low-latitude location (Lizard Island, northern GBR) (Figs. 2–3, Table 2a–b).
Cardinalfish
At common treatment temperatures (29, 31 and 32uC) the MO2Rest values of one cardinalfish, O. doederleini, was
approx-imately 20% higher for Heron Island fishes compared with Lizard Island fishes. Similarly the MO2Maxof this species was 20–30%
greater in fish from Heron Island than in fish from Lizard Island (Fig. 2). Similar proportional differences among latitudes occurred forO. cyanosoma, but were not statistically significant (Table 2a–b). Heron Island fish were smaller than Lizard Island fish for this species (Table 1) affecting metabolic comparisons.
MO2Restof the cardinalfish species increased with temperature
at both locations (Fig. 2, Table 3a). A 4uC increase in temperatures
Figure 2. A latitudinal comparison of oxygen consumption in cardinalfish.Maximum (open circles) and resting (solid circles) rates of oxygen consumption of two cardinalfish species from a high-latitude Great Barrier Reef location (Heron Island: solid lines) and a lower
latitude Great Barrier Reef location (Lizard Island: dashed lines). Values are means6SE from 5–12 fish.
at Heron Island (from 27uC to 31uC) caused a 33% increase in MO2RestforO. cyanosomaand doubled the MO2RestinO. doederleini.
A further temperature rise to 32uC increased MO2Rest by an
additional 25% inO. cyanosomawhile MO2RestinO. doederleiniwas
not significantly affected At Lizard Island a 4uC increase in temperature (from 29uC to 33uC) doubled MO2Rest in both O. cyanosomaandO. doederleini.
At both locations MO2Maxof cardinalfish were relatively stable
within the temperature range of 29–32uC (Fig. 2). At Heron Island, both cardinalfish species had higher MO2Maxat 29uC than
at 27uC, while no further increase occurred at higher temperatures (Fig. 2, Table 3b). In Lizard IslandO. cyanosoma, a temperature increase to 33uC induced high mortality rates as MO2Maxfell to
the MO2Rest value (leading to a total loss of aerobic scope, see
below). In Lizard Island O. doederleini maximum metabolic rates dropped by approximately 25%.
Damselfish
While MO2Max at common temperatures were higher in
southern GBR populations for most of the damselfish, the effect
of temperature on MO2Restwas dependent upon location (Fig. 3).
A significant interaction between location and temperature occurred in MO2RestforD. aruanusandA. polyacanthus(Table 2a).
ForD. aruanus, MO2Restat Lizard Island generally increased with
temperature. However, MO2Rest at Heron Island fluctuated as
temperature increased (Fig. 3, Table 2a), leading to a significant interaction between location and temperature. MO2Rest in A. polyacanthus populations rose with temperature but incremental increases were more variable in Heron Island fish than Lizard Island fish. Temperature and location did not interact for MO2Rest
ofP. moluccensis andC. atripectoralis. Resting rates inP. moluccensis were higher in Heron Island populations than Lizard Island populations at all common temperatures (Fig. 3). In contrast, MO2Restvalues ofC. atripectoraliswere similar between locations at
all common temperatures (Fig. 3).
Increased temperatures of up to 4uC did not cause collapse of respiratory performance in damselfish at either location (Figs. 3– 4). In general MO2Maxrates were stable at temperatures above the
control average summer temperature. No significant decreases in MO2Max were observed for damselfish (Table 3b). Southern Figure 3. A latitudinal comparison of oxygen consumption in damselfish.Maximum (open circles) and resting (solid circles) rates of oxygen consumption of four damselfish species from a from a high-latitude Great Barrier Reef location (Heron Island: solid lines) and a lower latitude Great Barrier Reef location (Lizard Island: dashed lines). Values are means6SE from 5–12 fish.
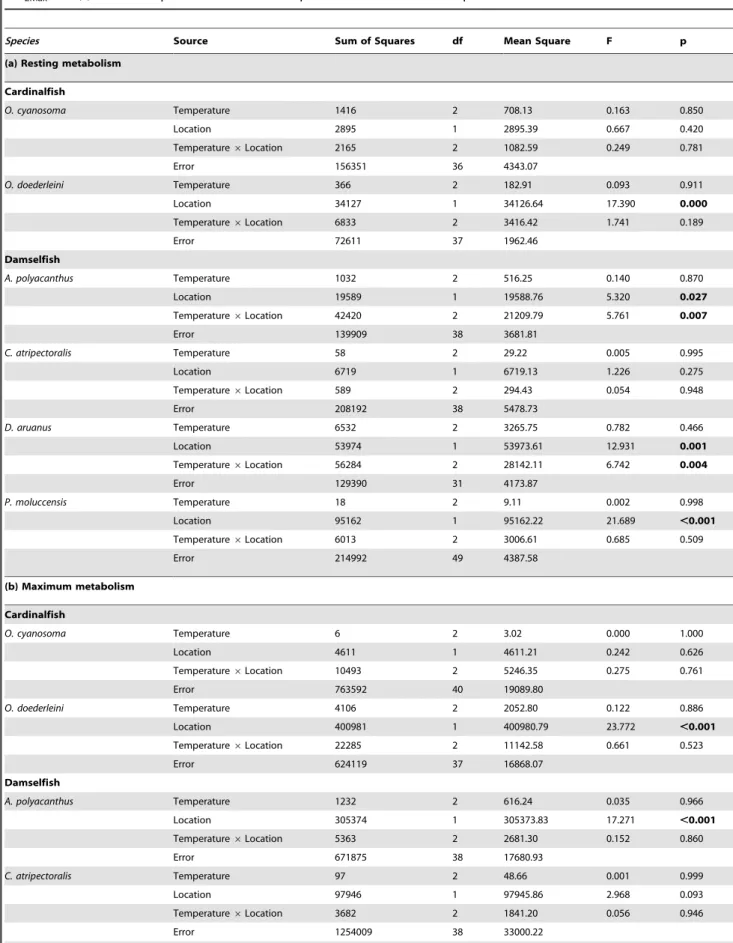
Table 2.Statistical results of two-way ANOVA analyses on the effects of latitude and increasing temperature on (a) MO2Rest, (b)
MO2Maxand (c) aerobic scope for two cardinalfish species and four damselfish species.
Species Source Sum of Squares df Mean Square F p
(a) Resting metabolism
Cardinalfish
O. cyanosoma Temperature 1416 2 708.13 0.163 0.850
Location 2895 1 2895.39 0.667 0.420
Temperature6Location 2165 2 1082.59 0.249 0.781
Error 156351 36 4343.07
O. doederleini Temperature 366 2 182.91 0.093 0.911
Location 34127 1 34126.64 17.390 0.000
Temperature6Location 6833 2 3416.42 1.741 0.189
Error 72611 37 1962.46
Damselfish
A. polyacanthus Temperature 1032 2 516.25 0.140 0.870
Location 19589 1 19588.76 5.320 0.027
Temperature6Location 42420 2 21209.79 5.761 0.007
Error 139909 38 3681.81
C. atripectoralis Temperature 58 2 29.22 0.005 0.995
Location 6719 1 6719.13 1.226 0.275
Temperature6Location 589 2 294.43 0.054 0.948
Error 208192 38 5478.73
D. aruanus Temperature 6532 2 3265.75 0.782 0.466
Location 53974 1 53973.61 12.931 0.001
Temperature6Location 56284 2 28142.11 6.742 0.004
Error 129390 31 4173.87
P. moluccensis Temperature 18 2 9.11 0.002 0.998
Location 95162 1 95162.22 21.689 ,0.001
Temperature6Location 6013 2 3006.61 0.685 0.509
Error 214992 49 4387.58
(b) Maximum metabolism
Cardinalfish
O. cyanosoma Temperature 6 2 3.02 0.000 1.000
Location 4611 1 4611.21 0.242 0.626
Temperature6Location 10493 2 5246.35 0.275 0.761
Error 763592 40 19089.80
O. doederleini Temperature 4106 2 2052.80 0.122 0.886
Location 400981 1 400980.79 23.772 ,0.001
Temperature6Location 22285 2 11142.58 0.661 0.523
Error 624119 37 16868.07
Damselfish
A. polyacanthus Temperature 1232 2 616.24 0.035 0.966
Location 305374 1 305373.83 17.271 ,0.001
Temperature6Location 5363 2 2681.30 0.152 0.860
Error 671875 38 17680.93
C. atripectoralis Temperature 97 2 48.66 0.001 0.999
Location 97946 1 97945.86 2.968 0.093
Temperature6Location 3682 2 1841.20 0.056 0.946
Error 1254009 38 33000.22
populations of D. aruanus and northern populations of C. atripectoraliswere the only ones to display any decline in MO2Max
when 29uC was exceeded (Fig. 3). Heron Island damselfish had lower MO2Maxat 27uC than at 29uC and in most cases MO2Max
was significantly lower at the control temperature (27uC) than at higher temperatures (Table 3b).
Aerobic scope
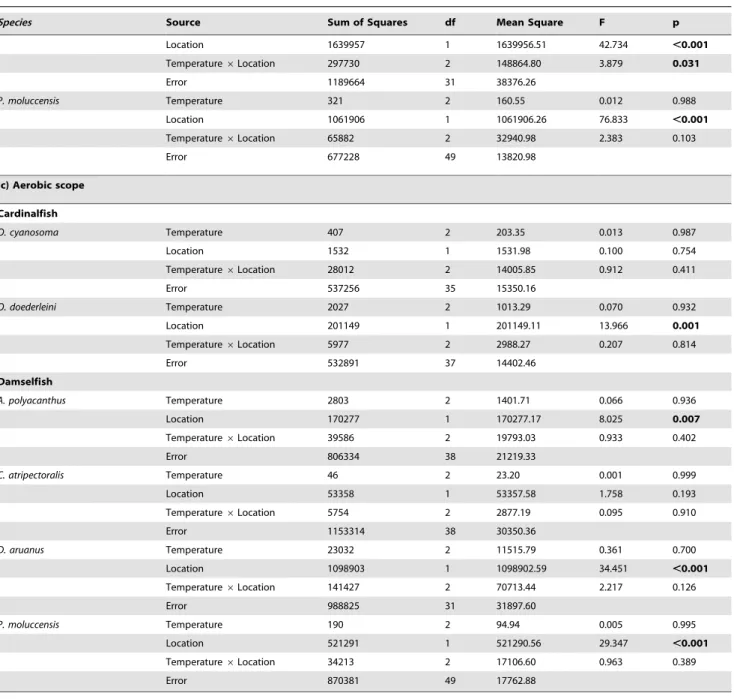
The higher-latitude populations (Heron Island), had either higher or the same aerobic scope as lower-latitude populations (Lizard Island) (Fig. 4). The effects of location and temperature were statistically independent for all species (Table 2c). In total four species, one cardinalfish (O. doederleini) and three damselfish (D. aruanus,P. moluccensisandA. polyacanthus), displayed significantly
higher aerobic scope at Heron Island than at Lizard Island (Table 2c, Fig. 4). The damselfishD. aruanusshowed the greatest location difference, with aerobic scope 80–130% greater in Heron Island fish than Lizard Island fish, within the common temperature range of 29–32uC. Aerobic scope of P. moluccensis and A. polyacanthus was 30–60% and 18–45% times higher at Heron than Lizard Island, respectively. Aerobic scope of O. doederleiniwas 25–40% greater at Heron Island. No difference in aerobic scope between locations was observed for two species, the cardinalfish O. cyanosoma and the damselfish C. atripectoralis (Table 2c).
Temperature effects on aerobic scope within each location were variable among species and families (Table 3c, Fig. 4). A 4uC increase at Lizard Island caused a virtually complete loss of
Species Source Sum of Squares df Mean Square F p
Location 1639957 1 1639956.51 42.734 ,0.001
Temperature6Location 297730 2 148864.80 3.879 0.031
Error 1189664 31 38376.26
P. moluccensis Temperature 321 2 160.55 0.012 0.988
Location 1061906 1 1061906.26 76.833 ,0.001
Temperature6Location 65882 2 32940.98 2.383 0.103
Error 677228 49 13820.98
(c) Aerobic scope
Cardinalfish
O. cyanosoma Temperature 407 2 203.35 0.013 0.987
Location 1532 1 1531.98 0.100 0.754
Temperature6Location 28012 2 14005.85 0.912 0.411
Error 537256 35 15350.16
O. doederleini Temperature 2027 2 1013.29 0.070 0.932
Location 201149 1 201149.11 13.966 0.001
Temperature6Location 5977 2 2988.27 0.207 0.814
Error 532891 37 14402.46
Damselfish
A. polyacanthus Temperature 2803 2 1401.71 0.066 0.936
Location 170277 1 170277.17 8.025 0.007
Temperature6Location 39586 2 19793.03 0.933 0.402
Error 806334 38 21219.33
C. atripectoralis Temperature 46 2 23.20 0.001 0.999
Location 53358 1 53357.58 1.758 0.193
Temperature6Location 5754 2 2877.19 0.095 0.910
Error 1153314 38 30350.36
D. aruanus Temperature 23032 2 11515.79 0.361 0.700
Location 1098903 1 1098902.59 34.451 ,0.001
Temperature6Location 141427 2 70713.44 2.217 0.126
Error 988825 31 31897.60
P. moluccensis Temperature 190 2 94.94 0.005 0.995
Location 521291 1 521290.56 29.347 ,0.001
Temperature6Location 34213 2 17106.60 0.963 0.389
Error 870381 49 17762.88
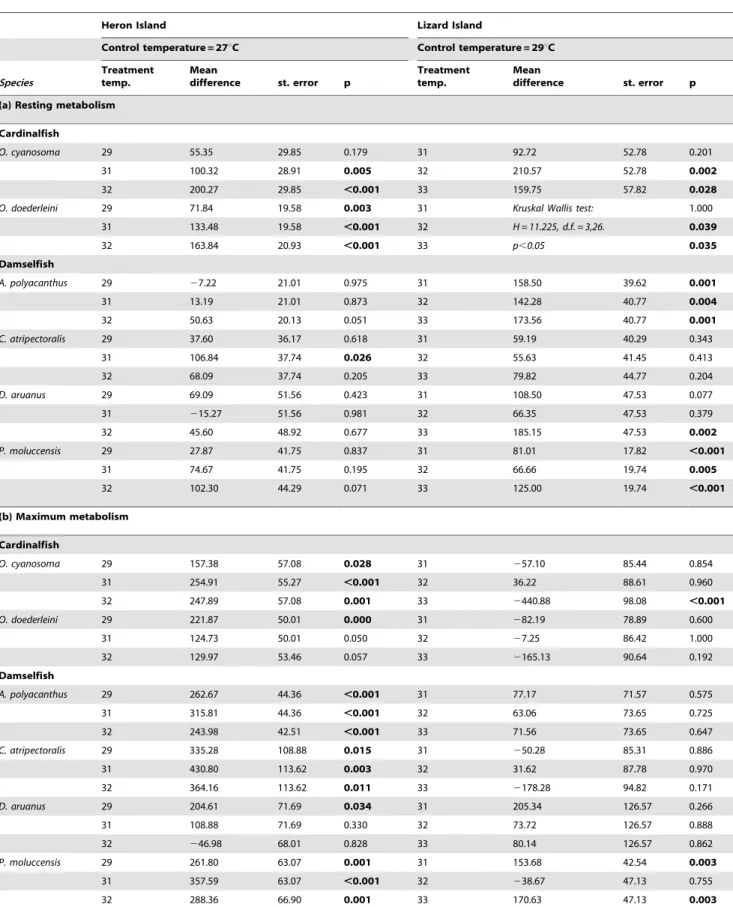
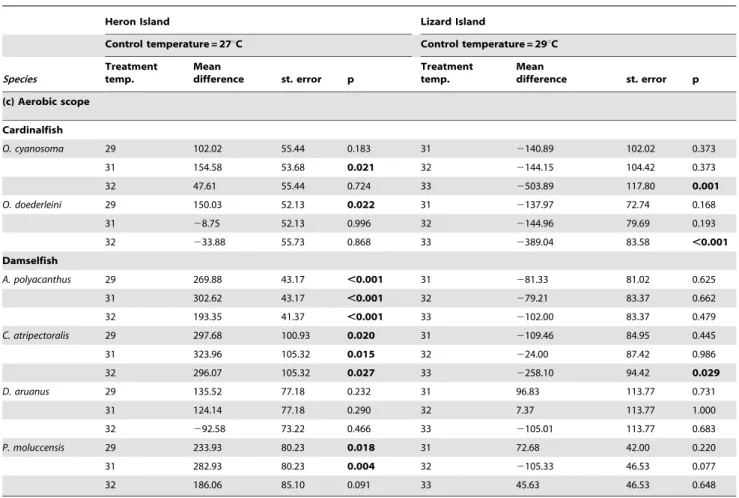
Table 3.Multiple comparison test results comparing the effect of rising temperatures on (a) MO2Rest, (b) MO2Maxand (c) aerobic
scope for two cardinalfish species and four damselfish species at two reef locations.
Heron Island Lizard Island
Control temperature = 27uC Control temperature = 29uC
Species
Treatment temp.
Mean
difference st. error p
Treatment temp.
Mean
difference st. error p
(a) Resting metabolism
Cardinalfish
O. cyanosoma 29 55.35 29.85 0.179 31 92.72 52.78 0.201
31 100.32 28.91 0.005 32 210.57 52.78 0.002
32 200.27 29.85 ,0.001 33 159.75 57.82 0.028
O. doederleini 29 71.84 19.58 0.003 31 Kruskal Wallis test: 1.000
31 133.48 19.58 ,0.001 32 H = 11.225, d.f. = 3,26. 0.039
32 163.84 20.93 ,0.001 33 p,0.05 0.035
Damselfish
A. polyacanthus 29 27.22 21.01 0.975 31 158.50 39.62 0.001
31 13.19 21.01 0.873 32 142.28 40.77 0.004
32 50.63 20.13 0.051 33 173.56 40.77 0.001
C. atripectoralis 29 37.60 36.17 0.618 31 59.19 40.29 0.343
31 106.84 37.74 0.026 32 55.63 41.45 0.413
32 68.09 37.74 0.205 33 79.82 44.77 0.204
D. aruanus 29 69.09 51.56 0.423 31 108.50 47.53 0.077
31 215.27 51.56 0.981 32 66.35 47.53 0.379
32 45.60 48.92 0.677 33 185.15 47.53 0.002
P. moluccensis 29 27.87 41.75 0.837 31 81.01 17.82 ,0.001
31 74.67 41.75 0.195 32 66.66 19.74 0.005
32 102.30 44.29 0.071 33 125.00 19.74 ,0.001
(b) Maximum metabolism
Cardinalfish
O. cyanosoma 29 157.38 57.08 0.028 31 257.10 85.44 0.854
31 254.91 55.27 ,0.001 32 36.22 88.61 0.960
32 247.89 57.08 0.001 33 2440.88 98.08 ,0.001
O. doederleini 29 221.87 50.01 0.000 31 282.19 78.89 0.600
31 124.73 50.01 0.050 32 27.25 86.42 1.000
32 129.97 53.46 0.057 33 2165.13 90.64 0.192
Damselfish
A. polyacanthus 29 262.67 44.36 ,0.001 31 77.17 71.57 0.575
31 315.81 44.36 ,0.001 32 63.06 73.65 0.725
32 243.98 42.51 ,0.001 33 71.56 73.65 0.647
C. atripectoralis 29 335.28 108.88 0.015 31 250.28 85.31 0.886
31 430.80 113.62 0.003 32 31.62 87.78 0.970
32 364.16 113.62 0.011 33 2178.28 94.82 0.171
D. aruanus 29 204.61 71.69 0.034 31 205.34 126.57 0.266
31 108.88 71.69 0.330 32 73.72 126.57 0.888
32 246.98 68.01 0.828 33 80.14 126.57 0.862
P. moluccensis 29 261.80 63.07 0.001 31 153.68 42.54 0.003
31 357.59 63.07 ,0.001 32 238.67 47.13 0.755
aerobic capacity in populations of the two cardinalfish species. Aerobic scope in southern populations initially rose with temperature before declining after thermal increases above 29– 31uC. Compared to their 27uC control temperature, aerobic scope ofO. cyanosomawas significantly higher at 31uC andO. doederleini was significantly higher at 29uC (Table 3c, Fig. 4). Indeed, no significant declines were seen in the aerobic scope of the Heron Island cardinalfish. However, like on Lizard Island, we did detect a high mortality of Heron Island cardinalfish kept at 33uC for a few days, precluding any experiments at this temperature.
With the exception ofD. aruanus, the aerobic scopes of Heron Island damselfish were always higher at the experimentally elevated temperatures than at their average summer temperature control of 27uC (Fig. 4). Thus, Heron Island populations ofC. atripectoralis,P. moluccensisandA. polyacanthuseach had significantly higher aerobic scopes at 29, 31 and 32uC than at 27uC (Table 3c) D. aruanus was the only damselfish species at Heron Island for which elevating temperatures above the 27uC summer average did not significantly affect aerobic scope. For these fish, scope was 10% lower at 32uC than at the control temperature. Increased temperatures did not significantly affect the aerobic scope of Lizard Island damselfish except forC. atripectoralis, where a fall was seen at 33uC compared to 29uC (Table 3c).
In one cardinal fish (O. doederleini) and one damselfish (P. moluccensis), aerobic scope was virtually identical when measured at
the control temperature of the respective location (Fig. 4). In other words, for these species 27uC values from Heron Island were the same as 29uC values from Lizard Island. This suggests that either local adaptation or thermal acclimation in these species leads to a constancy in aerobic scope at the prevailing summer temperature.
Discussion
We detected significant differences in respiratory performance of reef fish populations at two widely separated locations on the Great Barrier Reef, but generally not as predicted by optimality models of thermal adaptation. Reef fish in the warmer, northern Great Barrier Reef location did not cope better with higher temperatures than their conspecifics in the cooler, southern region. Instead, the southern populations had either greater or equivalent aerobic scope than the northern populations when tested at common temperatures. This counter-gradient variation in abso-lute aerobic capacity was mostly driven by southern populations exhibiting up to 80% higher MO2Maxcompared with the northern
populations. Southern populations generally also had higher levels of MO2Rest than northern populations when tested at common
temperatures. The capacity to maintain aerobic scope as temperature increases is thought to be the primary mechanism determining the response of water breathing species to global warming [9,34]. Due to their lower aerobic scope at higher
Heron Island Lizard Island
Control temperature = 27uC Control temperature = 29uC
Species
Treatment temp.
Mean
difference st. error p
Treatment temp.
Mean
difference st. error p
(c) Aerobic scope
Cardinalfish
O. cyanosoma 29 102.02 55.44 0.183 31 2140.89 102.02 0.373
31 154.58 53.68 0.021 32 2144.15 104.42 0.373
32 47.61 55.44 0.724 33 2503.89 117.80 0.001
O. doederleini 29 150.03 52.13 0.022 31 2137.97 72.74 0.168
31 28.75 52.13 0.996 32 2144.96 79.69 0.193
32 233.88 55.73 0.868 33 2389.04 83.58 ,0.001
Damselfish
A. polyacanthus 29 269.88 43.17 ,0.001 31 281.33 81.02 0.625
31 302.62 43.17 ,0.001 32 279.21 83.37 0.662
32 193.35 41.37 ,0.001 33 2102.00 83.37 0.479
C. atripectoralis 29 297.68 100.93 0.020 31 2109.46 84.95 0.445
31 323.96 105.32 0.015 32 224.00 87.42 0.986
32 296.07 105.32 0.027 33 2258.10 94.42 0.029
D. aruanus 29 135.52 77.18 0.232 31 96.83 113.77 0.731
31 124.14 77.18 0.290 32 7.37 113.77 1.000
32 292.58 73.22 0.466 33 2105.01 113.77 0.683
P. moluccensis 29 233.93 80.23 0.018 31 72.68 42.00 0.220
31 282.93 80.23 0.004 32 2105.33 46.53 0.077
32 186.06 85.10 0.091 33 45.63 46.53 0.648
For each location, treatment temperatures were tested against the control temperature using Dunnetts two-sided t test. Analyses were conducted upon the residuals of oxygen consumption regressed against test fish body mass for each location. Kruskal-Wallis test was used in the case of heterogeneous variances.Bold valuesindicate significant test results.
temperatures, our results suggest that populations of tropical reef fishes living in already warm low-latitude locations will be more sensitive to future increases in ocean temperatures than conspecific populations living in cooler high-latitude locations.
Counter-gradient patterns in thermal performance typically involve some form of metabolic compensation for the negative effect of thermal gradients on particular traits [20,21]. Such mechanisms may drive the higher maximal oxygen consumption
Figure 4. A latitudinal comparison of aerobic scope in cardinalfish and damselfish.Aerobic scope (MO2Max- MO2Rest) in two cardinalfishes and four damselfishes from a high-latitude Great Barrier Reef location (Heron Island: open circles, solid lines) and a lower latitude Great Barrier Reef location (Lizard Island: solid circles, dashed lines). Values are means6SE from 5–12 fish.
observed in our higher latitude populations. There are at least four major physiological factors guiding the maximal rate of oxygen uptake in vertebrates [35]; (1) cardiac output that determines the rate of blood flow through the respiratory organ (e.g. gills) and perfusion of the rest of the body, (2) respiratory surface area (e.g. gill surface area), (3) the oxygen carrying capacity of the blood, which is dependent on hemoglobin concentration, and (4) the degree of downloading of oxygen from blood to the tissues. The higher absolute values for MO2Maxand aerobic scope displayed by
the Heron Island populations in four out of six species could be explained by either larger respiratory surface areas or higher blood hemoglobin contents in these higher latitude populations. Fishes, like other vertebrates, can regulate blood hemoglobin content through erythropoesis [36] and recent studies have revealed that some fish have a significant capacity for changing the gill surface area both as adults [37] and during development [38,39]. The higher MO2Rest of Heron Island populations could also be
explained by such differences, because a larger gill surface area will lead to higher energetic costs for maintaining ion-homeostasis [40] and a higher red blood cell content leads to increased blood viscosity and therefore higher energetic costs for maintaining blood circulation. The adaptive advantage for higher latitude populations having a higher MO2Max, a larger respiratory surface
areas or a higher blood hemoglobin content is currently unknown, but could be related to detrimental effects of cooler water on one or more life-history traits. In particular, increased metabolic rate could help maintain growth and developmental rates in cooler water, as observed in some temperate water fishes and other aquatic species [21,22]. Other factors, including differences in water flow regimes and short term temperature extremes, or differences in fish community structure (e.g. predators and competitors), might also contribute to differences in respiratory performance between fish from Lizard Island and Heron Island.
In contrast to the differences in aerobic scope seen in some Heron Island fish compared with Lizard Island fish, there was no clear evidence for differences in the thermal optima between fish from the two sites. However, further experiments would be required to confirm the apparent similarities in thermal optima between locations. Thermal optima of some ectotherms are fine-tuned to their local thermal environment. For example, the optimal thermal temperature of Pacific salmon populations varies in direct relationship with their historically experienced river temperatures [15]. If Heron Island fish populations were adapted to the average summer temperatures experienced at that location, MO2Max and aerobic scope should have been highest at 27uC.
Instead, aerobic scope for all six species at Heron Island was highest between 29–31uC, well above the average summer temperatures experienced at this latitude. Due to north - south dispersal gradients on the Great Barrier Reef (GBR) [27], Heron Island populations may receive considerable gene flow from northern populations causing their apparent thermal optimum to be more suited to the summer reef temperatures of lower latitude reefs (e.g. 29–31uC).
Two species did not exhibit a significant difference in aerobic scope between locations. One of these species, O. cyanosoma, exhibited similar responses in MO2Restand MO2Maxto the other
species tested; however, the increase in MO2Maxat Heron Island
compared with Lizard Island was primarily due to differences in body mass between locations. Heron Island O. cyanosoma were slightly smaller and thus had higher metabolic rates than Lizard Island fish. For C. atripectoralis, there was clearly no effect of location on MO2Rest, MO2Max, or aerobic scope. Within locations,
temperature affected MO2Rest and MO2Maxof C. atripectoralis as
expected, but there was no difference in the magnitude of oxygen
consumption between locations. Despite evidence of some genetic structure betweenC. atripectoralispopulations on the northern and southern GBR [27,28], our results reveal no apparent difference in the capacity for thermal acclimation in this species.
Overall, our results suggest that Heron Island fish may perform better under warmer water conditions likely to occur in the future. In contrast, increases in average summer temperatures of$2uC at Lizard Island are likely to affect community structure [26]. These lower-latitude populations appear to be living at or above their thermal optima and near their critical thermal limits. Whether the differences in respiratory performance we detected between locations are due to phenotypic or genotypic differences (ie. local adaptation, developmental plasticity, or a combination of the two) remains to be determined. Testing between these alternative will require sophisticated breeding experiments where offspring from the two populations are reared throughout their entire life-span at a range of different temperatures. There is some evidence that the differences in respiratory performance could have a least some genetic basis. Three of the damselfishes species tested here (A. polyacanthus, C. atripectoralis, P. moluccensis) exhibit genetic structure between the northern and southern GBR [27,28], with the strongest structure exhibited byA. polyacanthus. Furthermore, some cardinalfishes, includingO. doederleini[41] exhibit genetic structure similar to that exhibited byA. polyacanthus at local spatial scales. Thus, there is evidence for some level of genetic differentiation between Heron Island and Lizard Island populations, which is consistent with a hypothesis of local adaptation in respiratory performance. However, recent evidence for developmental plasticity in thermal acclimation by one of the species, A. polyacanthus(Donelson, unpublished data) suggests that there may also be flexibility in metabolic responses to temperature gradients that are established during the juvenile phase. Most likely, local genetic structure and developmental plasticity interact to generate the patterns of thermal performance we observed at each location. It is evident that coral reef fish families and species differ in their tolerance to thermal changes. Greater aerobic sensitivity to increasing temperature was exhibited by the two cardinalfish species compared with the four damselfish species, at both Lizard Island and Heron Island. Familial differences may be related to behavioural differences in each group’s activity patterns. Damsel-fish and cardinalDamsel-fish are both well known as one of the most and one of the least active coral reef fish groups respectively [42]. Species with active behaviour, such as damselfish, are aerobically fitter and thereby predicted to cope better with increased metabolic energy demands (such as temperature) compared to groups, such as cardinalfish, with less daily energy expenditure [25,43].
Clearly, determining if geographic ranges of tropical reef fishes are associated with respiratory thermal sensitivity will require more detailed knowledge on the geographical ranges and thermal performance curves of these species.
Whether warming oceans will shift the distributions of tropical marine species polewards depends strongly on the metabolic capacity of populations to keep pace with increased oxygen demand [9,34]. If the strong counter-gradient patterns seen here are prevalent among reef fish, and other tropical marine ectotherms, then lower latitude populations inhabiting warmer waters will be more sensitive to global warming than populations of the same species at higher latitudes. Where dispersal mechanisms permit we might expect species with distributions currently centered in low latitudes to expand their distribution polewards. The long term viability of populations at low latitudes will depend on their ability to acclimate or adapt to warmer seas. Given the lack of evidence we detected for fine-tuning of thermal optima to match average or maximum summer temperatures,
prospects for rapid adaptation to warming ocean temperatures by low-latitude populations may be limited.
Acknowledgments
We thank M. Bonin, C. Neligh, J. Stella, M-E. Portwood, S. O¨ stlund -Nilsson, LIRS and HIRS staff for their excellent and essential field assistance particularly during cyclonic activities. We are particularly grateful to Janice Lough for assistance with GBR sea surface temperature data. We also thank two anonymous reviewers for their helpful advice regarding this manuscript.
Author Contributions
Conceived and designed the experiments: NMG PLM GEN. Performed the experiments: NMG GEN. Analyzed the data: NMG. Contributed reagents/materials/analysis tools: PLM GEN. Wrote the paper: NMG PLM GEN. Contributed funding and materials: PLM GEN.
References
1. Meehl GA, Stocker TF, Collins WD, Friedlingstein P, Gaye AT, et al. (2007) Global climate projections. In: Solomon S, Qin D, Manning M, Chen Z, Marquis M, et al. (2007) Climate Change 2007: The physical science basis, Contribution of working group I to the fourth assessment report of the intergovernmental panel on climate change. Cambridge, United Kingdom and New York, NY, USA: Cambridge University Press. pp 748–845.
2. Bindoff NL, Willebrand J, Artale V, Cazenave A, Gregory J, et al. (2007) Observations: Oceanic climate change and sea level. In: Solomon S, Qin D, Manning M, Chen Z, Marquis M, et al. (2007) Climate Change 2007: The physical science basis, Contribution of working group I to the fourth assessment report of the intergovernmental panel on climate change. Cambridge, United Kingdom and New York, NY, USA: Cambridge University Press.
3. Lough JM (2008) Shifting climate zones for Australia’s tropical marine ecosystems. Geophys Res Lett 35: L14708.
4. Poloczanska ES, Babcock RC, Butler A, Hobday A, Hoegh-Guldberg O, et al. (2007) Climate change and Australian marine life. Oceanogr Mar Biol Annu Rev 45: 407–478.
5. Root TL, Hall KR, Schnelders SH, Rosenzweig C, Pounds A (2003) Fingerprints of global warming on wild animals and plants. Nature 421: 57–60. 6. Brierley AS, Kingsford MJ (2009) Impacts of climate change on marine
organisms and ecosystems. Curr Biol 19: R602–R614.
7. Grebmeier JM, Overland JE, Moore SE, Farley EV, Carmack EC, et al. (2006) A major ecosystem shift in the northern Bering Sea. Science 311: 1461–1464. 8. Perry AL, Low PJ, Ellis JR, Reynolds JD (2005) Climate change and distribution
shifts in marine fishes. Science 308: 1912–1915.
9. Po¨rtner HO, Knust R (2007) Climate change affects marine fishes through the oxygen limitation of thermal tolerance. Science 315: 95–97.
10. Walther G-R, Post E, Convey P, Menzel A, Parmesan C, et al. (2002) Ecological responses to recent climate change. Nature 416: 389.
11. Parmesan C (2006) Ecological and evolutionary responses to recent climate change. Annu Rev Ecol Syst 37: 637–669.
12. Gardner JL, Heinsohn R, Joseph L (2009) Shifting latitudinal clines in avian body size correlate with global warming in Australian passerines. Proc R Soc B 276: 3845–3852.
13. Munch SB, Salinas S (2009) Latitudinal variation in lifespan within species is explained by the metabolic theory of ecology. Proc Natl Acad Sci USA 106: 13860–13864.
14. Po¨rtner HO (2001) Climate change and temperature-dependent biogeography: oxygen limitation of thermal tolerance in animals. Naturwissenschaften 88: 137–146.
15. Farrell AP, Hinch SG, Cooke SJ, Patterson DA, Crossin GT, et al. (2008) Pacific salmon in hot water: Applying aerobic scope models and biotelemetry to predict the success of spawning migrations. Physiol Biochem Zool 81: 697–708. 16. Schroer M, Wittmann AC, Gruner N, Steeger HU, Bock C, et al. (2009) Oxygen
limited thermal tolerance and performance in the lugwormArenicola marina: A latitudinal comparison. J Exp Mar Biol Ecol 372: 22–30.
17. Schulte PM (2007) Responses to environmental stressors in an estuarine fish: Interacting stressors and the impacts of local adaptation. J Therm Biol 32: 152–161.
18. Fangue NA, Hofmeister M, Schulte PM (2006) Intraspecific variation in thermal tolerance and heat shock protein gene expression in common killifish, Fundulus heteroclitus. J Exp Biol 209: 2859–2872.
19. Levins R (1968) Evolution in changing environments. Princeton, NJ: Princeton University Press.
20. Angilletta MJ (2009) Thermal adaptation: A theoretical and empirical synthesis. New York: Oxford University Press.
21. Conover DO, Duffy TA, Hice LA (2009) The covariance between genetic and environmental influences across ecological gradients. Reassessing the evolution-ary significance of countergradient and cogradient variation. The Year in Evolutionary Biology 2009: Ann. N.Y. Acad. Sci 1168: 100–129.
22. Conover DO, Schultz ET (1995) Phenotypic similarity and the evolutionary significance of countergradient variation. Trends Ecol Evol 10: 248–252. 23. Deutsch CA, Tewksbury JJ, Huey RB, Sheldon KS, Ghalambor CK, et al.
(2008) Impacts of climate warming on terrestrial ectotherms across latitude. Proc Natl Acad Sci USA 105: 6668–6672.
24. Tewksbury JJ, Huey RB, Deutsch CA (2008) Ecology - Putting the heat on tropical animals. Science 320: 1296–1297.
25. Po¨rtner HO, Lannig GL (2009) Oxygen and capacity limited thermal tolerance. In: Richards JL, Farrell AP, Brauner CJ, eds. Hypoxia. London: Elsevier Inc. pp 143–191.
26. Nilsson GE, Crawley N, Lunde IG, Munday PL (2009) Elevated temperature reduces the respiratory scope of coral reef fishes. Global Change Biol 15: 1405–1412.
27. Doherty PJ, Planes S, Mather P (1995) Gene flow and larval duration in 7 species of fish from the Great-Barrier-Reef. Ecology 76: 2373–2391. 28. Bay LK, Crozier RH, Caley MJ (2006) The relationship between population
genetic structure and pelagic larval duration in coral reef fishes on the Great Barrier Reef. Mar Biol 149: 1247–1256.
29. Munday PL, Wilson SK (1997) Comparative efficacy of clove oil and other chemicals in anaesthetization ofPomacentrus amboinensis, a coral reef fish. J Fish Biol 51: 931–938.
30. O¨ stlund-Nilsson S, Nilsson GE (2004) Breathing with a mouth full of eggs: respiratory consequences of mouthbrooding in cardinalfish. Proc R Soc Lond, B 271: 1015–1022.
31. Nilsson GE, O¨ stlund-Nilsson S, Munday PL (2010) Effects of elevated temperature on coral reef fishes: Loss of hypoxia tolerance and inability to acclimate. Comp Biochem Physiol A 156: 389–393.
32. Goolish EM (1991) Aerobic and anaerobic scaling in fish. Biol Rev 66: 833–856. 33. Nilsson GE, Ostlund-Nilsson S, Penfold R, Grutter AS (2007) From record performance to hypoxia tolerance: respiratory transition in damselfish larvae settling on a coral reef. Proc R Soc B 274: 79–85.
34. Po¨rtner HO, Farrell AP (2008) Physiology and Climate Change. Science 322: 690–692.
35. Nilsson GE (2010) Respiratory Physiology of Vertebrates. Cambridge: Cam-bridge University Press.
36. Lai JC, Kakuta I, Mok HO, Rummer JL, Randall D (2006) Effects of moderate and substantial hypoxia on erythropoietin levels in rainbow trout kidney and spleen. J Exp Biol 209: 2734–2738.
37. Sollid J, Nilsson GE (2006) Plasticity of respiratory structures - changes in gill surface area as a function of temperature and O2
availability. Respiratory Physiology and Neurobiology 154: 241–251.
38. Chapman LJ, FG, Shinn J (2000) Phenotypic plasticity and the possible role of genetic assimilation: hypoxia-induced tradeoffs in the morphological traits of an African cichlid. Ecol Lett 2: 387–393.
39. Schaak S, Chapman LJ (2003) Interdemic variation in the African cyprinid
Barbus neumayeri: correlations among hypoxia, morphology, and feeding performance. Can J Zool 81: 430–440.
40. Gonzalez RJ, McDonald DG (1992) The relationship between oxygen consumption and ion loss in a freshwater fish. J Exp Biol 163: 317–332. 41. Gerlach G, Atema J, Kingsford MJ, Black KP, Miller-Sims V (2007) Smelling
42. Allen GR, Steene R, Humann P, Deloach N (2005) Reef fish identification: Tropical Pacific. Jacksonville, FL, USA: New World Publications.
43. Po¨rtner HO (2006) Climate-dependent evolution of Antarctic ectotherms: An integrative analysis. Deep-Sea Research II 53: 1071–1104.
44. Gardiner NM, Jones GP (2005) Habitat specialisation and overlap in a guild of coral reef cardinalfishes (Apogonidae). Mar Ecol Prog Ser 305: 163–175.
45. Allen GR (1991) Damselfishes of the world. Melle, Germany: Mergus Publishers. 271 p.