JSCS–4416 Original scientific paper
Electroanalytical determination of metronidazole
in tablet dosage form
SELEHATTIN YILMAZ1, ESRA BALTAOGLU1, GULSEN SAGLIKOGLU1, SULTAN YAGMUR1, KAMRAN POLAT2 and MURAT SADIKOGLU3*
1Onsekiz Mart University, Faculty of Science and Arts, Department of Analytical Chemistry,
17020, Canakkale, Turkey, 2Ankara University, Faculty of Science, Department of Chemistry,
06100, Ankara, Turkey and 3Gaziosmanpasa University, Faculty of Education,
Department of Science Education, 60100, Tokat, Turkey
(Received 11 January, revised 3 May 2012)
Abstract:In this study, the electrochemical reduction and determination of met-ronidazole were easily realized in Britton–Robinson buffer (pH 4.01) using an UTGE by cyclic voltammetric (CV) and differential pulse voltammetric (DPV) techniques. In this acidic medium, one irreversible and a sharp cathodic peak were observed. A linear calibration curve for DPV analysis was constructed in the metronidazole concentration range 3×10⁻⁶–9×10⁻⁵ mol L-1. The limit of de-tection (LOD) and limit of quantification (LOQ) were 1.42×10⁻⁷ and 4.76×10⁻⁷ mol L-1 respectively.
Keywords:metronidazole;determination; voltammetry; UTGE; dosage form.
INTRODUCTION
Metronidazole is a nitroimidazole anti-infective medication (Fig. 1) used
mainly in the treatment of infections caused by susceptible organisms,
parti-cularly anaerobic bacteria and protozoa.
1–7Fig. 1. Chemical structure of metronidazole.
Methods for the assay of metronidazole in pharmaceutical dosage forms are
usually based on high performance liquid chromatographic (HPLC)
8and
spec-trophotometric
9techniques. For such applications, however, the analyses are
time consuming and are of high cost.
Hitherto, only a few papers have been published about the electroanalytical
determination of metronidazole based on its reduction behaviour.
1–7The
deter-mination of metronidazole on an ultra trace graphite electrode (UTGE) based on
its detailed electrochemical reductive behaviour has to date not yet been reported
.
Therefore, it was considered of interest to investigate the properties of the
re-duction process and determination of metronidazole in tablet dosage form using a
UTGE.
EXPERIMENTAL
Apparatus
A Model Metrohm 757 VA trace analyzer (Herisau, Switzerland) was used for the voltammetric measurements, with a three-electrode system consisting of an ultra trace gra-phite working electrode (UTGE, disc diameter; R = 2 mm, Metrohm), a platinum wire auxiliary electrode and Ag/AgCl (KCl 3 mol L-1, Metrohm) reference electrode. Firstly, deoxygenation of the supporting electrolyte solutions was performed with argon gas for 5 min before all experiments. Then, the argon gas was also passed through the solutions for 60 s after the addition of each sample solution in the experiments. All pH measurements were made with Model Metrohm 744 pH meter (Herisau, Switzerland).
Reagents
Metronidazole as pure active material and its Nidazole® tablets (labelled as containing 250 mg metronidazole per tablet) was kindly supplied by I. E. Ulugay (Istanbul, Turkey). A stock solution of 1.0×10⁻² mol L-1 of metronidazole was prepared by dissolving an accurate mass of the drug in an appropriate volume of ethanol and kept in a refrigerator. Britton–Ro-binson buffer solutions (0.04 mol L-1, pH 2.09–12.00); acetic acid, Riedel, Seelze, Germany, 100 mas. %; boric acid, Merck, Darmstadt, Germany, and phosphoric acid, Carlo Erba, Rodeno, France, 85 mas. %, were used for the supporting electrolyte solution.
Calibration graph for quantitative determination
The stock solution of metronidazole was diluted with ethanol to obtain different metro-nidazole concentrations. Using the optimum conditions described in the experimental section, a linear calibration curve for DPV analysis was constructed in the metronidazole concentra-tion range 3×10⁻⁶–9×10⁻⁵ mol L-1 (Fig. 2). The repeatability, accuracy and precision were checked (Table I).
Working voltammetric procedure of spiked tablet dosage forms
Fig. 2. The calibration voltammograms at different concentrations (b–j) of metronidazole in 0.04 mol L-1 BR buffer (pH 4.01) on an UTGE by DPV; a) blank;
b–j) increasing concentrations of metronidazole.
TABLE I.Regression data of the calibration lines for the quantitative determination of metro-nidazole. The calibration plots were obtained in 0.04 mol L-1 BR buffer (pH 4.01) on an UTGE using the DPV technique
Parameter Results
Measured potential, mV –0.432
Linear concentration range, mol L-1 3.0×10⁻⁶–9.0×10⁻⁵
Slope, µA M-1 2.96×10⁴
Intercept, µA 1.35
Correlation coefficient, r 0.0233
SE of slope 16.48
SE of intercept 0.9989
Number of measurements, N 10
LOD / mol L-1 1.42×10⁻⁷
LOQ / mol L-1 4.76×10⁻⁷
Repeatability of the peak current, RSD / % 0.47 Reproducibility of the peak current, RSD / % 0.41 Repeatability of the peak potential, RSD / % 0.69 Reproducibility of the peak potential, RSD / % 0.61
RESULTS AND DISCUSSION
Electrochemical reduction behaviour of metronidazole
measu-between 10–1000 mV s
–1on a UTGE in 0.04 mol L
–1BR buffer (pH 4.01) are
shown in Fig. 3.
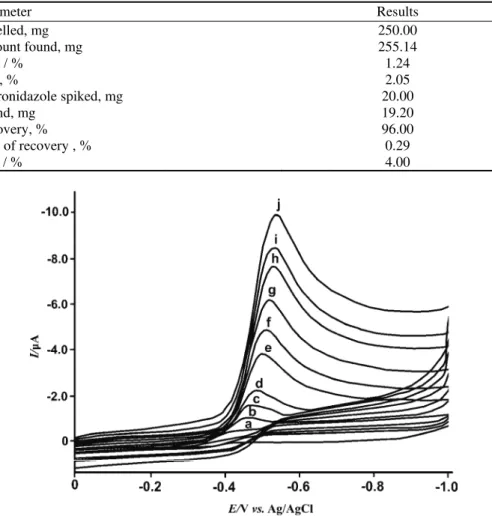
TABLE II. Application of the DPV technique for the assay of metronidazole in commercial spiked Nidazole® tablets and mean recoveries on an UTGE
Parameter Results
Labelled, mg 250.00
Amount found, mg 255.14
RSD / % 1.24
Bias, % 2.05
Metronidazole spiked, mg 20.00
Found, mg 19.20
Recovery, % 96.00
RSD of recovery , % 0.29
Bias / % 4.00
Fig.3. The cyclic voltammograms of 1×10⁻⁴ mol L-1 metronidazole in 0.04 mol L-1 Britton–Robinson (BR) buffer (pH 4.01) on an UTGE. Scan rate, mV s-1: a) blank, b) 10, c) 25, d) 50, e) 100, f) 150, g) 250, h) 500, i) 750 and j) 1000.
Scan rate studies were then performed to assess whether the processes on the
UTGE were under diffusion or adsorption control.
10–20Two tests were employed
for this procedure. One of them was the linear relationship obtained on the UTGE
between the peak current and square root of the scan rate between 10–1000 mV s
–1as follows:
I
p/
µ
A = 0.2423
ν
1/2(mV s
–1) + 0.04 (r = 0.991)
(1)
Correlation coefficient was found very close to 1.0 showing that the reduction
process was diffusion-controlled.
Another important test is the plot of the logarithm of the peak current vs. the
logarithm of the scan rate that gave a straight line with a slope of 0.52, which is
nearly the same as the theoretical value of 0.5 that is expected for an ideal
reac-tion of solureac-tion species.
10–20The equation obtained on the UTGE was:
log
I
p/
µ
A = 0.5221 log
ν
(mV s
–1) – 0.6358
(r = 0.998)
(2)
Therefore, a diffusion component must be taken into account. Other studies
were conducted in line with this phenomenon.
Next, in order to obtain the optimum experimental conditions, the effect of
pH on peak potential and peak intensity were studied on the UTGE using DPV
techniques. The DPV results for the reduction reaction of metronidazole are given
as
E–pH and I–pH graphs in Figs. 4a and 4b, respectively, for the UTGE. The
voltammetric response was strongly pH dependent. The peak potential of the
ca-thodic peak was shifted to more positive values with increasing pH (Fig. 4a).
As can be seen from Fig. 4a, highly linear segments of potential were found
between pH values of about 2–8. In acid and neutral media, the reduction was pH
dependent, although for pH values higher than 8, the reduction was pH
indepen-dent, in agreement with Brett and Leach.
6,7This indicates that metronidazole shows basic properties in acidic and
neut-ral media (pH 2–8). The differential pulse and cyclic voltammograms of
metroni-dazole at pH 4.01 are shown in Figs. 2 and 3, respectively. This peak corresponds
to reduction of the nitro group to form the hydroxylamine, involving 4 electrons
and 4 protons followed by a two-electron reduction of the hydroxylamine to
amine.
6However, metronidazole shows weakly basic (or strong acid) properties
at pH values higher than 8, meaning a decrease in the protonation of
hydroxyl-lamine with increasing pH.
6Validation parameters for the quantitative analysis
(a)
(b)
Fig. 4. Effect of pH on the DPV peak potential (a) and peak current (b) of 5×10⁻⁵ mol L-1 metronidazole; □) ace-tate (0.2 mol L-1); ∆) phosphate (0.067 mol L-1); ◊) Britton–Robinson buffer (0.04 mol L-1).
LOD and LOQ were calculated from the electro-reduction peak current using
the following equations: LOD = 3 s/m and LOQ = 10 s/m (s is the standard
de-viation of the peak currents (ten runs), m is the slope of the calibration curve):
10–20LOD = 3 s/m = 3×1.4×10
–3/2.96×10
4= 1.42×10
–7M
(3)
LOQ = 10 s/m = 10×1.4×10
–3/2.96×10
4= 4.73×10
–7M
(4)
The precision and accuracy of the developed method were checked by
reco-very studies in tablet dosage form. The procedures are given in the
pharmaceu-tical application section (Table II).
Pharmaceutical applications
The amount of metronidazole in nidazole commercial tablets was calculated
by reference to the appropriate calibration plots. The results obtained are given in
Table II.
To determine whether excipients in the tablets interfered with the analysis,
the accuracy of the proposed methods were evaluated by recovery tests after the
addition of a certain amount of pure drug to pre-analyzed formulations of
metro-nidazole (Table II). The results showed the validity of the proposed techniques
for the quantitative determination of metronidazole in tablets.
Acknowledgements. We would like to thank I. E. Ulugay (Istanbul, Turkey) for supply-ing the pure metronidazole and its nidazole tablet dosage forms for the development of the proposed voltammetric techniques.
И З В О Д
ЕЛЕКТРОАНАЛИТИЧКООДРЕЂИВАЊЕМЕТРОНИДАЗОЛА УТАБЛЕТНИМДОЗИРАНИМОБЛИЦИМА
SELEHATTIN YILMAZ1, ESRA BALTAOGLU1, GULSEN SAGLIKOGLU1, SULTAN YAGMUR1, KAMRAN POLAT2 и MURAT SADIKOGLU3
1Onsekiz Mart University, Faculty of Science and Arts, Department of Analytical Chemistry, 17020, Canakkale, Turkey, 2Ankara University, Faculty of Science, Department of Chemistry, 06100, Ankara, Turkey
и3Gaziosmanpasa University, Faculty of Education, Department of Science Education, 60100, Tokat, Turkey Уовомрадусуприказаниелектрохемијскаредукцијаиодређивањеметронидазола уБритoн–Робинсоновомпуферу (pH 4,01) применомцикличневолтаметрије (ЦВ) иди
-ференцијалнепулсневолтаметрије (ДПВ). Укиселојсрединизапаженјеиреверзибилан
иоштаркатоднипик. Конструисанајекалибрациона кривазаДПВ, линеарнауопсегу
3×10⁻⁶–9×10⁻⁵ mol L-1метронидазола. Границадетекције (ГД) иквантификације (ГК) из
-носе 1,42×10⁻⁷одн. 4,76×10⁻⁷ mol L-1.
(Примљено 11. јануара, ревидирано 3. маја 2012)
REFERENCES 1. E. Bishop, W. Hussein, Analyst109 (1984) 759
2. S. A. Özkan, Y. Özkan, Z Şentürk, J.Pharm. Biomed. Anal. 17 (1997) 3299
3. M. A. La-Scalea, S. H. P. Serrano, I. G. R. Gutz, J. Braz. Chem. Soc.10 (1999)127 4. P. N. Bartlett, E. Ghoneim, G. El-Hefnawy, I. El-Hallag, Talanta66 (2005) 869
5. E. Baltaoglu, master thesis, Çanakkale Onsekiz Mart University, Institute for Natural & Applied Sciences. Canakkale, 2007
6. A. M. O. Brett, S. H. P. Serrano, I. G. R. Gutz, M. A. La-Scale, Electroanalysis9 (1997) 110
7. S. C. Leach, R. D. Weaver, K. Kinushita, W. Lee, J. Electroanal Chem.129 (1981) 213 8. B. M. Tashtoush, E. L. Jacobson, M. K. Jacobson, Drug Dev. Ind. Pharm.34 (2008) 840
13. S. A. Ozkan, B. Uslu, Anal. Bioanal. Chem.372 (2002) 582
14. S. Skrzypek, W. Ciesielski, A. Sokołowski, S. Yilmaz, D. Kazmierczak, Talanta 66
(2005) 1146
15. M. Çıtak, S. Yılmaz, Y. Dilgin, G. Türker, S. Yagmur, H. Erdugan, N. Erdugan, Current Pharm. Anal. 3 (2007) 141
16. S. Skrzypek, W. Ciesielski, S. Yilmaz, Chem. Anal. (Warsaw)52 (2007) 1071
17. S. Yılmaz, S. Skrzypek, Y. Dilgin, S. Yagmur, M. Coskun, Curr. Anal. Chem. 3 (2007) 41
18. S. Yilmaz, M. Sadikoglu, G. Saglikoglu, S. Yagmur, G. Askin, Int. J. Electrochem. Sci.3
(2008) 1534
19. S. Yılmaz, Colloids Surfaces., B 71 (2009) 79
20. M. Sadikoglu, G. Saglikoglu, S. Yagmur, E. Orta, S. Yilmaz, Curr. Anal. Chem.7 (2011)