Article
Printed in Brazil - ©2014 Sociedade Brasileira de Química0103 - 5053 $6.00+0.00A
*e-mail: [email protected]
Nanostructured Screen-Printed Electrodes Modified with Self-Assembled
Monolayers for Determination of Metronidazole in Different Matrices
Bryan C. Huayhuas-Chipana,a,c Juan C. M. Gomeroa,b and Maria D. P. T. Sotomayor*,c
aFacultad de Ciencias, Universidad Nacional de Ingeniería, Av. Túpac Amaru 210, Lima, Peru
bFacultad de Ingeniería Industrial, Universidad de Lima, Santiago de Surco, Lima, Peru
cDepartamento de Química Analítica, Instituto de Química,
Universidade Estadual Paulista (UNESP), 14800-110 Araraquara-SP, Brazil
Neste trabalho é descrito o desenvolvimento de um sensor para detecção de metronidazol, usando um método simples para preparar estruturas nanoporosas de ouro em eletrodos impressos comerciais modificados com monocamadas autoarranjadas de tiol (SAMs). O processo envolve a formação inicial de espécies de ouro oxidadas a pH 7,0, e posteriormente a redução potenciodinâmica para a formação da superficie nanoestruturada, que a seguir foi modificada com cisteína para obtenção do sensor, o qual foi posteriormente caracterizado utilizando microscópio eletrônico de varredura (SEM), microscópio de forca atômica (AFM) e técnicas eletroquímicas. Para a quantificação de metronidazol foi otimizada a voltametria de onda quadrada (SWV).
Nas melhores condições de análise o sensor mostrou em −0,36 V uma faixa linear entre 50 e
300 µmol L−1 e limite de detecção (LOD) = 2,6 µmol L−1. No estudo de seletividade, o eletrodo
mostrou mais alta sensibilidade para os nitroimidazois. A resposta do sensor indica ser viável para a detecção deste fármaco em diferentes tipos de matrizes.
This paper describes the development of a sensor for the determination of metronidazole using a simple method involving the creation of nanoporous structures on gold electrodes followed by modification with self-assembled monolayers (SAMs) of thiols. The initial formation of oxidized gold species at pH 7.0 was followed by potentiodynamic reduction in order to obtain a nanostructured surface that was then modified with a SAM of cysteine. The sensor was characterized by scanning electron microscopy (SEM), atomic force microscopy (AFM), and electrochemical techniques. Quantification of metronidazole was performed using optimized square wave
voltammetry. Under the best analytical conditions, the sensor operated at −0.36 V showed a linear
range of 50-300 µmol L−1 and a limit of detection (LOD) of 2.6 µmol L−1. Evaluation of selectivity
demonstrated that the electrode provided higher sensitivity towards nitroimidazoles. The sensor responses showed that it could be used for detection of metronidazole in different types of matrix.
Keywords: self-assembled monolayers, cysteine, metronidazole, nanostructured gold electrode
Introduction
It is well known that gold reacts with sulfur to form thermodynamically and kinetically stable self-assembled monolayers (SAM) that are widely used in the manufacture of sensors and biosensors, where they act as molecular electronic biointerfaces.1-16 Thiols17,18 are used to improve
the stability of these devices and to transfer analyte redox information to the metal surface. Gold electrodes with greater porosity can be produced by electrochemical
deposition.19 Au-Ag alloys have also been used as starting
materials for the preparation of porous gold electrodes, where a relatively complex procedure is used to fuse gold with silver for subsequent separation.20-25
Nitro-containing compounds are widely found as byproducts in industrial processes such as those used to manufacture agrochemicals, dyes, and pharmaceuticals. Among the various nitro compounds, nitroimidazoles are some of the most common co-products. These compounds exhibit selective activity against anaerobic microorganisms, enabling them to be used in the treatment of infectious
compounds employed to combat microbial infections also show genotoxicity, which can cause adverse health effects including decreased fertility rates, mutagenesis, and carcinogenesis.27-30
The drug metronidazole is a nitro compound that is widely used due to its antiprotozoal properties and its activity against anaerobic gram-negative bacilli, gram-positive spore-forming bacilli, and all anaerobic cocci. The drug is widely indicated for the treatment of giardiasis, amoebiasis,
Trichomoniasis vaginitis, Gardnerella vaginalis, and
infections caused by anaerobic bacteria such as Bacteroides
fragilis and other Bacteroides spp., Fusobacterium spp.,
Clostridium spp., Eubacterium spp., and anaerobic cocci. It is used to treat patients with refractory chronic periodontitis, a disease characterized by the presence of anaerobic bacteria in the oral cavity. It is possible for the drug to be excreted and released to the environment in domestic sewage, making it an emerging pollutant that deserves attention due to the known adverse health effects of nitro compounds.
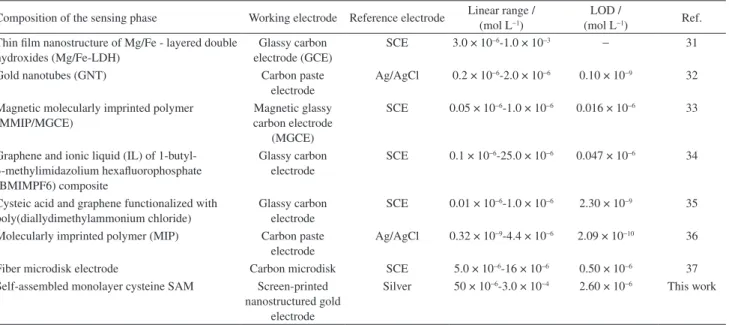
Various sensors have been described for the determination of metronidazole (Table 1). However, sensor construction can be difficult34,35 and response ranges are narrow.32-34,37 It
is therefore still necessary to develop reliable alternative analytical techniques for the determination of this and other nitro compounds present in biological and environmental samples.
The present work describes a new and simple procedure for producing a nanostructured gold electrode modified with a cysteine SAM for the determination of metronidazole in pharmaceutical formulations and biological samples.
Experimental
Reagents
All the reagents and solvents used in this work were analytical or HPLC grade. A standard solution of metronidazole (MTZ) at a concentration of 7.2 × 10⁻³ mol L−1 was prepared by dissolving a precisely weighed out quantity of the analyte in ethanol/water (1:4, v/v). Different concentrations were then prepared by diluting aliquots of the stock standard solution in Britton-Robinson (BR) buffer at pH 2.0 (used as the electrolyte). All aqueous solutions were prepared using deionized water (18.1 MΩ cm at 25 °C) obtained from a Milli-Q system (Millipore). The pH adjustment employed a pH meter (mPA 210, Tecnopon).
Electrochemical measurements
The electrochemical measurements were performed using a potentiostat (PGSTAT 12, Autolab/Eco Chemie) coupled to a personal computer and controlled by GPES software (v. 4.9.006, Eco Chemie). A conventional electrochemical cell (15 mL volume) containing 3 electrodes was used. The reference electrode was a commercial Ag|AgCl electrode (Analion), a coil of platinum was used as the counter electrode, and a modified commercial gold
SPE (DropSens 220BT, geometrical area of 0.126 cm2) was
used as the working electrode.
All experiments were carried out at ambient temperature and anaerobic conditions were maintained by bubbling nitrogen through the solutions during the measurements.
Table 1. Different sensors reported for the detection of metronidazole
Composition of the sensing phase Working electrode Reference electrode Linear range / (mol L−1)
LOD /
(mol L−1) Ref.
Thin film nanostructure of Mg/Fe - layered double hydroxides (Mg/Fe-LDH)
Glassy carbon electrode (GCE)
SCE 3.0 × 10⁻⁶-1.0 × 10⁻³ − 31
Gold nanotubes (GNT) Carbon paste
electrode
Ag/AgCl 0.2 × 10⁻⁶-2.0 × 10⁻⁶ 0.10 × 10⁻⁹ 32
Magnetic molecularly imprinted polymer (MMIP/MGCE)
Magnetic glassy carbon electrode
(MGCE)
SCE 0.05 × 10⁻⁶-1.0 × 10⁻⁶ 0.016 × 10⁻⁶ 33
Graphene and ionic liquid (IL) of 1-butyl-3-methylimidazolium hexafluorophosphate (BMIMPF6) composite
Glassy carbon electrode
SCE 0.1 × 10⁻⁶-25.0 × 10⁻⁶ 0.047 × 10⁻⁶ 34
Cysteic acid and graphene functionalized with poly(diallydimethylammonium chloride)
Glassy carbon electrode
SCE 0.01 × 10⁻⁶-1.0 × 10⁻⁶ 2.30 × 10⁻⁹ 35
Molecularly imprinted polymer (MIP) Carbon paste electrode
Ag/AgCl 0.32 × 10⁻⁹-4.4 × 10⁻⁶ 2.09 × 10⁻¹⁰ 36
Fiber microdisk electrode Carbon microdisk SCE 5.0 × 10⁻⁶-16 × 10−6 0.50 × 10⁻⁶ 37
Self-assembled monolayer cysteine SAM Screen-printed nanostructured gold
electrode
Silver 50 × 10−6-3.0 × 10⁻⁴ 2.60 × 10⁻⁶ This work
Preparation and modification of the nanostructured gold electrodes
The gold SPE was first treated in an aqueous solution of H2SO4 (1.0 × 10⁻⁴ mol L−1) to clean the electrode surface, using a cyclic voltammetry potential between
−0.6 and 0.8 V vs. Ag|AgCl (3 cycles) and a scan rate of
100 mV s−1. In the next step, the gold electrode was treated
in a solution of KOH (0.5 mol L−1), with application of a
previously optimized potential of 2.0 V for 180 s. This was immediately followed by a linear cathodic sweep between 2.0 and −0.2 V, at 50 mV s−1, in phosphate buffer solution
(pH 7.0) obtaining the nanostructured electrodes. All steps were carefully optimized to get oxidized gold surfaces without destroying the thin gold film covering the working electrode of the SPEs.
The nanostructured electrodes were characterized by scanning electron microscopy (SEM) and atomic force microscopy (AFM).
The sensors were obtained by immersing the nanostructured electrodes in 0.1 × 10⁻³ mol L−1 cysteine solution for 10 min, 20 min, 60 min, 12 h, and 72 h, in order to optimize formation of the SAM on the electrode surface. The best immersion time was found to be 20 min, which was then used in all subsequent preparation procedures.
Application of the sensor using pharmaceutical formulations
Sample preparation was performed as described in the
British Pharmacopoeia.38 A lotion (containing a labeled
amount of MTZ of 100 mg g−1) was prepared for analysis
by weighing out 61.1 mg of the sample and adding 2.5 µL of H2SO4 (0.1 mmol L−1) and 3 mL of methanol. The mixture was heated at 40 °C until dissolution was complete, and then filtered. Finally, the volume was completed to 50.0 mL with a 1:4 (volume ratio) mixture of ethanol and aqueous BR buffer solution (pH 2.0).
A suspension of the drug (containing a labeled
concentration of 40 mg mL−1 of benzoylmetronidazole) was
prepared for analysis using 2.2 mL of sample, to which was added a solution of ethanol/water (1:4, v/v). The mixture was sonicated for several minutes, filtered, and the volume was completed to 50.0 mL using the ethanol/water solution (1:4, v/v).
For the analysis of tablets containing 250 mg of MTZ (labeled amount), 10 tablets were ground and homogenized. Approximately 92.1 mg of this solid mixture was weighed out and dissolved in the ethanol/water solution (1:4, v/v), after which the mixture was sonicated for several minutes and then filtered. The volume was completed to 50.0 mL using the ethanol/water solution (1:4, v/v).
In all cases, the concentrations of MTZ in the prepared samples were 7.2 × 10⁻³ mol L−1 (based on the labeled MTZ
values). In order to perform the measurements in the linear
range of the sensor, 100 µL aliquots of these samples were
added to the measurement cell (10.0 mL) and quantified by the standard additions method. The concentrations of metronidazole expected in the measurement cell were therefore 72 µmol L−1.
Application of the sensor using biological samples
Determination of MTZ in biological samples employed
human serum and urine enriched with 1.98 × 10⁻³ and
7.20 × 10⁻³ mol L−1 of analyte, and then diluted ×10 with
deionized water, without any pretreatment. The samples were added to the measurement cell and quantified by the standard additions method.
Results and Discussion
Nanostructured electrode characterization
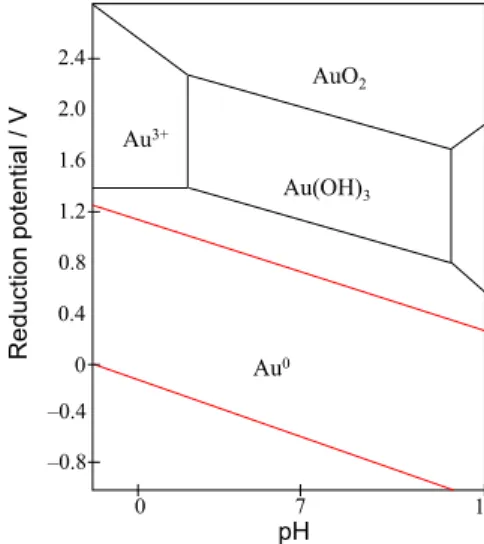
The formation of nanopores on the gold electrode surface can be explained in the following way. Firstly, when the gold electrode was treated by chronoamperometry
(2.0 V for 180 s) in an alkaline medium (0.5 mol L−1
KOH), there was the formation of Au(OH)3/AuO2 species
in equilibrium on its surface, as indicated in the Pourbaix
diagram (Figure 1).39 A subsequent linear cathodic sweep
(from 2.0 to −0.2 V, at 50 mV s−1) in a neutral solution
(phosphate buffer at pH 7.0) resulted in reduction of these oxidized species to form gold metal (Auo), as also indicated
in the Pourbaix diagram (Figure 1). These redox processes on the gold surface caused a change in morphology and the formation of nanopores. There was, therefore, an increase
in the active area of the electrode surface, which enabled immobilization of greater amounts of catalytic species.
The increased surface areas of the gold electrodes after the treatment were evaluated using cyclic voltammetry (Figure 2). The active areas of untreated (bare) and nanostructured electrodes were estimated using the corresponding cathodic peak areas. These areas correspond to the removal of a monolayer of oxygen on the gold electrode surface, enabling the active area to be calculated using equation 1.40
(1)
where: Q is the total electrical charge; Qdc is the electrical
charge of the capacitive double layer; v is a constant specific
to gold (400 mC cm−2), and corresponds to the active
area of the electrode. The active areas of the two electrodes, calculated from the voltammograms shown in Figure 2, were 0.138 cm2 for the bare gold electrode (geometrical area
0.126 cm2) and 3.205 cm2 for the nanostructuredelectrode. The
difference is evident in Figure 2, where the area of the cyclic voltammogram obtained for the nanostructured electrode is greater than for the untreated electrode. In addition, the nanostructured electrode showed an improvement in electronic transfer, since the difference between the anodic
and cathodic peaks (138 mV vs. Ag|AgCl) was lower than
for the untreated electrode (360 mV vs. Ag|AgCl).
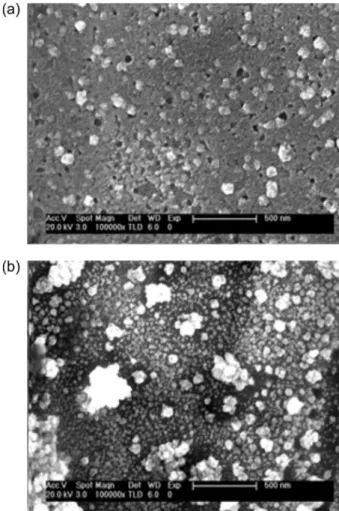
The morphology of the untreated (bare) and nanostructured electrodes was evaluated by SEM (Figure 3) and AFM (Figure 4). These analyzes clearly showed the formation of nanostructures on the electrode surface after treatment, in agreement with the cyclic voltammetry results. It is evident in Figure 3b that the nanoparticles
size is markedly different and can be explained due to the gold used in the SPE electrodes is polycrystalline. However, to obtain more homogeneous nanostructures, monocrystalline gold electrodes could be used (which can become expensive sensor) or using polycrystalline gold electrodes with preferential orientation in a single plane being this alternative economically more viable.
All these results indicated that the simple new gold treatment method was able to produce nanostructured electrodes that could be used to immobilize greater quantities of active molecules on their surfaces.
Modification of the nanostructured gold electrode with a cysteine SAM
Cyclic voltammetry experiments conducted from −1.2
to 0 V vs. Ag|AgCl, in 0.5 mol L−1 KOH, were used to
confirm modification of the gold electrode nanostructure with the cysteine SAM. The results clearly revealed the presence of a cathodic peak at −0.7 V (data not shown) that
could be attributed to reductive desorption of the thiol on
Figure 2. Cyclic voltammograms obtained for the untreated (dashed line) and nanostructured (solid line) screen-printed gold electrodes. Measurements carried out at 50 mV s−1 in 1 mol L−1 KOH.
the gold surface, according to equation 2,41 indicating the
presence of cysteine on the electrode surface. This finding was supported by the AFM analysis (Figure 4c), which also demonstrated that the nanoporous electrode had been modified by the amino acid.
Au – SR + e–→ Au + RS– (2)
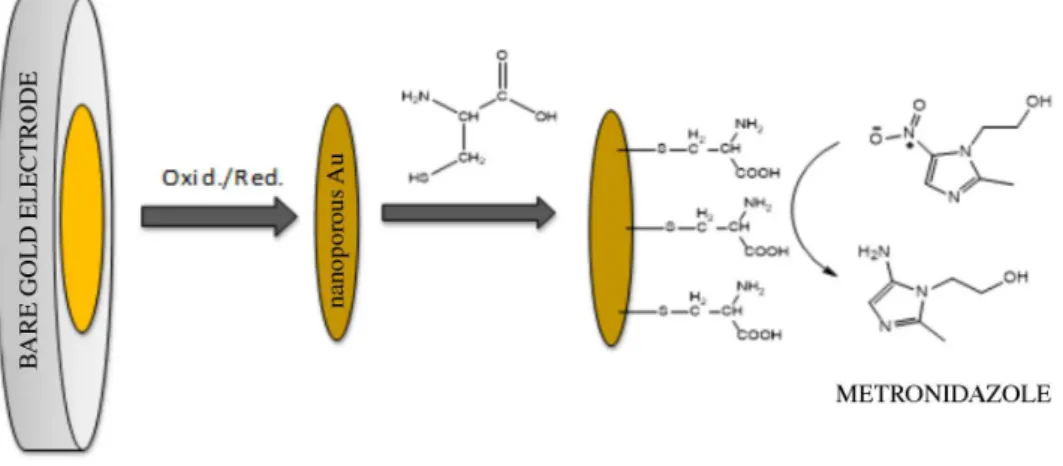
Based on the results obtained, Figure 5 shows a schematic representation of the formation of the SAM on the nanostructured gold electrode.
Characterization of the proposed sensor for nitro-containing compounds
After the construction of the sensor, the suitability of the sensor for use in pharmaceutical and/or environmental analyses was first evaluated by observing its response in
the presence of different compounds containing the –NO2
group in their chemical structure. The study was based on the widely known reduction of –NO2 to –NH2,42-44 according
to the following reactions in an anaerobic medium:
RNO2 + e–→ RNO•2 (3)
RNO2•– + e– + 2H+→ RNO + H
2O (4)
RNO + 2e– + 2H+→ RNHOH (5)
RNHOH + 2e– + 2H+→ RNH
2 + H2O (6)
The sensor response was tested using metronidazole and secnidazole, which belong to the nitroimidazole
family of drugs, as well as o-nitrophenol,
1-chloro-2,4-dinitrobenzene, 4-nitro-o-phenylenediamine, and
2-nitro-p-phenylenediamine, which are potential environmental
contaminants. All the cyclic voltammetry measurements were performed in anaerobic BR buffer solution (at pH 2.0)
containing 2.0 × 10⁻⁴ mol L−1 of each compound. The
Figure 4. Atomic force microscopy images of untreated (a); nanostructured (b); and cysteine-modified nanostructured (c) screen-printed gold electrodes.
voltammograms obtained for all the compounds (Figure 6) showed peaks corresponding to reduction of the nitro
group,45 although the peak profiles and values differed.
For example, in the case of o-nitrophenol, a poorly-defined
reduction peak only appeared at −350 mV vs. Ag|AgCl,
while for secnidazole and metronidazole, well-defined
peaks appeared at −220 mV vs. Ag|AgCl.
The potential application of the proposed sensor for the determination of metronidazole in pharmaceutical formulations was evaluated by considering its selectivity in the presence of other drugs. The compounds tested were lidocaine, diclofenac, and ranitidine, for which no responses were obtained in the same potential window, under the conditions selected for detection of MTZ. In the next step, it was therefore possible to optimize the analytical conditions in order to obtain the best response to MTZ. The reduction of MTZ is pH-dependent (reactions in equations 3-6), so pH was the first parameter considered in optimization of the sensor response.
Figure 7 shows the results obtained using 0.1 mol L−1
BR buffer solution at different pH values between 1.6 and 4.0. It can be seen from Figure 7a that the pH did not influence the magnitude of the current obtained for the MTZ reduction. However, the peak potential shifted to less negative values as the pH decreased (Figure 7b). A pH of 2.0 was therefore selected for use in the subsequent experiments.
In the next step, evaluation was made of the influence of the scan rate (υ)on the cathodic potential peaks and the
corresponding currents. The results of these experiments are shown in Figure 8, where the reduction current is plotted as a function of v1/2. A linear fit was obtained, indicating that the
reduction of MTZ was controlled by a mass transfer process.
Characteristics of the proposed MTZ sensor
Application of the proposed sensor for the determination of MTZ in different samples was investigated using an
Figure 6. Cyclic voltammograms obtained using the proposed sensor in anaerobic BR buffer solution (pH 2.0) containing 2.0 × 10⁻⁴ mol L−1 of
different nitro-containing compounds. Scan rate: 100 mV s−1.
Figure 7. Influence of pH on (a) current and (b) cathodic peak potential values. Measurements carried out at various pH values in 0.1 mol L−1 BR
buffer solutions containing 2.0 × 10⁻⁴ mol L−1 MTZ.
Figure 8. Linear dependence of the cathodic peak current (i) on the square root of the scan rate (υ1/2), for cyclic voltammetry experiments carried out in anaerobic 0.1 mol L−1 BR buffer solution (pH 2.0) containing
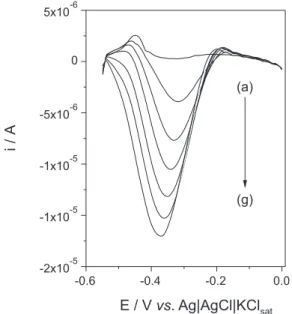
electroanalytical technique that was more sensitive than cyclic voltammetry. Among the techniques evaluated (amperometry, differential pulse voltammetry, and square wave voltammetry), square wave voltammetry (SWV) provided the best results. This technique was therefore optimized prior to its use to analyze the samples containing MTZ. The best SWV response was obtained at pulse amplitude of 100 mV, frequency of 60 Hz, and pulse increment of 10 mV. Typical voltammograms obtained under the optimized conditions are shown in Figure 9. The
response to MTZ was linear in the range 50-300 µmol L−1
(R = 0.9994) and could be described by the equation:
∆i(µA) = 1.7 × 10⁻⁶ (±2.0 × 10⁻⁷) + 6.0 × 10⁻²
(±1.2 × 10⁻³) C
MTZ (7)
The limits of detection (LOD) and quantification (LOQ)
were 2.6 and 8.6 µmol L−1, respectively, calculated as
recommended by the National Health Surveillance Agency
(ANVISA).46
The proposed sensor shows characteristics similar to other sensors described in literature, with the advantages of more simple preparation and possibility of miniaturization and mass construction.
Application of the proposed MTZ sensor
The results obtained for the application of the sensor in the analysis of different pharmaceutical formulations
are shown in Table 2. The response of the sensor in the presence of possible interferents was tested previously, and no effect on the MTZ signal was observed for substances including starch, mannitol, microcrystalline cellulose, povidone, magnesium stearate, cellulose acetate phthalate, talc, calcium carbonate, polyethylene glycol, and carbopol, which are used as excipients in commercial formulations.
Note that, in the case of suspension, the low recovery value is not due to the matrix effect, since the sample was pretreated as described in the experimental part, but due to the active ingredient of this drug is benzoylmetronidazole and not the analyte evaluated here (MTZ) for this proposed sensor.
The application of the sensor in the analysis of biological samples was tested by spiking urine and serum samples with MTZ. Excellent recovery values were achieved in both cases (Table 3). Possible interference from uric acid, urea, and ascorbic acid were evaluated, and no responses were observed for these compounds. However, in order to apply the sensor in the analysis of serum samples, and to avoid the effects of other potential interferents present in biological samples, the quantification of MTZ was carried out using the standard additions method. The results of these experiments confirmed the viability of the sensor for use with samples of clinical and pharmaceutical interest.
Conclusions
This work presents a simple and novel method to obtain nanopores on the surface of gold electrodes. The presence
Table 2. Results obtained using the proposed sensor for analysis of pharmaceutical formulations containing metronidazole
Formulation
Values obtained
Nominal Found Found/nominal / %
Tablet / (mg tablet−1) 250 245.3 98.1 ± 1.5
Drug suspension / (mg mL−1) 40a 12.3 30.8 ± 0.1
Lotion / (mg g−1) 100 99.4 99.4 ± 2.3
aAs benzoylmetronidazol.
Table 3. Recovery values obtained using the proposed sensor in the analysis of biological samples
Sample CMetronidazole / (mol L −1)
Recovery / % Added Found
Urine 7.20 × 10⁻³ 6.72 × 10⁻³ 93.4 ± 0.8
Serum 1.98 × 10⁻³ 1.73 × 10⁻³ 89.3 ± 2.1
Figure 9. Response profile for MTZ obtained using SWV under optimized conditions. Measurements carried out in 0.1 mol L−1 BR buffer (pH 2.0),
with f = 60 Hz, a = 100 mV, and ∆E = 10 mV. (a) 0.1 mol L−1 BR buffer
alone; (b) 50 µmol L−1 MTZ; (c) 101 µmol L−1 MTZ; (d) 151 µmol L−1 MTZ;
of the nanopores was confirmed using SEM, AFM, and cyclic voltammetry analyses. The procedure resulted in a higher surface area with a greater number of active sites available for immobilization of the amino acid cysteine, producing a sensor based on a self-assembled monolayer (SAM). This sensor is sensitive to molecules containing the nitro group in their structures. Metronidazole was chosen as a model drug, due to its clinical importance, and could be satisfactorily quantified in pharmaceutical formulations and biological samples.
Acknowledgements
The authors gratefully acknowledge financial support from FAPESP (Proc. 2008/10449-7).
References
1. Saavedra, H. M.; Thompson, C. M.; Hohman, J. N.; Crespi, V. H.; Weiss, P.; J. Am. Chem. Soc. 2009, 131, 2252.
2. Asadi, K.; Wu, Y.; Gholamrezaie, F.; Rudolf, P.; Bolm, P. W. M.;
Adv. Mater. 2009, 21, 1.
3. Chesneau, F.; Zhao, J.; Shen, C.; Buck, M.; Zharnikov, M.;
J. Phys. Chem. C 2010, 114, 7112.
4. Kang, H.; Lee, N. S.; Ito, E.; Hara, M.; Noh, J.; Langmuir 2010,
114, 2983.
5. Kao, F.; Neppl, S.; Feulner, P.; Allara, D. L.; Zharnikov, M.;
J. Phys. Chem. C 2010, 114, 13773. 6. Seo, K.; Lee, Y.; ACS Nano 2009, 3, 2469.
7. Alarcon, L. S.; Chen, L.; Esaulov, V. A.; Gayone, J. E.; Sanchez, E. A.; Grizzi, E. A.; J.Phys. Chem. C 2010, 114, 19993. 8. Hamoudi, H.; Proto, M.; Dablemont, C.; Cavalleri, O.;
Canepa, M.; Esaulov, V. A.; Langmuir 2010, 26, 7242. 9. Azzam, W.; Bashir, A.; Terfort, A.; Strunskus, T.; Wöll, Ch.;
Langmuir 2006, 22, 3647.
10. Choi, Y.; Jeong, Y.; Chung, H.; Ito, E.; Hara, M.; Noh, J.;
Langmuir 2008, 24, 91.
11. Noh, J.; Jeong, Y.; Ito, E.; Hara, M.; J. Phys. Chem. C 2007,
111, 2691.
12. Noh, J.; Kato, H. S.; Kawai, M.; Hara, M.; J. Phys. Chem. B
2002, 106, 13268.
13. Choi, I.; Kang, H.; Lee, D.; Noh, J.; Bull. Korean Chem. Soc.
2012, 33, 381.
14. Park, T.; Kang, H.; Kim, Y.; Lee, S.; Noh, J.; Bull. Korean Chem. Soc. 2011, 32, 39.
15. McGuire, A.; Jewell, A. D.; Lawton, T. J.; Murphy, C. J.; Lewis, E. A.; Sykes, E. C. H.; J. Phys. Chem. C 2012, 116, 14992. 16. Bellisario, D. O.; Jewell, A. D.; Tierney, H. L.; Baber, A. E.;
Sykes, E. C. H.; J. Phys. Chem. C 2010, 114, 14583. 17. Ruan, C.; Yang, F.; Lei, C.; Deng, D.; Anal. Chem. 1998, 70,
1721.
18. Ganesh, V.; Pal, S. K.; Kumar, S.; Lakshminarayanan, V. J.;
Colloid Interface Sci. 2006, 296, 195.
19. Shin, H. C.; Dong, J.; Liu, M. L.; Adv. Mater.2003, 15, 1610.
20. Luo, H. M.; Sun, L.; Lu, Y. F.; Yan, Y. S.; Langmuir 2004, 20, 10218.
21. Zhang, H.; Hussain, I.; Brust, M.; Cooper, A. I.; AAdv. Mater.
2004, 16, 27.
22. Walsh, D.; Arcelli, L.; Ikoma, T.; Mann, J. T.; Nat. Mater. 2003,
2, 386.
23. Shchukin, D. G.; Caruso, R. A.; Chem. Commun. 2003, 1478. 24. Zhang, H.; Hussain, I.; Brust, M.; Butler, M. F.; Rannard, S. P.;
Cooper, A. I.; Nat. Mater. 2005, 4, 787.
25. Weissmuller, J.; Viswanath, R. N.; Kramer, D.; Zimmer, P.; Wurschum, R.; Gleiter, H.; Science 2003, 300, 312.
26. Edwards, D. I.; Prog. Med. Chem. 1981, 18, 87.
27. Bone, W.; Jones, N.; Kamp, G.; Yeung, C.; Cooper, T.; J. Reprod. Fertil. 2000, 118, 127.
28. Menéndez, D.; Rojas, E.; Herrera, L.; Lopez, M.; Sordo, M.; Elizondo, G.; Ostrosky-Wegman, P.; Mutat. Res. 2001, 478, 153.
29. Hrelia, P.; Fimognari, C.; Maffei, F.; Brighenti, B.; Garuti, L.; Burnelli, S.; Cantelli, G.; Mutat. Res. 1998, 397, 293. 30. Trinh, S.; Reisset, G.; Mutat. Res. 1998, 398, 55.
31. Nejati, K.; Asadpour-Zeynali, K.; Mater. Sci. Eng., C 2014, 35, 179.
32. Mollamahale, Y. B.; Ghorbani, M.; Ghalkhani, M.; Vossoughi, M.; Dolati, A.; Electrochim. Acta 2013, 106, 288. 33. Chen, D.; Deng, J.; Liang, J.; Xie, J.; Hu, C.; Huang, K.; Sens.
Actuators, B 2013, 183, 594.
34. Peng, J.; Hou, C.; Hu, X.; Sens. Actuators, B 2012, 169, 81. 35. Liu, W.; Zhang, J.; Li, C.; Tang, L.; Zhang, Z.; Yang, M.; Talanta
2013, 104, 204.
36. Gholivand, M. B.; Torkashvand, M.; Talanta 2011, 84, 905. 37. Bartlett, P. N.; Ghoneim, E.; El-Hefnawy, G.; El-Hallag, I.;
Talanta 2005, 66, 869.
38. The British Pharmacopoeia, 3rd ed.; London, UK, 2007.
39. Van Muylder, J.; Pourbaix, M.; Atlas of Electrochemical Equilibria in Aqueous Solutions, 2nd English ed.; Marcel
Pourbaix, National Association of Corrosion Engineers: New York, 1974.
40. Bard, J. A; Faulkner, L. R.; Electrochemical Methods Fundamentals and Applications, 2nd ed.; Dallas, 2001.
41. Arihara, K.; Ariga, T.; Takashima, N.; Arihara, K.; Okajima, T.; Kitamura, F.; Tokuda, K.; Ohsaka, T.; Phys. Chem. Chem. Phys.
2003, 5, 3758.
42. Bone, W.; Jones, N.; Kamp, G.; Yeung, C.; Cooper, T.; J. Reprod. Fertil. 2000, 118, 127.
43. Viodé, C.; Battache, N.; Cenas, N.; Krauth-Siegel, L.; Chauviere, G.; Bakalara, N.; Perie, J.; Biochem. Pharmacol.
44. Mason, R. P.; Holtzman, J. L.; Biochemistry 1975, 14, 1626. 45. Shaofang, L.; Kangbing, W.; Xueping, D.; Shengshui, H.;
Talanta 2004, 63, 653.
46. Agência Nacional de Vigilância Sanitária (ANVISA), Resolução 899 de 29 de maio de 2003, Guia para Validação de Métodos Analíticos e Bioanalíticos, Brasília, Brasil, 2003. http://portal. anvisa.gov.br/wps/wcm/connect/4983b0004745975da005f43 fbc4c6735/RE_899_2003_Determina+a+publica%C3%A7%
C3%A3o+do+Guia+para+valida%C3%A7%C3%A3o+de+m %C3%A9todos+anal%C3%ADticos+e+bioanal%C3%ADtic os.pdf?MOD=AJPERES. Accessed in July 2014.
Submitted on: May 15, 2014 Published online: July 25, 2014