Regulation of Ion Gradients across Myocardial Ischemic
Border Zones: A Biophysical Modelling Analysis
Steven Niederer*
Biomedical Engineering, King’s College London, London, United Kingdom
Abstract
The myocardial ischemic border zone is associated with the initiation and sustenance of arrhythmias. The profile of ionic concentrations across the border zone play a significant role in determining cellular electrophysiology and conductivity, yet their spatial-temporal evolution and regulation are not well understood. To investigate the changes in ion concentrations that regulate cellular electrophysiology, a mathematical model of ion movement in the intra and extracellular space in the presence of ionic, potential and material property heterogeneities was developed. The model simulates the spatial and temporal evolution of concentrations of potassium, sodium, chloride, calcium, hydrogen and bicarbonate ions and carbon dioxide across an ischemic border zone. Ischemia was simulated by sodium-potassium pump inhibition, potassium channel activation and respiratory and metabolic acidosis. The model predicted significant disparities in the width of the border zone for each ionic species, with intracellular sodium and extracellular potassium having discordant gradients, facilitating multiple gradients in cellular properties across the border zone. Extracellular potassium was found to have the largest border zone and this was attributed to the voltage dependence of the potassium channels. The model also predicted the efflux ofKz
from the ischemic region due to electrogenic drift and diffusion within the intra and extracellular space, respectively, which contributed toKz
depletion in the ischemic region.
Citation:Niederer S (2013) Regulation of Ion Gradients across Myocardial Ischemic Border Zones: A Biophysical Modelling Analysis. PLoS ONE 8(4): e60323. doi:10.1371/journal.pone.0060323
Editor:Vladimir E. Bondarenko, Georgia State University, United States of America
ReceivedNovember 5, 2012;AcceptedFebruary 24, 2013;PublishedApril 5, 2013
Copyright:ß2013 Steven Niederer. This is an open-access article distributed under the terms of the Creative Commons Attribution License, which permits unrestricted use, distribution, and reproduction in any medium, provided the original author and source are credited.
Funding:The work was supported by UK Engineering and Physical Sciences Research Council EP/F043929/1, British Heart Foundation (PG/11/101/29212) and Boston Scientific. The funders had no role in study design, data collection and analysis, decision to publish, or preparation of the manuscript.
Competing Interests:The author has the following interests. This study was partly funded by Boston Scientific. There are no patents, products in development or marketed products to declare. This does not alter the author’s adherence to all the PLOS ONE policies on sharing data and materials, as detailed online in the guide for authors.
* E-mail: [email protected]
Introduction
Myocardial ischemia is caused by reduced perfusion to regions of the heart leading to a localised reduction in supply of metabolites, limited waste removal and compromised ionic homeostasis. The first 10 minutes of ischemia are associated with an increased risk of arrhythmias peaking after 5–6 minutes [1]. During this period arrhythmias are commonly initiated within the border zone (BZ) separating viable, well perfused, tissue and the ischemic, underperfused, region [2–4]. Ischemia causes an increase in extracellular potassium (½Kz
e), intra and extracellular proton concentrations (½Hz
i and ½H z
e, respectively), intracel-lular sodium (½Naz
i) and intracellular calcium (½Ca
2z
i) concen-trations [5]. The dominant mechanisms for these changes have been attributed to a shift in the ATP/ADP ratio, which inhibits the Sodium-Potassium ATPase pump (NaK) and increases the conductance of ATP-inactivatedKz
channels; respiratory acidosis causing an increase inCO2; and metabolic acidosis, where a shift
towards anaerobic respiration increases the production ofHz in the cell [5]. Inherently, these changes in ionic concentrations in the ischemic region lead to gradients in properties across the BZ, creating electrophysiological heterogeneities that are thought to favour the occurrence of arrhythmias [6–8].
Experimentally, the development of gradients of extracellular pH (pHe) and½Kze[9,10] have been well characterised using ion sensitive electrodes. Intracellular metabolite gradients have been
characterised by fluorescent NADH [11] and biopsy [12] measurements. However, less is known on the gradients of intracellular ions, in particular½Naz
i, ½Ca2 z
i and ½H z
i, nor are the mechanisms that underpin the spatial and temporal evolution of these ion concentration gradients well characterised or understood. This study aims to investigate the spatial-temporal evolution of ion gradients across ischemic BZ and the primary regulators of the BZ size and rate of development.
Previous measurements of ion concentrations and metabolites across the BZ have either been performed at multiple locations but at a limited number of time points [10,12] or have tracked the time evolution of ion concentrations but only from a limited number of locations [13,14]. Furthermore, these measurements have only been able to characterise a subset of ions of interest across the BZ. The need to track the evolution of multiple ionic species in space and time to understand the gradients of cellular electrophysiology across the BZ motivates the use of biophysical computational modelling. Previous models of electrophysiology during acute regional ischemia have simulated the effects of these spatial gradients but have not simulated their time evolution [15– 17]. More recent work has simulated the time evolution of½Kz
e gradients [18], but have not considered other ionic gradients, the effects of nonlinear interactions betweenKz
and other ions, the effect ofKz
In this study a new model of cardiac tissue electrophysiology is developed to investigate the spatial-temporal evolution of ionic concentrations across the ischemic BZ, during the first 5 minutes of reduced perfusion. The proposed model extends the conven-tional bidomain equations to explicitly link membrane potential to ionic concentrations and enforces ionic species conservation. A model of ion regulation across the cell membrane is then developed, parameterized, validated and coupled to the tissue model. This combined model is then used to investigate the spatial and temporal dispersion of ions across the BZ.
Methods
To model the evolution of ionic concentrations in the presence of multiple ionic gradients, electric gradients and heterogeneous tissue properties requires the development of a new set of equations for modelling the myocardium. In the next section the equations to model the BZ are derived and a model of passive cell membrane ion regulation is developed and validated. The changes to the cell membrane model to simulate NaK inhibition, Kz channel activation, respiratory acidosis and metabolic acidosis are then described.
Tissue Model Derivation
Consistent with previous models of cardiac tissue electrophys-iology the myocardium is represented as a two phase medium, with each point in the domain containing a fraction of intra and extracellular space. This gives rise to the scaling variables.
ax~Vx
V x~
C
V ð1Þ
whereVxis the volume of thexspace in a unit ofVmyocardium volume,axis the volume fraction of spacex(withxcorresponding to the extra (e) or intra (i) cellular space),xis the interspace surface area per unit volume myocardium andCis area of the interspace surface. The intracellular volume fraction (ai) can be separated into sub volume fractions representing the cytosol (acyt), mito-chondria (amito) or the sarcoplasmic reticulum (aSR) to model distinct subcellular spaces, as described below. At each point in space there exists an intracellular potential (wi), an extracellular potential (we), a transmembrane potential (Vm) and an intra and extracellular ion concentration for each of the ion species in the model. The movement of each ion species in each domain is driven by diffusion, due to a gradient in ion concentration, and drift, due to a gradient in the electric field. This movement is described by the Nernst-Plank equations
LCj x
Lt ~+:D
j x +Cxjz
zjF
RTC
j x+wx
ð2Þ
whereCxjis the concentration of unbound ionjin spacex,zjis the charge of ionj,Djxis the effective diffusion of ionjin spacex,Fis Faraday’s constant, R is the gas constant, T is the absolute temperature and wx is the potential in the space x. The conventional Nernst-Plank equations are adapted to represent the movement of ions across the cell membrane between the intra and extracellular spaces. This gives
LCj x
Lt ~+:D
j
x +Cxjz
zjF
RTC
j x+wx
zxJ
j m
ax ð
3Þ
where Jj
m is the flux of ion j across the cell membrane. Jmj is
defined in units of mM ms{1mm. The surface separating the two
regions is modelled as a simple capacitor and defining the transmembrane potential to scale with intracellular charge gives
Vm~
Qi
Cm ð
4Þ
whereQiis the intracellular charge per unit cell membrane area and Cm is the membrane capacitance per unit cell membrane area. The charge on either side of the membrane is assumed to be equal but opposite, giving
Qi~{Qe ð5Þ
Separating the concentration of each ion species in the intra and extracellular space into ions that are membrane bound and make up the membrane charge (Qjx) and those that are in solution gives.
Cjx~CjxsolzCxQj ð6Þ
where Cxsolj and CxQj are the ions in solution and membrane bound ions, respectively. By assuming charge neutrality for the ions within the solute gives:
FXzjCj
xsol~0 ð7Þ
Multiplying Eqn 6 by the ion species charge and Faraday’s constant, then summing over all ion species in spacexgives.
FXzjCj x~F
X zjCj
xQ ð8Þ
Converting the concentration of ions per unit volume in domain
xto charge per unit cell membrane area and introducing a static charge term (gx) that characterises all charge not attributable to
Cxj, gives
Qj x~
ax xF
X zjCj
xQzgx ð9Þ
Combining with Eqn 8 gives
Qjx~ ax
xF X
zjCjxzgx ð10Þ
This defines the charge on the membrane as equal to the unbalanced charge in spacex. Using the charge balance Eqn 5, gives
ai X
zjCjizae X
zjCejzgizge~0 ð11Þ
ai X
zj+:Dji +C j iz
zjF
RTC
j i+wi
z
ae X
zj+:Dj e +Cejz
zjF
RTC
j e+we
~0
ð12Þ
this ensures that there is no net charge accumulation in any unit volume of myocardium. Defining the relationship between the intra and extracellular potentials gives
Vm~wi{we ð13Þ
Using Eqn 4 and the definition of charge (Eqn 10), then gives the algebraic definition of the transmembrane potential:
Vm~
F Cmx
ai X
zjCijzgi
ð14Þ
Rearranging Eqn 13 and substituting in the definition ofVm from Eqn 14 allows wi to be defined in terms of we and Cxj. Combining this definition ofwiwith Eqns 14, 13, 12, 3 and 2 then represents a closed set of equations. These equations are equivalent to the bidomain equations in the case of a single charge carrier and no gradient in ion concentrations, as shown below.
In cardiac myocytes many important ions, includingHz and
Ca2z
are heavily buffered, both within the cell and the extracellular space. To account for buffering the free and buffer bound fraction ofCjxare calculated. In general, asC
j
xsolwwC j xQ the effect of ions bound to the cell membrane will not be included in the buffering equations for simplicity. This gives
Cj x&C
j xsol~C
j xfreezC
j
xbuff ð15Þ
whereCxfreej are the unbound ions andCxbuffj are the ions bound to buffers. At this time all buffers will be treated as rapid and to a single representative buffer species, giving
Cjx~C j xfreezB
j x
Cxfreej njx
Cxfreej njxzKj xn
j x
ð16Þ
whereBjx,Kxj andnjx are the concentration, binding affinity and Hill coefficient, respectively, for the buffer of ion j in space x. Assuming that ions bound to buffers are immobile, onlyCxfreej is used to calculate the diffusion and drift of ions in Eqn 3, and similarly in Eqn 12. As binding of ions to a buffer implicitly removes a charged binding site located on a static protein, Eqn 14 remains unchanged.
Due to the complex anatomy of the cardiac myocyte many sub volumes exist within the cell that affect ionic concentrations. The sum of the volume fraction (ax) values must be less than, but do not have to be equal to, one, allowing the model to represent any volume fractions that are not directly accessible by ions. In particular theaivariable can represent all space in the cell or can be substituted for acyt representing the volume fraction of the cytosol (a sub volume of ai). This allows the effects of SR,
mitochondrial or other subcellular structure volumes on intracel-lular ionic concentrations to be accounted for in the model.
Equation summary. The modelled equations are given by
Vm~
F Cmx
ai X
zjCijzgi
ð17Þ
wi~Vmzwe
Cxj~C j xfreezB
j x
Cjxfreenjx
CjxfreenjxzKj xn
j x
LCj
i
Lt ~+:Dj
i +C j ifreez
zjF
RTC
j ifree+wi
{xJ
j m ai
LCj e
Lt ~+:Dj
e +C j efreez
zjF
RTC
j efree+we
zxJ
j m ae
0~ai X
zj+:Dj i +C
j ifreez
zjF
RTC
j ifree+wi
zaeXzj+:Dje +C j efreez
zjF
RTC
j efree+we
where it is important to note that for non buffered ionsBjx~0and
Cxj~Cxfreej .
Consistency with bidomain equations. Imposing the
implicit assumptions of the bidomain equations that charge carriers are not buffered, ion concentrations are homogenous and charge is carried by a single carrier to Eqn 18, the bidomain equations can be derived. Assuming homogenous ion concentra-tions and considering the case of the intracellular space reduces Eqn 18 to
LCij Lt ~+:D
j x
zjF
RTC
j i+wi{
xJj m
ai ð
18Þ
Differentiating Eqn 14 for the intracellular space gives
LVm
Lt ~
F Cmx
ai X
zjLC
j i
Lt !
ð19Þ
substituting Eqn 18 into Eqn 19 gives
LVm
Lt ~
F Cmx
ai X
zj +:Dj x
zjF
RTC
j i+wi{
xJj m ai
ð20Þ
sx~ X
Dj x
zj2F2a
xCxj
RT ð21Þ
Then Eqn 20 reduces to
Cmx
LVm Lt
~+:si+wi{FXzjJj
m ð22Þ
Applying the single charge carrier assumption and converting from ionic flux to current gives the first bidomain equation
x Cm
LVm Lt zIion
~+:si+wi ð23Þ
The second bidomain equation is readily derived from applying the homogenous ion concentration assumption to Eqn 12 and multiplying by Faraday’s constant (to convert from conserving ion flux to current) giving
+:X
Djiz
j2F2a
iCij
RT +wiz+: X
Djez
j2F2a
eCej
RT +we~0 ð24Þ
Substituting in the definition of conductivity from Eqn 21 then gives the second bidomain equation
+:si+wiz+:se+we~0 ð25Þ
Modelling the Membrane Fluxes
Cardiac electrophysiology is predominantly determined by the movement of Ca2z
, Naz
and Kz
. For charge neutrality Cl{ must also be included in the model. To simulate the evolution of acidosis requires the inclusion of Hz
, HCO{
3 and CO2 in the
model. All of these ions (andCO2) were modelled in the intra and
extracellular space, withHz
andCa2z
being buffered. The goal of the model, in this study, was not to track the propagation of the action potential but to simulate the gradients of ions that exist over the BZ. These ion gradients were modelled based on the diastolic properties of the cell. This assumption was also a requirement to enable the simulation of minutes, while remaining computationally tractable.
The membrane ion transport pathways are described first for
Naz , Hz
andHCO{
3. Ion specific channels are then described
that balance the flux of each ion species. The channel and transporter densities were determined by imposing zero net flux for each ion species, using the relative densities ofNaz
andHz transporters recorded experimentally, and intra and extracellular ionic concentrations and membrane potential values derived from the literature. Where possible experimental data was taken preferentially from rabbit or guinea pig data at body temperature. This limited number of constraints then allowed the model transporters and channel densities to be uniquely determined.
Sodium regulation. The model ofNaz
regulation included representations of theNaK, sodium calcium exchanger (NCX), sodium hydrogen exchanger (NHE), sodium bicarbonate co-transporter (NBC) and a lumped sodium channel (INa).NaKwas
modelled using the thermodynamically consistent equation set proposed by Smith and Crampin [19]. This model was subsequently revised by Terkildsen et al., [20] and this parameter set that was used here. The model forNaKwas fitted to guinea pig data as limited rabbit data was available. However, the maximum flux was rescaled to match rabbit data, as described below.
TheNCXmodel was taken from Weber et al., [21]. The model has been fitted to rabbit experimental data at 37uC. TheNHE
model was based on the model developed by Crampin and Smith [22] and reparameterized by Niederer and Smith [23]. In this study extracellular Naz
and Hz
regulation of NHE were included. This model was fitted predominantly to sheep Purkinje data [24], although the Hz
dependence of NHE remains relatively consistent between species [25]. TheNBC model was taken from Crampin and Smith [22]. The model assumesNBCis electro neutral, which is true for only part of theNBCpopulation [25]. There was not sufficient data to fully characterise the electrogenic and electro neutral forms ofNBC, hence the electro neutral model was used. Background Naz
flux across residual open fastNaz
and persistentNaz
channels is limited when the cell is quiescent. However, some flux is still present [26] and a simple lumped background ionic flux equation was used, given by
JNa~gNaðVm{ENaÞ ð26Þ
to model the residualNaz
flux across any openNaz
channels. The same equation form was used for modelling all background ion channels.
Proton regulation. In the proposed model ½Hz
i was regulated byNHE, described above, chloride-hydroxide exchang-er (CHE), hydrolysis and buffering. BackgroundHz
leak or other
Hz
exchangers were not considered in the general model ofHz regulation, described here, but do include models ofHz
-lactate exchange and intracellular metabolism derivedHz
sources in the model of ischemia, described below. TheCHEmodel comes from Niederer et al., [27] and was fitted to guinea pig data at 37oC. The hydrolysis ofCO2intoHCO{3 andH
z
was governed by
JHyd~kf½CO2{kr½Hz½HCO{3 ð27Þ
wherekf andkr are the forward and reverse rates of hydrolysis. Hydrolysis occurs in both the intra and extracellular space and the rate constants were assumed to be the same in both domains.Hz buffering in the intra and extracellular space is due to mobile and staticHz
buffers and HCO{
3 [28]. The intra and extracellular
buffering of Hz
were assumed to be instantaneous and represented by a single population of buffers. To reduce the model size, partial differential equations were only solved for the total concentration of½Hz
ior½H z
e. The concentration of free ions were then calculated by
½Hz
free~
{KH{BHz½Hztotalz
ffiffiffiffiffiffiffiffiffiffiffiffiffiffiffiffiffiffiffiffiffiffiffiffiffiffiffiffiffiffiffiffiffiffiffiffiffiffiffiffiffiffiffiffiffiffiffiffiffiffiffiffiffiffiffiffiffiffiffiffiffiffiffiffiffiffiffiffiffiffiffiffiffiffiffiffiffiffi (KHzBH{½Hztotal)
2{4
½Hz
totalKH
q
2
ð28Þ
whereBH andKH represent the concentration of the buffer and the binding affinity, respectively. This buffer model was used for both intra and extracellularHz
, with a separate set of parameters for each ion.
Calcium regulation. A simplified model of intracellular
cardiac Ca2z
intracellular space reaches an approximate equilibrium over the time scales of interest. Furthermore, SERCA ATPase function was modelled with a Hill coefficient of one as opposed to two, to allow the definition ofCa2z
to remain deterministic. The intracellular space was assumed to consist of a sarcoplasmic reticulum (SR) and a cytosolic space. The subsarcolemmal and dyadic space are small and are also likely to be in equilibrium with the cytosolicCa2z
, so were not included in the model. The Ca2z
dynamics were described by
d½Ca2z
i
dt ~{JSERCAzJleakzðICaLzICab{INCXÞ Am
FzCa ð
29Þ
d½Ca2z
SR
dt ~ðJSERCA{JleakÞ
aSR
acyt ð
30Þ
JSERCA~VSERCA ½
Ca2z
nHi ½Ca2znH
i zKSERCAnH
ð31Þ
Jleak~Pleak ½Ca2zSR{½Ca2 z
i
ð32Þ
ICa~ICaLzICab~gCaðVm{ECaÞ ð33Þ
where½Ca2z
SRis the SRCa2 z
,Jleakis the flux of calcium out of the SR,JSERCAis the uptake ofCa2z by SERCA,VSERCAis the maximum SERCA flux,Pleak is the diffusion permeability of the SR membrane, KSERCA is the binding coefficient of Ca2z to SERCA, aSR and acyt are the volume fractions of the SR and cytosol, respectively,ICaLis the L-type calcium channel andICabis the backgroundCa2z
channel. In this model the background and L-typeCa2z
channels were modelled as a single lumped generic
Ca2z
channel. Introducing cytosolic buffering, ignoring the effects of SR buffering and setting nH as one and assuming that the cytosol and the SR are in equilibrium then gives
½Ca2z
SR~½Ca2 z
iz
VSERCA
Pleak
½Ca2z
i ½Ca2z
izKSERCA ð
34Þ
½Ca2z
tot~½Ca2 z
iz aSR acyt½
Ca2z
SRzBCa ½
Ca2z
i ½Ca2z
izKCa
~½Ca2z
i 1z aSR acyt
zaSR
acyt
VSERCA
Pleak
½Ca2z
i ½Ca2z
izKSERCA
zBCa ½
Ca2z
i ½Ca2z
izKCa
defining
BSERCA~ aSR acyt
VSERCA
Pleak ð
35Þ
cCa~1z aSR
acyt ð
36Þ
and collecting terms gives
A~cCaKSERCAzcCaKbuffzBbuffzBSERCA{½Ca 2z
tot
cCa ð
37Þ
B~
cCaKbuffKSERCAzBbuffKSERCAzBSERCAKbuff{½Ca2z
tot(KSERCAzKbuff) cCa
ð38Þ
C~{½Ca 2z
totKbuffKSERCA
cCa ð
39Þ
0~½Ca2z
3izA½Ca2 z
2izB½Ca2 z
izC ð40Þ
AsCis always negative the cubic always has at least one positive real root for possible values of½Ca2z
tot. The value of½Ca2 z
tot was then found using the root finding method first proposed by Francois Viete in 1600 and reused more recently by Faber and Rudy [29]:
½Ca2z
i~
2pffiffiffiffiffiffiffiffiffiffiffiffiffiffiffiffiA2{3B 3 cos
arccos 9AB{2A 3{27C
2(A2{3B)1:5
3 0
B B B @
1
C C C A
{A 3
ð41Þ
The model of Ca2z
dynamics assumes that all Ca2z buffers were static and that the transport of ions via mobile buffers was accounted for in the effective diffusion parameters of freeCa2z
. It is possible to extend the proposed model to include mobile buffers but they were assumed to play a secondary role in the current model.½Ca2z
ewas assumed to be buffered by a single species and was modelled using the same framework described above forHz (Eqn 28).
Chloride regulation. In this model Cl{
homeostasis was maintained by theCHE and the Cl{
-HCO{
3 exchanger (AE),
which bringCl{
into the cell, and aCl{
channel that allowsCl{ to flow out of the cell. TheCHEmodel is described above. The
AE model was taken from Crampin and Smith [22] and was developed using guinea pig data at 37oC. TheCl{
channel uses the conventional background channel formulation. A linearHz dependence of the background Cl{
current was added to the model based on observations from Komukai et al., [30].
Potassium regulation. In dynamic action potential models
of cardiac electrophysiology there are a large number of Kz channels [31] that bringKz
into the cell. This influx was balanced by theNaK pump, described above, that extrudes Kz
. For the passive membrane model, all of the Kz
channels were lumped into a single background current (IKb) formulation that was set to balance the flux of Kz
on NaK. It was assumed that the
membrane potential andKz
reversal potential are the dominant factors affecting this channel and other forms of regulation have not been considered.
Bicarbonate regulation. HCO{
3 was assumed to be
regu-lated principally by hydrolysis and throughNBCandAE. All of these components have been described above and it was assumed that there are no otherHCO{
3 pathways across the membrane.
Carbon Dioxide. CO2 is regulated primarily through
hydrolysis and can diffuse relatively freely across the membrane. The model of hydrolysis is described above andCO2diffusion was
assumed to obey Fick’s law.
Model Parameters
For each transmembrane ion pathway described above, all kinetic, binding affinity and membrane potential dependencies were taken from the original models. Here the definition of geometrical parameters, ionic concentrations, buffering parame-ters and the density/scaling of each transmembrane pathway are motivated from data in the literature.
Geometrical parameters. The extracellular space is
esti-mated to be between 17{30% [32–35], 17:7+0:6% and
24:6+0:6% [33,36] of the volume of the heart in rabbit, cat, and rat hearts, respectively. This gave anaevalue of0:2leading to anaivalue of0:8. The surface to volume ratio of a cell is reported as 0:31{0:35m m{1 [37,38] in rat and rabbit myocytes,
corresponding to axvalue of264mm{1
. The relative SR volume was set to3%of intracellular volume, giving anaSRvalue of0:024, based on reported values of1:4{3:5%of cell volume [37,39,40] in mouse, rat and swine. The relative mitochondrial volume (amito) was set to0:24based on an estimated mitochondrial cell volume fraction of 30%[37,40]. The cytosol volume fraction was set to
67%of the intracellular space, resulting in anacytvalue of0:536. To account for the effects of subscellular domains on intracellular ionic concentrations in the model, all references toaiin Eqn 18 were replaced by acyt. A summary of geometrical parameters is given in Table 1.
Intracellular ionic concentrations. ½Naz
i has been mea-sured using SBF1 fluorescence and Naz
sensitive electrodes. A significant range of values have been reported from 2{10mM [26,41–44] to 20{30mM [34,45,46]. Early measurements of intracellular ionic concentrations were performed using ion sensitive electrodes. These experiments measure ion activity and not ionic concentration and are often performed in multi-cellular preparations, confounding measurements. For these reasons
½Naz
i in quiescent myocytes was set to 4mM, consistent with recent calibrated fluorescent measurements in isolated rabbit myocytes [26,44].
No fluorescence dye is routinely used for measuring ½Kz
i. Using ion sensitive electrodes Lee et al., [45] were able to calibrate
their measurements of ion activity in rabbit myocytes using an estimated Kz
activity coefficient of 0:613, giving a value of
135mM. This compares with a range of147{236mM calculated by applying the Lee et al., Kz
ion activity coefficient to ion activity measurements in rabbit, cat and guinea pig [34,43,47,48]. Alternate measurement using flame emission spectrometry by Powell et al., [49] measured ½Kz
i in rat myocytes, giving a concentration of120:8+1:7mM. Given the lower values of the two calibrated measurements,½Kz
iwas set to135mM. No dye is routinely used for measuringCl{
concentration in cardiac cells, however,½Cl{
ican be measured using ion sensitive electrodes. Cl{
activity has been reported as 14{20 mM [35,48,50,51] in sheep, rabbit and guinea pig heart cells. Estimations of½Cl{
i from total tissueCl {
concentrations have resulted in values of38:9+2:5mM [35] and16:2 mM [34] in rabbit cells and19:4+1:2mmol/g dry wt (or9:7mM using the
0:49mM permmol/g dry wt scaling factor from Bers [52]) in rat. The higher value of 39 mM may be attributed to the higher extracellular space used in these calculations (30%as compared to
20%). Considering the relative convergence of values½Cl{
iwas set to18mM.
Resting free Ca2z
is measured using calibrated fluorescence measurements. These measurements range from44{100nM in rabbit and guinea pig preparations [53–57]. Given this consistency the ½Ca2z
i will be set to 80 nM. SR Ca2 z
concentration is calculated from integrating the current across the cell membrane following the release ofCa2z
from the SR in response to caffeine. These measurements show two populations with high values in rat (73{140mM [58–61]), canine (80mM [62]), rabbit (87–106mM [60,61]) and ferret (76mM [63]), compared to lower measure-ments in guinea pig (17:9{27mM [58,64]). Given that the majority of species have a higher reported concentration, including rabbit, simulations were run with SRCa2z
load set to
100mM. The buffering of Ca2z
can be described by Hill equation(s), mass action equation(s) or a constant buffering power. To compromise between biophysics and complexity, buffering was modelled by a single Hill equation. Hove-Madsen and Bers [65] fittedCa2z
buffering in rabbit myocytes using two Hill curves; however, the lower affinity buffer will not play a significant role at passive diastolic Ca2z
concentrations. For this reason the high affinity site, with cooperativity reduced from 1:27 to unity, was used to modelCa2z
buffering, giving a buffer concentration of 208.98 mM (converted using a scaling factor of 2:43 from Bers [52]) and an affinity of0:42mM. This model ofCa2z
buffering in rabbit is similar to the concentration/affinity values of
162=0:63mM [66], 121=0:65mM [67] and
128{162=0:45{0:53mM [68] values measured in other species.
pHi has been measured using Hz sensitive electrodes and fluorescence dyes. Measurement ofpHiconsistently falls within the range of 7:0{7:25 [57,69–71] in either HEPES or HCO{
3
buffered solutions. In the model pHi was set to 7.1. Hz are heavily buffered in the cytosol by intrinsic buffers and HCO{
3.
Here the buffering ofHz
byHCO{
3 was modelled explicitly and
the intrinsic buffers were assumed to be in rapid equilibrium. Leem et al., [70] measured (and modelled)Hz
buffering by two populations of buffers with binding affinity pK values of6:03and
7:57 and concentrations of84:22mM and 29:38mM. Zanbioni et al., [25] differentiated between mobile and fixed buffers and found that the fixed buffers had a consistent concentration of
50{70mM and binding affinity (pK) value of6:1{6:2across rat, rabbit and guinea pig, while the mobile buffers had a constantb value of approx10. Fitting a single buffering curve to these two Table 1.Geometric variables.
Variable Value
ai 0.8
ae 0.2
x 264 mm{1
acyt 0.536
amito 0.24
aSR 0.024
models over a pH range of 6:5{7:5 gives concentrations of
64{68mM and pK values of 6:45{6:65, which gave a value of
65mM and pK value of6:5for this model.
Extracellular ionic concentrations. The concentration of
the majority of ions in the extracellular space have been measured in canine [46,72], rat [36,73] and cat [74] hearts. These measurements provide a consistent range of ion concentrations forNaz
,Kz
andCl{
, giving½Naz
eas134{159mM,½K z
eas
3:3{5:8mM and½Cl{
e as105{120mM. In the model½Na z
e was set to 140mM, ½Kz
e was set to 4mM, consistent with measurements in guinea pig hearts [75] and rabbit atrium [76] and½Cl{
ewas set to110mM. The½Ca
2z
evalues reported range from 1:03{5:16mM, however, these values do not differentiate between buffered and ionized Ca2z
. The properties of Ca2z buffering in the extracellular space are not well characterised and are generally ignored in previous cardiac cell models. To approximate the buffering properties of extracellularCa2z
using a simple single species steady state mass action model, with no cooperative binding, requires two parameters, the concentration of the buffer and the binding affinity. Assuming the ratio of free
Ca2z
in the extracellular space to bound ions is similar to serum [77] and assuming that the primary buffer of Ca2z
in the extracellular space are phospholipids, then extracellular Ca2z buffering will have a binding affinity of 1:1mM [78], within the range observed across multiple species [79], and a buffer concentration of2:3mM based on a freeCa2z
concentration of
1:2mM and assuming 50%of Ca2z
are bound to buffers [77].
pHe was set to 7:4, to be consistent with the majority of experimental studies [57,69–71] and measurements across a range of species [80]. Limited measurements were available to model
½Hz
ebuffering, however, Yan and Kleber [81] reported 39 mM of buffered Hz
in the extracellular space. By assuming similar binding affinities for the intra and extracellular buffers and that
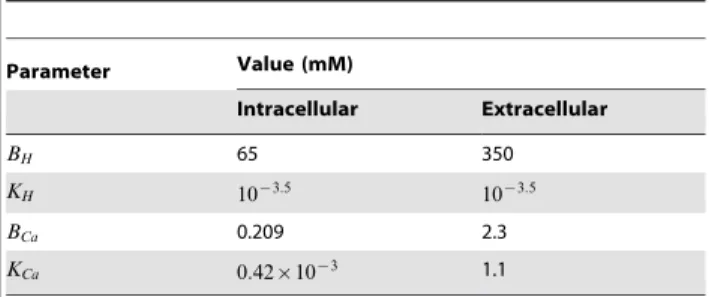
pHe is 7:4, then gave a concentration of extracellular proton buffers of350mM. A summary of ion concentrations and buffering parameters are given in Table 2 and Table 3, respectively.
The concentration ofCO2was calculated using the parameters
proposed and measured for guinea pig ventricular myocytes at
37oC by Leem and Vaughan-Jones [82]. The concentration of
CO2in the extracellular solution was calculated using
½CO2e~aCO2(%CO2)Patm ð42Þ
whereaCO2is the solubility ofCO2, set to0:0307mM mmHg{1
from human measurements at pH7:4and37oC [83],%CO
2is the
fraction of air that is CO2, set to 5% at baseline and Patm is atmospheric pressure, set to760 mmHg{1. This gives a partial
pressure ofCO2 (PCO2) of 38 mmHg, consistent with although slightly higher than the34+3 mmHg measured in rabbit hearts [84]. The hydration of CO2 was modelled by a mass action
reaction (Eqn 27). The kf and kr values were measured and modelled by Leem and Vaughan-Jones in guinea pig myocytes at
37oC [82], giving values of 0:365s{1
and 3:11|105s{1
, respectively, resulting in an equilibrium constant of10{6:2
. The rate of hydration ofCO2 was assumed to be similar in both the
intra and extracellular space. The movement ofCO2across the
cell membrane was modelled by Fick’s law. Previous models have used permittivity values of0:058mms{1
[82], based on measure-ments in red blood cells. This value was reused despite its lack of species and cell type consistency, as there were no recent studies characterising the permeability in cardiac myocytes and the high permeability leadsCO2 to be close to equilibrium between the
intra and extracellular spaces.
Current, exchanger and pump densities. The model of
each transmembrane ion pathway (y) was separated into a kinetic regulatory component (cy) dependent on transmembrane potential and ionic concentrations, and a scalar (Vy) representing either the maximum flux or channel conduction of the pathway. The flux across a pathway (Gy) is then given by
Gy~cyVy ð43Þ
TheVyvalues were determind by calculating all of thecyvalues (excluding cNBC, chyd and cCO2 as ½CO2i and ½HCO
{
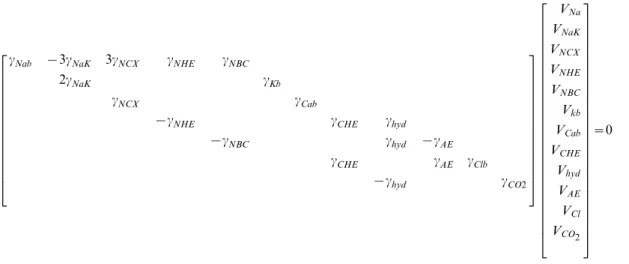
3i were unknown) using the ionic concentrations in Table 2 and assuming a membrane potential of280 mV. The remaining unknownVy and ionic concentrations were then determined from a limited number of measurements and by enforcing a zero net flux condition described by
Table 2.Intra and extracellular free ion concentrations.
Ion Concentration (mM)
Intracellular Extracellular
Naz 4.0 140
Kz 135 4.0
Cl{
18 110
Ca2z
80|10{6 1.2
Hz
10{4:1 10{4:4
CO2 1.17 1.17
doi:10.1371/journal.pone.0060323.t002
Table 3.Buffering Parameters.
Parameter Value (mM)
Intracellular Extracellular
BH 65 350
KH 10{3:5 10{3:5
BCa 0.209 2.3
KCa 0:42|10{3 1.1
As the parameters for hydrolysis and permeability of the cell membrane to CO2 (PCO2, kf and kr) were derived from the
literature, the constraints on VCO2 and Vhyd were used to
determine the concentrations of½CO2iand½HCO {
3i,
respective-ly. Measurements of transmembrane Naz
influx gave GNa as
0:25|10{5mM ms{1, G
NCX as0:48|10{5 mM ms{1,GNHE as0:20|10{5 mM ms{1 andG
NBC as0:20|10{5 mM ms{1
Table 4.Qualitative changes in intracellular ionic concentrations or membrane potential in response to changes in extracellular ionic concentration or inhibition of membrane transporters.
Protocol Change in Concentration or Potential Reference
Variable Change ½Kz
i ½Ca2
z
i ½H
z
i ½Cl
{
i ½Na
z
i Vm
1-24-9½Naz
e
Decrease : : : ; ;x2:x4 [160–163]
[164–166]
Increase ;< : ; [167,168]
½Ca2z
e
Decrease ; ; ; : <: [163,169,170]
Increase : ; : [171,172]
½Kz
e
Decrease ;< < < < : ; [160,161,173,174]
[71,162,175,176]
Increase :< :< < :< ; : [50,161,175,177,178]
[131,173,176,179,180]
HCO{
3=CO2
Increase : : ; : [71,166,181–183]
½Cl{
e
Decrease : ; ; ; : [184–186]
[50,71,187]
Increase : : : ; [50,184,187]
½Hz
e
Increase : : ;<: < [161,165,166,188]
NaK
Inhibition ; : : : : <: [43,170,175]
[35,160,177,189]
NHE
Inhibition ; : ; : [44,166]
doi:10.1371/journal.pone.0060323.t004
cNab {3cNaK 3cNCX cNHE cNBC
2cNaK cKb
cNCX cCab
{cNHE cCHE chyd
{cNBC chyd {cAE
cCHE cAE cClb
{chyd cCO2
2
6 6 6 6 6 6 6 6 6 6 6 6 6 4
3
7 7 7 7 7 7 7 7 7 7 7 7 7 5
VNa
VNaK
VNCX
VNHE
VNBC
Vkb
VCab
VCHE
Vhyd
VAE
VCl
VCO2 2
6 6 6 6 6 6 6 6 6 6 6 6 6 6 6 6 6 6 6 6 6 6 6 6 6 6 4
3
7 7 7 7 7 7 7 7 7 7 7 7 7 7 7 7 7 7 7 7 7 7 7 7 7 7 5
[85]. TheGNaK Nazflux was assumed to be equal to the sum of allNaz
influx. As the model does not includeNaz -Kz
-2-Cl{ co-transporter (NaK2Cl) or Naz
-Mg2z
exchanger (NaMg), primarily due to the limited data to constrain the kinetics,GNaK was reduced from the flux measured by Despa et al., [85] to 1.13|10{5 mM ms{1. Setting these G
y values defines VNa,
VNCX, VNHE, VNaK, Vkb and VCab. In the experimental and modelling work by the Vaughan-Jones group [70,86] the relative size ofGCHE toGNHE is 0:12{0:19 at pHi~7:1, this gave an estimated ratio of 0:16. Scaling GNHE determined from [85] by 0.16 provided an estimate of GCHE of 0:032|10{5 mM ms{1. This allowsVCHEandGhyd to be defined.Ghyd must be balanced byGCO2and asPCO2 and½CO2ewere known, this flux was used to set½CO2i. Combining thepHiand½CO2iconcentrations with the defined hydrolysis parameters and the known value of Ghyd
then gave ½HCO{
3i. Knowing Ghyd and GNBC gave GAE and hence VAE. Similarly, GCl was calculated from GAE and
GCHE,which gaveVCl. Finally,VNBC was calculated usingGNBC and cNBC, calculated using the derived ½HCO
{
3 i value. By automating this parameter derivation process the model param-eters could be updated to ensure static ion concentrations, and hence membrane potential, for any perturbation in model parameters or ionic concentrations. Parameters for all simulations in this study were derived following this process.
Intracellular calcium dynamics. The intracellular
regula-tion ofCa2z
was treated as an equilibrium system. This resulted in the SR effectively acting as an additional buffer on½Ca2z
i. The parameters Vleak, VSERCA, KSERCA, aSR and acyt were defined from enforcing a zero net flux constraint and experimental measurements. Measurements ofKSERCA are similar in rat and
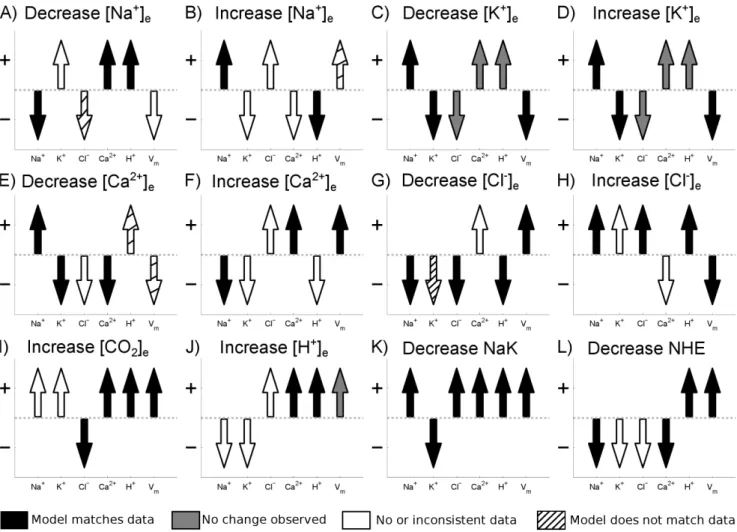
Figure 1. Cell membrane model validation. Arrow direction shows model prediction for the change in intracellular concentrations and
membrane potential for a change in extracellular ion concentrations or inhibition of membrane transporter as indicated by the panel label. The color of the arrow indicates how the model compares with experimental data, summarised in Table 4. Black arrows indicate where the model matches experimental data, white arrows indicate where there is no or inconsistent data, gray arrows indicate where no change was observed experimentally and striped arrows indicate where the model does not match experimental data. Data was considered inconsistent if different studies reported opposite changes in intracellular ion concentration or membrane potential in response to a change in extracellular ionic concentrations (for example the change in membrane potential following a decrease in½Naz
e). In cases where one study reported no change in intracellular ion concentration or membrane potential and another found a change, it was assumed that the change was correct (for example the change in½Kz
iin response to an increase or a decrease in½Kz
e). For example in panel A) corresponding to a decrease in½Na
z
e(as indicated by the panel label), the experimental data comes from row 1 of Tableoˆ 4. The model predicts that½Naz
idecreases and that½Ca 2z
iand½H
z
iincrease, consistent with experimental measurements and the arrows are shaded black. There is no consistent observed change in the transmembrane potential so theVmarrow remains white. No data is available for the change in½Kz
iin response to a decrease in½Na
z
eso theK
z
arrow remains white. The model predicts a decrease in½Cl{
i yet experimental measurements found an increase, hence theCl
{
rabbit [65] and have been reported as 0.260–0.350mM in rabbit [65,87] and 250–280mM in rat [65,87,88]. A value of 0.3mM was used in the model.JLeak is reported as 0.001–0.012mMms{1in rabbit, mouse and rat [54,89–91]. A value of 0.01mMms{1 was
used in the model. Enforcing a zero net flux constraint on the SR gaveJSERCAas 0.038mMms{1, comparable with values of 0.03– 0.08mMms{1measured in rabbit [65,87,92] with units converted
using scale factors from Bers [52].
Membrane Model Validation
To validate the passive membrane model, a series of tests based on the response of the cell models intracellular ionic concentra-tions and transmembrane potential to changes in extracellular ionic concentrations or inhibition of major ion transporters was performed. In order to maximise the number of tests the model was compared against data from cardiac cells, regardless of temperature, species or preparation type. This maximised the number of tests but meant that a quantitative comparison was not valid and so only a qualitative comparison was performed. A summary of experimental data used in the validation is provided in Table 4. Fig. 1 shows the comparison between the model and data. From the 72 simulations performed 43 matched the experimental data, data was not available or was inconsistent for 19, changes were too small to be measured in 5 and the model did not match experiments in 5 cases.
Diffusion Parameters
The tissue model required the definition of diffusion parameters for each of the ionic species in the intra and extracellular space. The diffusion parameters used in the model were all for the apparent diffusivity of free ions, lumping the effects of any mobile buffers, tortuosity and gap junctions into a single diffusion parameter. Using Eqn 21 the conductivity parameters were shown to be directly related to the conductivity parameters in the bidomain equations. From the review of bidomain conductivities and relative values in the intra and extracellular space by Roth [93] a conductivity value of 0.25 Sm{1
was taken for both the intra and extracellular space. This conductivity, along with the ionic concentrations from Table 2, were used to derive the diffusion parameters. The apparent diffusion ofHz
and HCO{
3
are 1:52|10{7
mm2ms{1
and 7:7|10{7
mm2ms{1
in the >intracellular space [86] and were assumed to be similar in the extracellular space. The apparent diffusion constant of Ca2z (including the effects of mobile buffers) has been estimated from experimental measurements in previous modelling studies
as 0:4{3|10{7mm2ms{1 [94–96]. Here a value of 1:5|10{7mm2ms{1[94] was used and the effect of diffusion in
the SR was not included, as it was assumed to be non contiguous between cells. It was assumed that Ca2z
diffusion is limited by buffering, resulting in the same value in the intra and extracellular space.Naz
,Kz
andCl{
were all assumed to have a common diffusion coefficient in either the intra or extracellular space as these ions are only nominally buffered and are only affected by gap junctions and tortuosity. Diffusion of CO2 was estimated from
previous modelling/experimental studies of CO2 in tissue as 11:3|10{7
mm2ms{1
[97], and was assumed to be the same in the intra and extracellular space. Solving Eqn 21 for the diffusion of intra and extracellularNaz
,Kz
and Cl{
gives the diffusion parameters summarised in Table 5.
Finally, the effects of½Hz
ion gap junction conductivity were included. Measurements in cell pairs by Swietach et al., [98] have demonstrated that the permeability of gap junctions has a biphasic dependence on the ½Hz
i concentration. To introduce these effects into the model the intracellular diffusion constants were scaled by
cdiff~ ½Hz
ni1 ½Hzn1
i zKdn11 Kdn22 Kn2
d2z½Hz
n2
i
ð45Þ
where n1/Kd1 and n2/Kd2 are the cooperativity and binding
affinity for the activation and deactivation of gap junctions by protons, respectively and cdiff scales all intracellular diffusion constants. Using the measured parameters from end-to-end cell pairs in Swietach et al., [98] n1~2:062, n2~1:81,
Kd1~10{3:959mM and Kd2~10{3:934mM. In this model of
proton effects on gap junction permeability there is an implicit assumption that the gap junction permeability plays a dominant role in defining diffusion. At this stage no other regulators of permeability were included in the model, notablyCa2z
regulation is absent but this can readily be included in the modelling framework as required.
Simulating Ischemia
In this study the effect of NaK inhibition,IKb activation and respiratory and metabolic acidosis during ischemia on cell ionic homeostasis were considered. This list is not exhaustive and absent factors are discussed below. Ischemia was modelled by respiratory acidosis, metabolic acidosis, increasedKz
channel conductance and decreasedNaKfunction. The specific time course of each of these changes is poorly characterised. Previous modelling studies have assumed that changes in cell function with ischemia have evolved linearly [99] or as a nonlinear function of prescribed metabolite concentrations [20]. To avoid any undue bias from the arbitrary selection of a time course, all changes are initially considered instantaneous.
NaK inhibition andKz
channel activation were modelled by scaling the respective fluxes. Respiratory acidosis was assumed to result from an imbalance of production and washout ofCO2. To
simulate this, an (implicitly electro neutral) intracellular source of
CO2was introduced into the ischemic region. There was no flux of CO2out of the extracellular space and this resulted in a build up of CO2 in both the intra and extracellular space in the ischemic
region.
To model metabolic acidosis required the introduction of an additional intracellularHz
source. However, introducing a source of cations into the cell compromised the conservation of charge constraint. To provide an electro neutral source ofHz
required Table 5.Effective ion diffusion parameters.
Ion Diffusion Constant (10{7mm2ms{1)
Intracellular Extracellular
Naz 7.7 12.9
Kz 7.7 12.9
Cl{
7.7 12.9
Ca2z 1.5 1.5
Hz 1.52 1.52
HCO{
3 7.7 7.70
CO2 11.3 11.3
the concurrent introduction of a source of anions that match the production ofHz
inside the cell. It was implicitly assumed that the anions entered the cell in an electro neutral form with anHz bound, and the anions and Hz
separate within the cell due to metabolic processes. The source ofHz
in ischemia is likely to be due to increased ATP production through glycolysis [100]; in the absence of oxygen this also results in increased lactate production. As lactate readily dissociates fromHz
it was assumed that the anion source that matchesHz
flux has similar characteristics to lactate including transmembrane regulation via the lactate-Hz membrane exchanger MCT1 [101]. Given the ambiguity in structure, MCT1 was modelled as an ordered exchanger, using the kinetic parameters from Vinnakota and Beard [102] and the maximum influx value of4:8|10{5mMms{1recorded in guinea
pig myocytes [103]. In the absence of metabolic acidosis, lactate concentration was assumed to be nominal, consistent with the
small flux of lactate observed in rabbit hearts under normal conditions [104]. Model simulations were performed on a 1D strand with length 32 mm, oriented in the preferred conduction or fibre direction, with a transition between ischemic and viable tissue at 16 mm to ensure the simulation captured the BZ width with nominal boundary condition artefacts. The transition between viable tissue and ischemic tissue was approximated by a Hill equation with a Hill coefficient set to ensure a steep transition between the ischemic region and viable tissue over 440mm, consistent with the rapid drop in oxygen pressure across the BZ in swine [105].
Numerical Methods for Tissue Model
The nonlinear equations were solved using a fully implicit finite difference scheme with a line search Newton-Raphson method. The transmembrane flux component of the Jacobian was
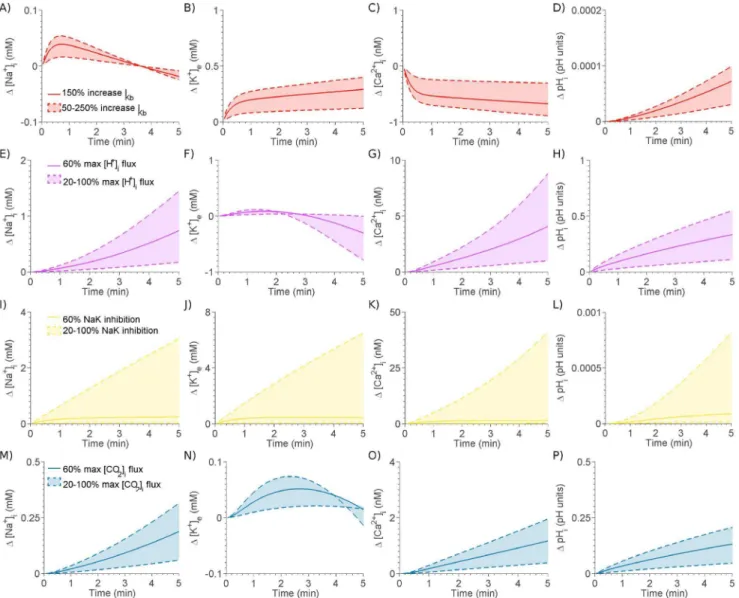
Figure 2. Effect of individual components of ischemia on the change in½Naz
i(column 1),½K
z
e(column 2),½Ca2
z
i(column 3) and
pHi(column 4).Effect of 50–250% increase inIKb(red shaded region enclosed by dashed line) and a 150% increase inIKb(red line) on A)½Na
z
i, B)
½Kz
e, C)½Ca2
z
iand D)pHi. Effect of 20–100% maximum½H
z
iflux (purple shaded region enclosed by dashed line) and 60% maximum½H
z
iflux (purple line) on E)½Naz
i, F)½K
z
e, G)½Ca 2z
iand H)pHi. Effect of 20–100% NaK inhibition (yellow shaded region enclosed by dashed line) and a 60% NaK inhibition (yellow line) on I)½Naz
i, J)½K
z
e, K)½Ca 2z
iand L)pHi. Effect of 20–100% maximum½CO2iflux (blue shaded region enclosed by dashed line) and a 60% maximum½CO2iflux (blue line) on M)½Na
z
i, N)½K
z
e, O)½Ca2
z
calculated using finite differencing with the remainder calculated analytically. The Jacobian was inverted directly using MatLab and was only recalculated if the residual fails to decrease or convergence was not reached within 10 Newton-Raphson iterations.
The dependence of the BZ width on the spatial and temporal discretizations was determined to test for numerical convergence. The width of the transition for each ion concentration between the viable and ischemic region, referred to as the BZ width for each ion, was calculated by fitting a Hill curve to each ionic profile. The width of the BZ for each ion was then calculated as the distance between10and90%of the change in concentration.
A convergence analysis was performed and a mesh discretiza-tion of50mm and a time step of1000ms was used. Increasing the spatial discretization by a factor of2results in a maximum change in BZ width of any ion of0:001mm. Decreasing the time step to
100ms increases the maximum BZ width of any ion by0:001mm.
Results
The individual effects of each of the four components of ischemia were first demonstrated. A combined model of ischemia was then developed and the width and magnitude of the changes in ionic concentrations across the ischemic BZ were predicted. The effect of movement of Kz
, Naz
and Cl{
within and between intra and extracellular spaces across the BZ were calculated to show the net movement of ions across the BZ.
Simulating Individual Components of Ischemia
The level of inhibition ofNaK, the activation ofIKb and the level ofCO2andH
z
production in the cell during ischemia is not known. To investigate the effects of each of these aspects of ischemia, they were each individually introduced into the model at five levels of severity, for xw16mm along a32mm strand. Fig. 2
shows the effect of each component on the change in ½Naz
i, ½Kz
e, ½Ca2 z
i and pHi across the ischemic BZ. The range of alterations in ion concentrations is shown by the shaded regions. The minimum and maximum changes in each component are shown by dashed lines and the mid change is shown by the solid line.NaK(yellow) was inhibited by up to 100% (no flux) in20%
increments,IKb(red) was scaled by up to250%in50%increments, metabolic acidosis was simulated by introducing an Hz
flux in five increments up to a maximum value of 0:1mMms{1 and
respiratory acidosis (blue) was simulated by a intracellular CO2
flux increased in five increments up to a maximum value of
0:12mMms{1.
Modelling Ischemia
Inherently, there is no single mode of ischemia and the relative contribution of acidosis, NaK inhibition or IKb activation will depend on the residual flow, age, gender, disease state, location of ischemic region and species under study. To provide a represen-tative case to study, 5 minutes of ischemia were simulated in the presence of all four ischemic mechanisms that match representa-tive results from the literature.
Partial pressure measurements of CO2 in canine ischemic
models show a 100{300% increase in CO2 partial pressure
following occlusion, depending on the level of flow inhibition, after
10{15minutes. The elevation inCO2was approximately linear
over time and hence in the model it was assumed CO2
concentration increases by 150% increase in the first 5minutes of ischemia [106,107]. This corresponded to an increase in the concentration ofCO2in the model from1:1mM to2:8mM. In the
model respiratory acidosis was caused by an increase in½CO2i flux that cannot be vented from the extracellular space. Although it is recognised that the decrease inpHedue to metabolic acidosis will also contribute to elevated½CO2e, initially theCO2flux was
set at a60%level to achieve an increase inCO2concentration to 2:2mM, which resulted in a decrease of pHi to 7:0. During ischemia pHi decreases rapidly before plateauing after approxi-mately15minutes. The decrease in the initial5minutes has been reported to fall between0:2to0:5pH units in rat [108], ferret, [109] and guinea pig [110] preparations. Respiratory and metabolic acidosis will both contribute to this drop inpHi. In the model setting the level of intracellularHz
flux to30%caused a 0:17 pH unit drop and an increase in ½CO2e to 1:6mM. Combined metabolic and respiratory acidosis caused a0:28 unit drop in pH and an increase in½CO2eto2:85mM.
In studies of ischemia ½Naz
i tends to increase linearly with time. In the rat heart ischemia caused an increase in½Naz
i by
78+8%over21minutes [111], by200%after40minutes [112], from 10:5mM to 25mM during 30 minutes ischemia [113], by
170%, 248%, 391% and 405% after9, 15, 21 and 27 minutes, respectively [114], by two fold over 20 minutes [115], from
6:9mM to10mM over30minutes [116], by108{120%over30
minutes [117], by408%over27minutes [118], no change over10
minutes [108] and by104{130%over30minutes [119]. Changes in½Naz
i in guinea pig hearts during ischemia is controversial with reports of a decrease from 8:8mM to 4:7{7:6mM over
10{15minutes [120] and of an increase of108%over15minutes [121]. Only considering the cases where½Naz
iincreases, as these represent a repeatable consensus result, the range of expected increases in½Naz
iover a5minute period is7:5{94%, assuming a linear increase with time. These cluster into two groups with ranges 7:5{38% and 75{94%. In the model reducing the maximum flux ofNaKby86%caused an increase in½Naz
i to
4:95mM (24%) in the absence of acidosis or5:57mM (39%) in the presence of the acidotic components of ischemia, described above. Given the inhibition of NaK and levels of respiratory and metabolic acidosis a sweep ofIKbactivation values was performed in the presence of these changes to achieve the desired level of extracellularKz
accumulation. During ischemia,½Kz
eincreases over three characteristic phases, with the first phase occurring during the initial5minutes of ischemia prior to reaching a plateau from minutes 5 to10, before increasing again. In guinea pigs, ischemia caused½Kz
e to increase from4:2to12:6mM over10 minutes [122] or4 to 5:8mM over 6 minutes [123]. In swine, ischemia caused ½Kz
e to increase from 3:3{4:2mM to
10:1{11:5mM after 7{8 minutes [124,125]. In rat, ischemia caused an increase from4:2mM to 8mM over 5minutes [110], although other groups have seen a biphasic change in½Kz
ein rat with an increase from5mM to8:3mM before falling back to6mM then continuing to rise again, observed over the first8:2minutes [126]. In rabbit, ischemia caused ½Kz
e to increase from
4{4:5mM to 6{9:4mM over 5{10 minutes [10,110,125]. In canine,½Kz
eincreases from3:2{4:2mM to8:1{14:5mM after
6{12 minutes [127,128]. These results indicate an increase in
½Kz
e from4mM to10{14mM after10 minutes and assuming
80%of this rise occurs in the first5minutes [127], and combined with the 5 minute data gives an estimate of½Kz
eafter 5 minutes of ischemia as 5:5{11mM. In the model an increase inIKb of
120% was used to achieve an elevation of ½Kz
e to 6:5mM, resulting in an increase in the membrane potential of6:6mV to
{73:4mV. This is consistent with measurements in cat (5:4{8:1mV over 10 minutes) [129,130], sheep (5mV over 5
mice (16mV over10minutes) [133], but less than measurements in rabbit (33mV over12minutes [10]) and guinea pig (32:5mV over
15minutes [120] or22{29mV over30minutes [134–136]). The broad variation in membrane potential changes was not
unexpected given the range of changes in ½Naz
i and ½K z
e reported and in simulations an intermediate value has been achieved.
The individual and combined effects of the four components of ischemia on the temporal evolution of the maximum change in ionic concentrations and the spatial concentration and potential distribution profile after 5 minutes of simulated ischemia are shown in Fig. 3. As ischemia progressed, ½Naz
i continued to increase. The early rise was attributed toNaKinhibition; the later increases were due to metabolic and respiratory acidosis. The early rise in½Kz
ewas significantly affected byNaKinhibition withIKb activation playing a greater role as ischemia progresses and the membrane potential diverges from theKz
reversal potential. The decrease inpHiwas solely due to acidosis with no impact fromIKb activation orNaKinhibition.½Ca2z
ielevation was contributed to principally by NaK inhibition, while increased IKb decreased ½Ca2z
i. Ischemia caused an initial drop followed by a sustained rise inVm.IKbactivation caused an early hyperpolarisation of the membrane potential, which was subsequently countered by the depolarising effects of NaK inhibition, with acidosis having a limited effect.
Figure 4 plots the width of the BZ for each ion with striped bars corresponding to extracellular space and the darker the bar the more significant the concentration gradient relative to the initial concentration. This plot shows that ½Kz
e had a significantly wider BZ with greater magnitude than½Naz
i. For pH regulation,
Hz
had a narrower BZ compared to the significantly wider
HCO{
3 BZ, which may indicate the facilitation of proton transport
viaHCO{
3 diffusion.
Extracellular Potassium Gradients The½Kz
eBZ width was significantly wider than other BZ ion widths and notably larger than the ½Naz
i BZ width. To determine the cause of this extended½Kz
eBZ the source of the cumulative changes in½Kz
edue to transmembrane flux, drift or diffusion over the 5 minutes of ischemia were calculated and plotted in Fig. 5. This showed that only the transmembrane flux had a significant gradient across the ischemic region. Separating the transmembrane flux into theNaK andIKb components then identified the Kz
channel, which includes the ATP-inactivated
Kz
current, as the cause of this gradient. The gradient ofIKbwas due to the extensive membrane potential gradient into the ischemic region (see Fig. 3). To confirm that this was the cause
Figure 3. Evolution and profile of A-B)½Naz
i, C-D)½K
z
e, E-F)
½Ca2z
i, G-H)pHiand I-J) membrane potential across the BZ due
to each component of ischemia. Complete ischemia, NaK
inhibition, IKb inhibition, respiratory acidosis and metabolic acidosis are represented by black, yellow, red, blue and purple lines, respectively. Column 1 shows the profile of ionic concentrations and membrane potential after 5 minutes and column 2 shows the evolution of the change in magnitude in ionic concentrations and potential across the border zone with time.
doi:10.1371/journal.pone.0060323.g003
Figure 4. Width of ionic BZ. Gray scale represents magnitude of
gradient with white indicating no gradient.Solid bars indicate
of the½Kz
eBZ width, the membrane potential was calculated as normal, but an additional clamped membrane potential was calculated at each time step. The clamped membrane potential had the same maximum and minimum values as the correct membrane potential but instead of a smooth gradient across the BZ it had a sharp transition over the BZ. A comparison of this clamped and the control membrane potentials is shown in the Fig. 5C. The effects of using a clamped membrane potential to calculate the NaK flux or the IKb current on the cumulative changes in½Kz
eafter 5 minutes of simulated ischemia are plotted in Fig. 5B, demonstrating that by removing the gradient in the membrane potential experienced by IKb there is a significant narrowing in the½Kz
eBZ.
Drift and Diffusion
To investigate the relative contribution of drift and diffusion to intra region fluxes (inter or extracellular) the drift and diffusion fluxes in each region were plotted, alongside the transmembrane flux, over the length of the strand after5minutes of ischemia. Fig. 6 shows the differences in drift and diffusion betweenCl{
,Naz and
Kz
. As expected from the intra and extracellular gradients, intracellularKz
andCl{
diffused into and out of the ischemic region in the intra and extracellular space, respectively. The converse was the case for Naz
. Due to the decrease in transmembrane potential, characteristic of ischemic regions, there was a convergence of intra and extracellular potentials with the extracellular potential decreasing in the ischemic region and the intracellular potential increasing. This gradient caused positive ions to drift into the ischemic region in the extracellular space and drift out of the ischemic region in the intracellular space. The converse was true for negatively charged ions. As drift is proportional to the ionic concentration,Naz
drift was significant in the extracellular space and Kz
drift was significant in the intracellular space. ForNaz
, drift and diffusion operated in the same direction in the intra and extracellular space. The result was a cyclical movement ofNaz
moving into the ischemic region in the extracellular space, while moving out of the ischemic region in the intracellular space. TheCl{
movement was also circular but in the opposite direction (Fig. 6P). However, for Kz
drift and diffusion were in opposite directions. In the extracellular space where theKz
concentration was low, diffusion dominated and
Kz
moved out of the ischemic region. In the intracellular space, where there was a higher concentration ofKz
, drift dominated,
also causingKz
ions to move out of the ischemic region. Thus ischemia caused a depletion ofKz
in the ischemic region through both the intra and extracellular space and, contrary to previous hypothesis [13], the model suggests that intracellular Kz movement is the dominant path for Kz
to leave the ischemic region.
Discussion
In this study a new model of cardiac tissue electrophysiology was developed. The model predicted that the width of the ½Kz
e gradient across an ischemic BZ would be significantly wider the
½Naz
i BZ. The cause of this difference was attributed to the voltage dependence of the IKb channel. The model also demonstrated that, due to electrogenic drift,Kz
moved out of the ischemic region in both the intra and extracellular space which will lead toKz
depletion.
The model of ionic movement and tissue electrophysiology was developed by combining the Nernst-Plank equations with the bidomain framework. No attempt was made to explicitly validate the proposed tissue model equations due to the paucity of experimental data. However, applying simplifying assumptions with regards to ionic or voltage gradients reduces the proposed equations to the well validated bidomain equations [137,138] or coupled reaction-diffusion equations [28,86], respectively, provid-ing support for the validity of the proposed modellprovid-ing framework. The limited attempts at simulating the spatial temporal evolution of ionic gradients across the ischemic BZ have largely uncoupled the movement of ions and the electric field. Potse et al., [18] demonstrated that measuredKz
gradients across an ischemic BZ could be simulated using a model ofKz
diffusion coupled to a source term. The spatially varying½Kz
egradient could then be included as a boundary condition to models of transmembrane current in the bidomain equations. This model did not include any effect of electric gradients onKz
movement,½Kz
i movement, inter ionic species interactions or the effect of the ischemic region on any other ion gradient. Similar sets of equations to those proposed here have been used for simulating the potential gradient surrounding cells, including the Debye layer [139], electrical propagation along strands of cardiac cells [140,141] and for modelling ion diffusion in the cable equation [142]. These previous models have either explicitly represented the intra and extracellular domains or only considered the intracellular domain
Figure 5. Mechanisms underpinning ½Kz
e BZ width. A) Reference change in ½K
z
e after 5 minutes of simulated ischemia caused by transmembrane flux (blue dashed line), diffusion (purple line), drift (red line) and the total change due to all causes (yellow line). The BZ is indicated by the yellow shaded region. B) Change in½Kz
ein the reference model (yellow line) compared with change in½K
z
ewhenIKb(purple dashed line) orNaK(blue dashed line) are exposed to a clamped membrane potential. The reference BZ and BZ whenIKbis exposed to a clamped membrane potential are indicated by the yellow and purple shaded regions, respectively.
but have not modelled the tissue within the bidomain framework, as derived and implemented here.
The proposed equations can be applied generally in three dimensions as opposed to the one dimensional simulations presented here. The current study does not consider the effects of anisotropy on ion or membrane potential gradients across the BZ, however, if implemented in two or three dimensions the model is capable of representing tissue anisotropy and any effects this may have on BZ gradients. By conserving ionic species the
proposed equations provide a more biophysical representation of cardiac electrophysiology than the bidomain equations and can appropriately be applied to simulate a broader range of conditions. However, these benefits come at a cost. Unlike the bidomain equations, with two partial differential equations that can readily be uncoupled and solved as two sets of linear equations [143], the proposed model is nonlinear and contains two parabolic partial differential equations for each ionic species and one elliptic partial differential equation to model the electric potential. This results in
Figure 6. Regulation of Naz
, Kz
andCl{
ionic concentrations across the border zone after 5 minutes of ischemia. Intra and
extracellular A)Naz
, B)Kz
and C)Cl{
ionic concentrations. D) Intra and extracellular potential. Intracellular drift and diffusion flux of E)Naz
, F)Kz
and G)Cl{
. Extracellular drift and diffusion of H)Naz
, I)Kz
and J)Cl{
. Transmembrane flux of K)Naz
, L)Kz
and M)Cl{
. Schematics showing the general direction of ion movement within and between the intra and extracellular space for N)Naz
, O)Kz
and P)Cl{