ACPD
2, 2045–2074, 2002Emission by aircraft engines
A. Sorokin et al.
Title Page Abstract Introduction Conclusions References
Tables Figures
◭ ◮
◭ ◮
Back Close
Full Screen / Esc
Print Version
Interactive Discussion
c
EGU 2002
Atmos. Chem. Phys. Discuss., 2, 2045–2074, 2002 www.atmos-chem-phys.org/acpd/2/2045/
c
European Geosciences Union 2002
Atmospheric Chemistry and Physics Discussions
Emission of ions and charged soot
particles by aircraft engines
A. Sorokin1, X. Vancassel2, and P. Mirabel2 1
Central Institute of Aviation Motors, 2 Aviamotornaya str., 111116, Moscow, Russia
2
Centre de G ´eochimie de la Surface, CNRS and Universit ´e Louis Pasteur 1, rue Blessig, F-67084 Strasbourg France
ACPD
2, 2045–2074, 2002Emission by aircraft engines
A. Sorokin et al.
Title Page Abstract Introduction Conclusions References
Tables Figures
◭ ◮
◭ ◮
Back Close
Full Screen / Esc
Print Version
Interactive Discussion
c
EGU 2002
Abstract
In this article, a model which examines the formation and evolution of chemiions in an aircraft engine is proposed. This model which includes chemiionisation, electron thermo-emission, electron attachment to soot particles and to neutral molecules, electron-ion and electron-ion-electron-ion recombinatelectron-ion, electron-ion-soot interactelectron-ion, allows the determinatelectron-ion of the electron-ion
5
concentration at the exit of the combustor and at the nozzle exit of the engine. It also allows the determination of the charge of the soot particles. A comparison of the model results with the available ground-based experimental data obtained on the ATTAS re-search aircraft engines during the SULFUR experiments (Schumann, 2002) shows an excellent agreement.
10
1. Introduction
Chemiions (CI) emitted from aircraft engines in exhaust plumes may play an essential role in aerosol formation. They are thought to act as condensation centres and then to promote the formation of volatile aerosols, but they are also invoked in the coagulation of the newly formed particles, where their presence will enhance coagulation and then
15
will lead to particles larger than in the absence of charges (Frenzel and Arnold, 1994; Yu and Turco, 1998). However, to play this important role, CI must be present at rather high number densities and one of the key points is to know what the initial concentra-tions are, both for positive and negative ions, at the level of the nozzle exit of an aircraft engine. In addition to CI, soot particles are also emitted which may act as a sink for
20
some of the CI, leading to the formation of charged soot particles (in addition to those formed directly by charged soot embryos). Neutral soot particles are generally invoked in the formation of contrails, but one can speculate that the presence of charged soot particles may intensify their role in contrail formation and evolution.
Only a few direct measurements at ground level are available, which show that the
25
ACPD
2, 2045–2074, 2002Emission by aircraft engines
A. Sorokin et al.
Title Page Abstract Introduction Conclusions References
Tables Figures
◭ ◮
◭ ◮
Back Close
Full Screen / Esc
Print Version
Interactive Discussion
c
EGU 2002
than 1 s (Arnold et al., 1998; Sorokin and Mirabel, 2001). At the same time, ion con-centrations larger than 109cm−3 are needed at the nozzle exit, in a model based on the dominant role of ions in ultrafine particles formation (Yu and Turco, 1998), in order to obtain a satisfactory comparison with the available in flight measurements (Fahey et al., 1995; K ¨archer et al., 1998).
5
If chemi-ion formation in aircraft engine has not been studied extensively (see for example Strarik et al., 2002), the production of CI in hydrocarbon flames has already been investigated in great detail and their concentrations, at pressures in the range 2–760 torr, were found to be of the order of 109−1012cm−3 (see for example Fialkov, 1997 for an extensive review on ions in flames). It has been shown that one of the
10
most important reactions of chemi-ionisation in flames leads to the formation of CHO+ (Calcote, 1962; Green and Sugden, 1963) which is, with C3H+3 and C2H3O+ the
dom-inant ion in the flame front of hydrocarbon fuels (Eraslan and Brown, 1988; Pederson and Brown, 1993; Calcote and Keil, 1990; Fialkov, 1997). These primary positive ions readily transfer their protons to substances having high proton affinity such as water,
15
leading in most cases to hydronium ions H3O+, the most abundant positive ions in the
oxidation zone after the flame front. The situation with negative ions is more compli-cated and non-unique. Two cases of dominance have been observed: electrons or negative ions and their concentration shares seem to depend strongly on the structure of the combustion zone and on the mixing ratio with air (Lawton and Weinberg, 1969;
20
Goodings et al., 1979; Fialkov, 1997). Further reactions leading to the formation of the whole spectrum of negative ions are represented by electron attachment to neutral molecules, in accordance with their electron affinities, and by numerous ion-molecule transfer reactions.
In laboratory flames the maximum rate of ion formation, produced mostly by
chemi-25
ACPD
2, 2045–2074, 2002Emission by aircraft engines
A. Sorokin et al.
Title Page Abstract Introduction Conclusions References
Tables Figures
◭ ◮
◭ ◮
Back Close
Full Screen / Esc
Print Version
Interactive Discussion
c
EGU 2002
formed through the “ionic route”, (Fialkov, 1997) but they may also gain a net charge through ion-attachment. Measurements indicate that in the hottest zone, soot particles may be charged according to equilibrium, (see, for example, Lawton and Weinberg, 1969) but this is not always the case and the initial particle charge seems to depend upon the material burnt (Burtscher et al., 1986). It is interesting to note that the net
5
charge of soot particles in flames was found to be positive (Onischuk et al., 2001) even in the flame region where a large excess of electrons exists.
In the combustor of an aircraft engine, it is expected that CI are formed and interact with soot particles in the same way as in laboratory flames, however the whole spec-trum of observed CI (both positive and negative) is much wider than in the case of
10
laboratory flames (Kiendler et al., 2000a, b; Kiendler and Arnold, 2001). Nevertheless as for hydrocarbon flames in the post-flame region, the most abundant positive ions are still H3O+ and some small hydrocarbon ions such as C3H+3 or C2H3O+, while the
most abundant negative ions are O−2 and to a less extend OH−, O−3, CO−3, NO−2 or NO−3 and eventually some oxygenated hydrocarbon ions such as CxHyO−z (Fialkov, 1997;
15
Kiendler et al., 2000b; Kiendler and Arnold, 2001).
The formation of soot particles and their partial oxidation in gas turbine combustors is a very complex process. Soot is produced mainly in the fuel-rich primary zone of the combustor, then oxidized in the high-temperature regions of the intermediate and dilution zones. Experimental measurements (IPCC, 1999) show that aircraft jet engines
20
emit soot particles, which can be represented by a log-normal type size distribution peaking at about 20–30 nm, with a number concentration at the nozzle exit which ranges between 106and 107particles per cm3.
As noted above, the charge of soot particles may have an impact on contrail forma-tion and evoluforma-tion. It may also have an impact on the emission levels of CI since the
25
ACPD
2, 2045–2074, 2002Emission by aircraft engines
A. Sorokin et al.
Title Page Abstract Introduction Conclusions References
Tables Figures
◭ ◮
◭ ◮
Back Close
Full Screen / Esc
Print Version
Interactive Discussion
c
EGU 2002
soot “embryos”. In a high-temperature zone (about 2000–2500 K), soot particles ac-quire a positive charge because of thermoionization. In contrast, if the temperature is not too high and if the concentration of free electrons is large, the capture of electrons by particles is the dominant process and particles may acquire a negative charge. In addition, the sign of the charges depends on the particle sizes; very small particles will
5
favour positive charges while larger particles will be preferably negatively charged. It is clear from the above examples, that the emission of CI as well as the charging of soot particles is strongly influenced by the temperature profile which itself depends on the structure of the air flow field in the engine and on mixing of fuel with air.
It is the purpose of this article to study the evolution of charged species, i.e. CI
10
and soot particles in the combustor and post-combustor flow, in order to determine an upper limit for the ion number densities and to evaluate the charge distribution of soot particles at the nozzle exit of a typical aircraft engine.
2. Methodology
In a conventional engine, primary air is introduced through the dome or head-plate
15
of the burner and through the first row of liner air holes (primary zone of combus-tor). To complete the combustion process and consume the unburned fuel, additional secondary air is introduced through a second row of lines holes. Finally dilution air is in-troduced in the dilution zone in order to carefully control exit temperature radial profiles to ensure acceptable turbine durability and performance (Lefebvre, 1985; Mattingly et
20
al., 1987). In the primary zone the air-fuel ratio is less than unity and the temperature is not high enough to complete the fuel burning. It is in this primary zone that most of the soot (if not all) is generated. In the intermediate zone, location of the flame front, the air-fuel ratio is about one and complete fuel burning is achieved which brings the temperature to its highest level in the combustor. It is expected that the formation of
25
ACPD
2, 2045–2074, 2002Emission by aircraft engines
A. Sorokin et al.
Title Page Abstract Introduction Conclusions References
Tables Figures
◭ ◮
◭ ◮
Back Close
Full Screen / Esc
Print Version
Interactive Discussion
c
EGU 2002
In the dilution zone, the mean air-fuel ratio is larger than unity. It is in this zone that soot particle charging is occurring, through interaction with positive and negative ions and through soot thermo-emission. Electrons attachment to oxygen molecules and ion-ion recombination are also taking place in this zone.
Based on these considerations, the following assumptions have been made :
5
– Since the formation of soot particle is an extremely complex problem, well beyond the scope of this study, we will assume that soot particles form only in the primary zone with a monodisperse size (diameter=2a) and with an initial concentration equal toNs,o.
– The primary charged species are mainly formed in the intermediate zone (flame
10
front) with a rate production rateQ(t). As discussed above, the primary charged negative species are electrons and the primary positive ions are CHO+ (and may be also CH+3, C3H+3 or C2H3O+), but the exact knowledge of the nature of positive
ions is not mandatory in this approach. Due to the high temperature and high concentrations of primary ions, the charging of soot particles moving across the
15
combustion zone is very effective.
– Further evolution of the different charged species in the dilution zone is repre-sented by the electron attachment to soot particles and to neutral molecules, electron-ion and ion-ion recombination, ion-soot interaction (charged and neu-tral) and soot particles oxidation with partial coagulation (Calcote, 1962; B ¨ohme,
20
1972, 2000; Fialkov, 1997).
2.1. Kinetic model of chemiions evolution and soot particles charging
Our model consists of four coupled differential equations which describe the time evo-lution of the concentrations of electrons (ne), negative (n−) and positive (n+) ions and soot particlesN. These equations deal with the chemiionisation rateQ(t) for the
pro-25
par-ACPD
2, 2045–2074, 2002Emission by aircraft engines
A. Sorokin et al.
Title Page Abstract Introduction Conclusions References
Tables Figures
◭ ◮
◭ ◮
Back Close
Full Screen / Esc
Print Version
Interactive Discussion
c
EGU 2002
ticles charging (multi-charged particles are allowed) due to electron thermo-emission (Je,p) or due to electron (kes) or ion (ki s) attachment to soot particles, with electron-ion
(kei) and ion-ion (ki i) recombination and with electron attachment to neutral molecules (kea). Soot particles oxidation in combustion and dilution zones as well as their mutual coagulation is neglected (see below).
5
d ne
d t =Q(t)+ ΣJe,pNs,p−Σnekes,pNs,p−keinen+−keaneαaA 2
+De d n+
d t =Q(t)+−keinen+−ki in+n−−Σn+k +
i s,pNs,p+Di d n−
d t =keaneαaA 2−k
i in+n−−Σn−ki s,p− Ns,p+Di
d Ns,p
d t =Je,p−1−Je,p−ne
kes,pNs,p−kes,p+1Ns,p+1
−Ns,pkis,p− N−+k+ i s,pn+
+ki s,p− +1n−Ns,p+1+ki s,p+ −1n+Ns.p−1+Ds (1)
10
In these equations, the index p corresponds either to the charges carried by soot particles (p = 0, +/−1, +/−2, etc. up to +/−pmax), the coefficient αa is the
mole fraction of the neutral gas species to which the electrons will attach andAis the total concentration of neutral molecules. This system is solved taking into account the following initial conditions:ne =n− =n+=0 andNs,p(p6=0)=0 withNs,o=Ns(t=0).
15
It also satisfies the conditions of conservation of the total concentration of particles and of electrical neutrality i.e.:
Ns= X
p
Ns,p (2a)
ne+n−+
X
p<0
|p|Ns,p=n++ X
p>0
ACPD
2, 2045–2074, 2002Emission by aircraft engines
A. Sorokin et al.
Title Page Abstract Introduction Conclusions References
Tables Figures
◭ ◮
◭ ◮
Back Close
Full Screen / Esc
Print Version
Interactive Discussion
c
EGU 2002
The maximum possible value for the charge p in the model, pmax, was chosen to be 13. Finally, the termDi denotes the change in concentrations due to the exhaust
expansion in the post-combustor flow or to the exhaust dilution in the plume. The numerical solution of the system of stiff kinetic equations was performed using the code DGEAR of the Fortran library IMSL.
5
We now rapidly examine each kinetic process involved in the equations.
2.2. Chemiionisation rates in the combustion zone
Chemiionisation rate is represented by the termQ(t), the number of primary electrons or positive ions produced per unit of exhaust volume per second. A linear growth from zero to a maximum valueQ0(corresponding to the position of the flame front) at time
10
τc followed by a linear decrease to zero at time 2τc(just behind the combustion zone) is assumed. The valuesτc = 10−6s used in our calculations follows the assessment
by Kuznetsov (1983) that the volume occupied by the intermediate zone is smaller than 1% of the total volume of combustion chamber. Test calculations made with our model show that the output results (e.g. at the combustor exit) are insensitive to the value
15
ofτc as long asτc ≪ τres whereτres is the typical mean residence time of products in the combustion chamber (of the order milliseconds). The effect of pressure on the maximum rate of ion formationQ0 was considered by Calcote (1962) for propane-air
flames near-stoichiometry (equivalence ratio of 0.9) in a pressure range 33–760 torr. The results indicate that this parameter depends on the pressure squared according to
20
Q0/p 2
≈5×10⁹ions/(cm3torr2). In the present study we have used this dependence which considerably simplifies the analysis.
2.3. Soot particles evolution
As we already noted, soot formation and evolution processes are extremely complex. Soot is formed in the primary zone, but is oxidised in the regions downstream of the
25
ACPD
2, 2045–2074, 2002Emission by aircraft engines
A. Sorokin et al.
Title Page Abstract Introduction Conclusions References
Tables Figures
◭ ◮
◭ ◮
Back Close
Full Screen / Esc
Print Version
Interactive Discussion
c
EGU 2002
complete burning of the particles. Quantitatively accurate methods for calculating soot size distribution within an operating combustor have not yet been developed (Sudarev and Antonovsky, 1990; Brocklehurst et al., 1997; Hu et al., 2000). However, as will be shown later, it is possible to estimate the range of soot particle concentrationsNs◦
and mean size in aero-combustor, using the measurements of soot particles at the
5
engine nozzle exit. Typical number concentrations at the nozzle exit range fromNsexp =
106to107cm−1with diametersds ≈20−60 nm (IPCC, 1999). Behind the primary zone,
the main change affecting soot particle number concentration and size is their mutual coagulation. For neutral particles, at the temperature considered (T =1500−2000 K), the coagulation coefficientki jis of the order of 5×10⁻⁹cm3s−1. For charged particles,
10
this coagulation coefficient decreases for collisions of like charged and increases for collisions between oppositely charged particles. The coagulation coefficient ki jpq for particles of radiusai andaj carryingpandqcharges is given by (Seinfeld and Pandis,
1998):
ki jpq=ki j/Wijpq (3a)
15
whereWi jpq is a correction factor given by:
Wi jpq = exp(ww)−1, (3b)
with
w= pqe
2
(ai +aj)kT (3c)
whereeis the charge of the electron andk is Boltzmann’s constants. Forp=|q|=5,
20
the correction factor for opposite charges is of the order of (1/Wi jpq ≤14, leading to a
ACPD
2, 2045–2074, 2002Emission by aircraft engines
A. Sorokin et al.
Title Page Abstract Introduction Conclusions References
Tables Figures
◭ ◮
◭ ◮
Back Close
Full Screen / Esc
Print Version
Interactive Discussion
c
EGU 2002
This characteristic timescale (time at which the initial concentration is divided by 2) is 2/ki jNs◦ ≈ 100 ms ≫ tres ≈ 1−10 ms. The soot particle concentration may then
be considered as approximately constant in the combustor, behind the primary zone. The evolution of their number concentration in the remaining part of the engine is then governed by the expansion of the exhaust gases in the turbine and in the nozzle. As a
5
result, the soot concentration in the combustor,Ns◦, may be estimated by:
Ns◦≈Nsex×πc×(Tex/Tc) (4)
whereπc ≈ 20−40 is a typical overall pressure ratio and where Tex (≈600–650 K) andTc (≈1100–1600 K) are respectively the temperature at the nozzle and
combus-tor exit (Schumann et al., 2001). Thus in the combuscombus-tor the estimated soot particles
10
concentration is of the order ofNs◦ ≈7×10⁶−2×108cm−3.
2.4. Charging of soot particles
Soot particles may lose or gain charges through electron thermo-emission, electron or ion attachment. The rate of electron thermo-emissionJe,pfrom a soot surface depends
on the temperature, on the charge and size of the soot particle (e.g. Ball and Howard,
15
1971):
Je,p =4πa2AT2exp(−W
I/kT) (5a)
In this expression,WI =W +e2(p+3/8)/a is the electron work function for a soot
particle having a radiusaand carrying a chargep,W is the work function of the bulk andAis a constant given by:
20
A=4πmek2/h3=7.494×1020cm−2s−1K−2 (5b)
where me is the mass of the electron and h is Plank’s constant. For the bulk soot
considered as graphite,W =4.35 eV (Lawton, 1968; Ball and Howard, 1971).
Following Natanson (1960) (see also Rapp, 2000), the capture rate ki s (or attach-ment coefficient) of a given ioni (including electron) by particles in the nanometer size
ACPD
2, 2045–2074, 2002Emission by aircraft engines
A. Sorokin et al.
Title Page Abstract Introduction Conclusions References
Tables Figures
◭ ◮
◭ ◮
Back Close
Full Screen / Esc
Print Version
Interactive Discussion
c
EGU 2002
range is given by the following formulas (in units of cm3/s), depending on whether or not the particle is neutral, carries the same charge than the ion or an opposite charge (the ion carry a single charge while soot particles carrypcharges). Formula (6a)–(6c) apply respectively to the rate of attachment to neutral particle, rate of attachment with unlike charges and rate of attachment with like charges:
5
ki s=πa2vc
i
1+
q
πe3/2kT a
(6a)
ki s,p=πa2ci "
1+|p|e
2 kT a +
16 81
|p|e2 kT λi
|p|e2
kT a
2#
(6b)
ki s=πa2c
ig2exp "
−|p|e
2 gkT a
1− 1
2g(g2−1)|z|
#
(6c)
In these formula, ci is the mean thermal velocity of ioni,λ is the mean free path
of ions (or electrons). In Eq. (6c) the parameter g = ao/a, where ao is the distance
10
between the particle centre and the location where repulsive Coulomb force and at-tractive image force cancel (for more details, see Natanson, 1960; Hoppel and Frick, 1986).
2.5. Electron-neutral molecules attachment rates
The concentration of electrons in the burnt gases decays mainly by electron attachment
15
to neutral molecules (kea). It is obvious that kea depends on the temperature and on
the nature of the molecule to which the electron attach.
By analogy with the hydrocarbon fuel burning flames (e.g. Fialkov, 1997) it is rea-sonable to assume that the first negative ions are formed by three-body attachment of electrons to oxygen molecules:
20
ACPD
2, 2045–2074, 2002Emission by aircraft engines
A. Sorokin et al.
Title Page Abstract Introduction Conclusions References
Tables Figures
◭ ◮
◭ ◮
Back Close
Full Screen / Esc
Print Version
Interactive Discussion
c
EGU 2002
The reported forward rate coefficient adopted for this study (Gerhardt and Homann, 1990) is kea ≈ 1.4×10⁻²⁹(300/T) exp(−600/T) cm6/s. For the typical temperature
range in the combustor (T ≈ 1500 − 2200 K) this coefficient equals kea ≈ 1.7 ×
10−30cm6/s. Note, that at these high temperatures the reverse reaction of electron de-attachment may become noticeable (Kossyi et al., 1992), but the further
transfor-5
mations of O−2 to other negative ions is faster than this reverse reaction. Since in our model we cannot deal with the detail knowledge of the ionic species, these further transformations will be ignored.
2.6. Electron-ion and ion-ion recombination
Again, by analogy with hydrocarbon fuel burning flames, it is reasonable to consider
10
H3O+ as the dominant (secondary) positive ion downstream of the combustion zone. This ion is formed by the well known chemi-ionization reaction CH∗+O→HCO++e−, followed by proton transfer according to HCO+ +H2O → H3O+ +CO and H3O+ + e− => H+H+OH. In the present work we have used the value of the electron-ion recombinatelectron-ion rate kei measured by Guo and Goodings (2000) for H3O+/e
−
in
15
H2-O2-N2 flames in a temperatures range 1820–2400 K. The derived value is kei =
(0.0132 ±0.0004)×T−1.37±0.05 leading to 4.6×10⁻⁷cm3/s at 1800 K, a value very close to that reported by Butler and Hayhurst (1996), i.e. 5.2×10⁻⁷cm3/s. These values are also very close to that concerning NO+, another possible major positive ion in the burnt gases, i.e. 4.2×10⁻⁷cm3/s at 2600 K (Hayhurst and Kittelson, 1978),
20
leading to 5.04×10⁻⁷at 1800 K if one assumes the theoretically expected temperature dependenceT−1/2(Bates, 1950 and Smirnov, 1983).
The ion-ion recombination rateki i, (cm3s−1) as will be shown below, is of major
im-portance to determine the ion number concentration at the nozzle exit of an engine. Unfortunately, literature data on values of ki i are scarce, especially for the
temper-25
ACPD
2, 2045–2074, 2002Emission by aircraft engines
A. Sorokin et al.
Title Page Abstract Introduction Conclusions References
Tables Figures
◭ ◮
◭ ◮
Back Close
Full Screen / Esc
Print Version
Interactive Discussion
c
EGU 2002
for reactions A++B−+M→AB+M have a strong temperature dependence and may be represented by:
ki i(T)=a
300
T
+b[M]P
P0
300
T
n
(8)
wheren= 3.5 or 4 (Beig and Brasseur, 2000; M ¨atzing, 1991), P and P0 are net and
standard pressure respectively and where [M] is the density of the third body in units of
5
cm−3(at 300 K and atmospheric pressure, M≈2.41 1019cm−3). This formula includes both the rates of bimolecular and termolecular neutralisation (e.g. Smith and Adams, 1982; Bates, 1982, 1985). Note that Eq. (8) includes already the variation of [M] with temperature.
M ¨atzing (1991) proposed the following values: n = 3.5, a = 4 10−7cm3s−1 and
10
b = 3.0 10−25 leading to ki i = 9.22 10−7 at 600 K and 1.77 10−7cm3s−1 at 1800
K while Beig and Brasseur (2000) proposed n = 4, a = 6 10−8cm3s−1 and b =
1.25 10−25cm6s−1leading toki i =2.42 10−7at 600 K and 2.70 10−8cm3s−1at 1800
K. These last values are about 4–7 times smaller than those given by M ¨atzing. Re-cently, Guo and Goodings (2000) have measuredki i as a function of temperature for
15
H3O+ ions with Cl−, Br− and I− at flame temperatures (1820–2400 K). The obtained
values ofki i (calculated with their formulas), which are nearly independent of the ion pairs, lie between the predicted values of M ¨atzing and of Beig and Brasseur in the temperature range 1100–2000 K. In the present study, we will adopt the predictions of M ¨atzing as an upper limit for ki i, and those of Beig and Brasseur as a lower limit in
20
our temperature range. Note that in a previous study (Sorokin and Mirabel, 2001), we generated our own values ofki i for a temperature range 280–650 K, but these values
seem to be too high if extrapolated to higher temperatures. However, the concentra-tions calculated with this set of values are very closed to those calculated using the M ¨atzing’s compilation.
ACPD
2, 2045–2074, 2002Emission by aircraft engines
A. Sorokin et al.
Title Page Abstract Introduction Conclusions References
Tables Figures
◭ ◮
◭ ◮
Back Close
Full Screen / Esc
Print Version
Interactive Discussion
c
EGU 2002
3. Results and discussion
3.1. Input parameters
For the reference case, the model was run with the following parameters. In the com-bustor, the pressure Pc is constant and given by Pc = πcPa with an overall pressure ratioπc =30, the temperature varied fromT =2200 in the flame front toTc =1200 K
5
at the combustor exit. The maximum chemi-ionisation rate (here Qo = 10
17
cm−3 s-1) takes place in the flame front located atτc = 10−6s and the total duration of the chemi-ionisation process is 2τc. Finally, the residence time, passed the flame front is 5 ms.
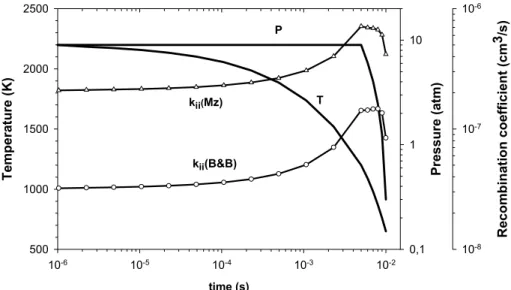
In the post-combustion zone, the temperature and pressure varied according to the
10
simple law given by Tremmel and Schumann (1999), i.e. the temperature decreases linearly with time from Tc = 1200 K to Tex = 650 K while the pressure varies as an
hyperbolic function of time, betweenPc =9 andPa =0.3 atm., the ambient pressure.
The mean residence time was taken as 5 ms. The variation ofT,P and of ki i, one of the most crucial parameter, as a function of time in the combustor and post-combustion
15
zone are shown in Fig. 1.
3.2. CI concentration in the absence of soot particles
Lets first consider the hypothetical case when no soot particles are present i.e. when
Ns(t =0) =0. This case will allow to assess an upper level for the CI concentrations
at the nozzle exit and it will also show later, the influence of soot particles on this
20
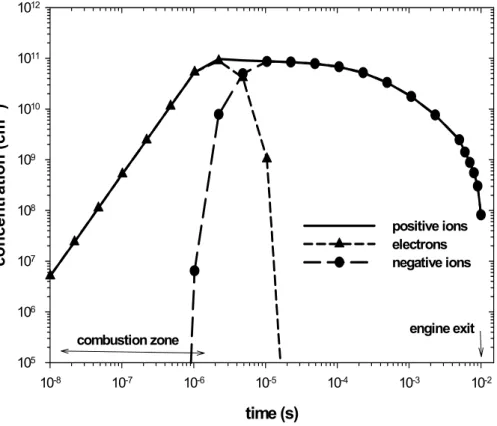
level. The results forNs =0 are depicted in Fig. 2. As expected, the maximum of CI concentration (electrons and positive ions) is located just behind the flame front, at the end of the combustion zone. WithQo=1017cm−3s−1, the maximum ion concentration
(for each sign) is of the order of 1011cm−3. Just before this maximum, the primary electrons very rapidly attach to oxygen molecules, the most abundant neutral species
25
ACPD
2, 2045–2074, 2002Emission by aircraft engines
A. Sorokin et al.
Title Page Abstract Introduction Conclusions References
Tables Figures
◭ ◮
◭ ◮
Back Close
Full Screen / Esc
Print Version
Interactive Discussion
c
EGU 2002
while at the same time the concentration of O−2 also rises very steeply. The electron attachment rate to neutral molecules (usingA=3.7 1019cm−3and the oxygen volume fraction γO2 = 0.15) is keaγO2A
2
≈ (3−7)108s−1, i.e. the typical time for electron attachment to O2 molecules is of the order of 10−9s which is much smaller than the residence time in the post-flame region and therefore in this region it can be assumed
5
thatn− ≈n+ =ni.
If furthermore we assume, for simplicity, the constancy of the ion-ion recombination coefficient, the ion concentration may be described by the simple equationd ni/d t =
−ki in2i with the initial conditionni(t=0)=n0i. The solution of this equation is:
ni(t)≈ n
0
i
1+n0iki it (9)
10
In spite of its simple form, this solution shows some interesting features. In particular, it shows that ifn0ikiit ≫ 1, then the ion concentration is independent of the initial ion concentration, i.e. independent ofQo:
ni(t)≈ 1
ki it (10)
This result is valid when the time exceeds a characteristic time scale, i.e. when
15
t > τi i ≈0.01 ms forn
0
i =10
12
and fort >1 ms forn0i =1010cm−3, as it was observed in flames (Fialkov, 1997; Goodings et al., 1979). It is interesting to note that when this solution applies, the detailed information about the ions in the flame front is not needed if one is interested only by the total ion concentrationnc at the exit of the combustor,
because of the independence ofni(t) onnoi. At the combustor exit:
20
nc(τres)=(ki iτres)−1 (11)
Using τres = 5 ms and an average value of ki i = 1.43×10⁻⁷cm3s−1 (this value
ACPD
2, 2045–2074, 2002Emission by aircraft engines
A. Sorokin et al.
Title Page Abstract Introduction Conclusions References
Tables Figures
◭ ◮
◭ ◮
Back Close
Full Screen / Esc
Print Version
Interactive Discussion
c
EGU 2002
represents a lower limit for ki i), the maximum ion concentration of each sign at the combustor exit, calculated from Eq. (11), is about 1.4×109cm−3. In fact, the use of the numerical model (Eq. 1) which takes into account the variation ofki iwithT andP leads
to 2.5×109cm−3 at the combustor exit. During the further flow in the dilution zone, ion-ion recombination leads to additional decrease of the ion concentrations. However
5
this effect is small compared to the dominant effect of the expansion of the exhaust volume. Finally one can get a good estimate of the upper level of the ion concentration
nex at the nozzle exit and of the emission index of ionsE Ii (number of ions per kg of fuel) by applying the simple law of exhaust expansion (see Eq. 4) combined with the ion concentration at the combustor exit:
10
nex ≈ ncTc
Texπc =
Tc ki iτresTexπc
(12)
and
E Ii ≈
TcNfRG
kiiτresµaPaπc (13)
whereNf is the initial exhaust dilution ratio (Nf ≈70),RGis the gas constant andµais the molecular weight of air (µa=29 g/mole). It is interesting to note that these formula
15
depends only on well-known parameters of the engine and onki i. For the conditions
of our reference case and forki i deduced from Beig and Brasseur, the maximum ion concentration of one sign at the nozzle exit and the maximum ion emission index are
nex = 8.6×10
7
cm−3 and E Ii = 3.7×10
16
. If the compilation of M ¨atzing (1991) is used, these values translate to nex = 1.72×107cm−3 and E Ii = 0.74×10¹⁶ (for
20
ki i =7.13 10−7cm3/s).
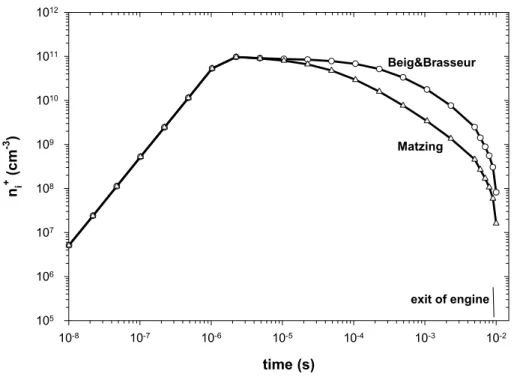
Figure 3 depicts the results given by the numerical model (Eq. 1) which takes into account the variation ofki i with temperature. The curves have been generated using
the values of the two compilations forki i. If the compilation of Beig and Brasseur (2000) is used,nex =8.2×107cm−3and this value represents probably an upper limit. If the
ACPD
2, 2045–2074, 2002Emission by aircraft engines
A. Sorokin et al.
Title Page Abstract Introduction Conclusions References
Tables Figures
◭ ◮
◭ ◮
Back Close
Full Screen / Esc
Print Version
Interactive Discussion
c
EGU 2002
compilation of M ¨atzing (1991) is used,nex =1.6×107cm−3(nex determined with the compilation of Sorokin and Mirabel, 2001 corresponds within 13% to that of M ¨atzing). It is interesting to note that the results given by the simplified model (Eq. 11–12) are in good agreement with those provided by the numerical model.
Although approximate, Eqs. (9)–(12) give a good idea of the parameters which have
5
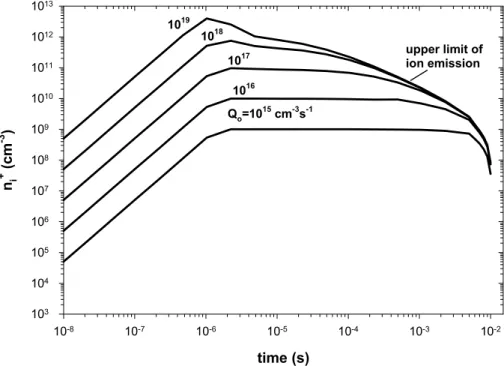
a strong influence onnex, i.e. ki i andncwhich itself depends uponQo,τres,πc,Tcand Tex. The influence ofki i in the model results has already been discussed above, and we now examine the influence ofQo. For this, the model was run with different values of
Qovarying from 10
15
to 1019cm−3s−1and the results are shown on Fig. 4. This figure clearly shows, as predicted by Eq. (10), that for a sufficiently high chemiionisation
10
rate (Qo ≥ 1016cm−3s-1) the ion-ion recombination process leads to an asymptotic behaviour for the ion concentrations at the combustor exit (t=5 ms) and therefore the ion concentrations at the nozzle exit is independent ofQo.
The model results confirm, as predicted by Eq. (12), the dependence of nex on
τres, Tc, Tex and πc. For example, the variation of τres from τres = 5 ms to 2.5 and
15
10 ms leads to nex = 1.3×10⁸ and 5.1×107cm−3 with the model, while Eq. (12)
gives 1.6×10⁸ and 4.1×107cm−3, respectively. Increasing the temperature at the combustor exit fromTc=1200 to 1500 K leads tonex=1.55×10
8
cm−3while Eq. (12) gives 2.0×10⁸. Similarly, decreasing the nozzle exit temperature fromTex = 650 to
500 K leads tonex =0.93×108cm−3 instead of 1.07×108cm−3. Finally, the model
20
calculations confirm the dependence ofnex on the combustor pressure ratioπc. The
model results predict that the increase ofπc from 20 to 30 leads to a decrease of ion
emission fromnex =1.6×10⁸ to 8.2×107cm−3 while Eq. (12) gives 1.7×10⁸ and 8.6×10⁷, respectively. This diminution of nex when πc is increased shows that the effect of pressure is larger on the recombination rates than on the production rates.
25
ACPD
2, 2045–2074, 2002Emission by aircraft engines
A. Sorokin et al.
Title Page Abstract Introduction Conclusions References
Tables Figures
◭ ◮
◭ ◮
Back Close
Full Screen / Esc
Print Version
Interactive Discussion
c
EGU 2002
3.3. CI concentration in the presence of soot particles
Soot particles are now introduced with a monodisperse size and with a fixed number density Ns = 10
8
cm−3. However, the radius a itself was varied from 10 to 30 nm, leading to a soot particle loading in range 0.75–20.4 mg/m3at the combustor exit and 0.05–1.3 mg/m3at the engine exit (soot concentration at the nozzle exit is of the order
5
of 107cm−3). These values are consistent with measurements for real aero-engines (Brocklehurst et al., 1997; Dopelheuer and Wahl, 2001). Note that the surface area of particles increases approximately by a factor of 2 when the radius changes from 20 to 30 nm.
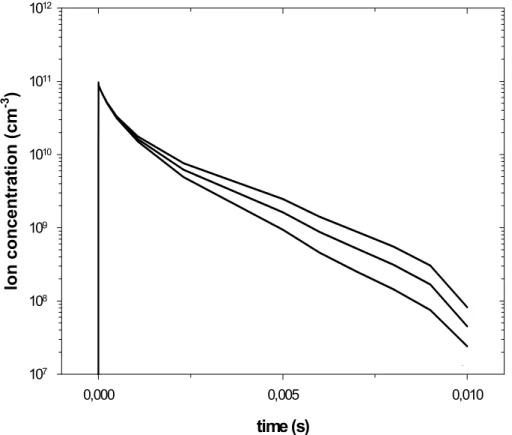
The calculations, shown in Fig. 5, have been performed with a maximal value of
10
the chemiionisation rate Qo = 1017cm−3s−1 and with the the ion-ion recombination coefficients ki i taken from Beig and Brasseur (2000). The use of these coefficients
lead to the maximum values of nex at the nozzle exit. In Fig. 5, we compare the
results obtained without soot particles (a = 0) with those obtained in the presence of soot particles with radius a = 20 and 30 nm. The exit concentration of chemi-ions
15
(of one sign) varies from nex = 8.6×107cm−3 in the absence of soot particles to nex =4.5×107cm−3fora=20 nm (E Ii =1.9×10¹⁶) and tonex =2.6×107cm−3for
a=30 nm (E Ii =1.1×10¹⁶), i.e. the presence of soot particles decreases the chemi-ion concentratchemi-ion by a factor 1.8 to 3.2 compare to the situatchemi-ion without particles. It is also interesting to note that the ion concentrations decrease roughly by a factor 2 when
20
the surface area of particles is doubled and that the interaction between ions and soot particles becomes important only for times larger than about 2 ms, i.e. in the dilution zone of the combustor. At this time, soot particles are already formed and we can conclude that the inclusion of a detailed mechanism for soot formation will not change our estimate for the upper level of the CI emission.
25
ACPD
2, 2045–2074, 2002Emission by aircraft engines
A. Sorokin et al.
Title Page Abstract Introduction Conclusions References
Tables Figures
◭ ◮
◭ ◮
Back Close
Full Screen / Esc
Print Version
Interactive Discussion
c
EGU 2002
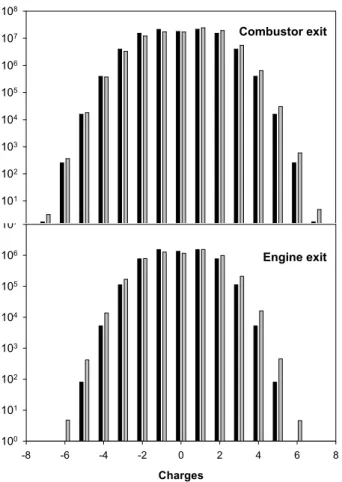
distribution depends on the values assumed for the ion-ion recombination coefficient
ki i. If the compilation by Beig and Brasseur is used, the relative fractions of positively,
negatively charged or neutral particles arefs+=fs− =41.1%,fs0=17.8%, respectively
at the combustor exit andfs+ =fs− =39.1%, fs0 =21.8% at the nozzle exit. If, on the contrary, M ¨atzing’s compilation is used, a dissymmetry appears between positive and
5
negative charges. In this case,fs+=49.8%,fs− =33.2%,fs0=17.0% at the combustor
exit and fs+ = 44.7%, fs− = 36.4%, fs0 = 18.9% at the nozzle exit. Soot particles are then, on the average positively charged, with a mean charge of the order of 0.13 elementary charges.
The excess of positive charges on soot particles may be compensated by some
10
excess negative ions in the exhaust, to keep the total electro-neutrality. However the differences of mobility between gaseous ions and charged soot particles may lead to the electrization of some aircraft elements (Vatazhin et al., 1983).
3.4. Application: comparison with on ground measurements
Very few measurements of CI are available to verify our model. Arnold et al. (2000)
15
measured the total CI concentration in the exhaust plume of the ATTAS aircraft on the ground. The ATTAS is a mid-sized jet aircraft equipped with two Rolls-Royce SNECMA M45H engines.
The measurements were performed just behind the hot potential core, at three dis-tances from the nozzle exit in the exhaust plume: d = 1.39, 2.19 and 4.19 m. The
20
parameters needed for the calculations were taken, as follows (Schumann et al., 2002):
Pa=1 atm,πc=16.5,Tex =683 K, emission index of soot particlesE IS =0.13 g/kg(fuel)
or 1.6×10¹⁵particles/kg(fuel). UsingNf =70,a≈22 nm one obtainsNs≈108cm−3. The residence times in the combustor and post-combustor zone are τres ≈ 3.8 and
τex ≈5.2 ms, respectively. Since the volume of the combustion chamber also includes
25
ACPD
2, 2045–2074, 2002Emission by aircraft engines
A. Sorokin et al.
Title Page Abstract Introduction Conclusions References
Tables Figures
◭ ◮
◭ ◮
Back Close
Full Screen / Esc
Print Version
Interactive Discussion
c
EGU 2002
the combustor was taken as (2/3)τres(Lefebvre, 1985; Kuznetsov, 1983). Unfortunately
the temperature of the exhaust gases at the combustor exit is not known for the case of the ATTAS aircraft on the ground, but a simple calculation from a heat budget shows that in flight such a temperature is about 1155 K (Schumann et al., 2002). Calculations were then made for several values ofTc in the range 1155–1500 K. The calculations
5
made with these parameters give, for the concentration of ions of one sign at the noz-zle exit nex ≈ (0.8−2)×108cm−3 for Tc in the range 1155–1500 K. These results are in excellent agreement with those provided by the theoretical analysis (Sorokin and Mirabel, 2001) of the measurements made by Arnold et al. (2000).
4. Summary and conclusion
10
A numerical model has been developed to predict the formation and evolution of chemi-ions in an aircraft engine. The model includes the formation of primary electrons and positive ions by chemiionisation, electron attachment to neutral gas species, ion-ion recombination, interaction of electrons and ions, thermo-emission from the soot sur-faces in the high-temperature region of the combustor. It also examines the interaction
15
between emitted electrons, ions and soot surfaces leading to the charging of soot par-ticles.
The model results, i.e. the concentration of chemiions at the combustor exit and at the nozzle exit of the engine depend directly on the ion-ion recombination rate, for which the data are scarce at the temperatures prevailing in a jet engine.
20
The interaction of ions with soot particles may lead to a 50% decrease of the exit ion concentration, compare to the situation without particles. A consequence of ion-soot interaction is that most of ion-soot particles at the nozzle exit are charged and the concentration of neutral soot particles is only of the order of 20%. The remaining fraction of the particles are charged, with an important fraction carrying up to 5–6
25
elementary charges.
ACPD
2, 2045–2074, 2002Emission by aircraft engines
A. Sorokin et al.
Title Page Abstract Introduction Conclusions References
Tables Figures
◭ ◮
◭ ◮
Back Close
Full Screen / Esc
Print Version
Interactive Discussion
c
EGU 2002
emission index is in the rangeE Ii =(2−4)×1016ions of both signs per kg of fuel.
Acknowledgement. Support of this work by the European Community through contract G4RD-CT-2000-00207 (PARTEMIS) and by the INTAS project OPEN 2000-460 is gratefully acknowl-edged.
References
5
Arnold, F., Wohlfrom, K. H., Klemm, M. W., Schneider, J., Gollinger, K., Schumann, U., and Busen, R.: First gaseous ion composition measurements in the exhaust plume of a jet aircraft in flight: Implication for gaseous sulfuric acid, aerosols, and chemiions, Geophys. Res. Lett., 25, 2137–2140, 1998.
Arnold, F., Kiendler, A., Wiedemer, V., Aberle, S., Stilp, T., and Busen, R.: Chemiion
concen-10
tration measurements in jet engine exhaust at the ground: Implications for ion chemistry and aerosol formation in the wake of a jet aircraft, Geophys. Res. Lett., 27, 1723–1726, 2000. Ball R. T. and Howard, J. B.: Electric charge of carbon particles in flames, Thirteenth
Sympo-sium (International) on Combustion, The Combustion Institute, p. 353–362, 1971.
Bates, D. R.: Recombination of small ions in the troposphere and lower stratosphere, Planet
15
Space Sci., 30, 101–108, 1982.
Bates, D. R.: Ion-ion recombination in an ambient gas, Adv. At. Mol. Phys., 20, 1–40, 1985. Beig, G. and Brasseur, G. P.: Model of tropospheric ion composition: A first attempt, J.
Geo-phys. Res., 105, 22 671–22 684, 2000.
B ¨ohme, D. K.: Chemical ionization in flames, in: Ion molecular reactions, Plenum Press, N.Y.,
20
p. 323–343, 1972.
B ¨ohme, D. K.: Experimental studies of positive ion chemistry with flow tube mass spectrometry: birth, evolution, and achievements in the 20th century, Int. J. Mass Spectrometry, 200, 97– 136, 2000.
Brocklehurst, H. T., Priddin, C. H., and Moss, J. B.: Soot predictions within an aero gas turbine
25
combustion chamber, American Society of Mechanical Engineers, 97-GT-148, June 1997. Burtscher, H., Reis, A., and Schmidt-Ott, A.: Particle charge in combustion aerosols, J. Aerosol
ACPD
2, 2045–2074, 2002Emission by aircraft engines
A. Sorokin et al.
Title Page Abstract Introduction Conclusions References
Tables Figures
◭ ◮
◭ ◮
Back Close
Full Screen / Esc
Print Version
Interactive Discussion
c
EGU 2002 Butler C. J. and Hayhurst, A. N.: Kinetics of dissociative recombination of H3O+ions with free
electrons in premixed flames, J. Chem. Soc. Faraday Trans., 92, 707–714, 1996.
Calcote, H. F.: Ion production and recombination in flames, Eight Symposium (Int.) on Com-bustion, Williams and Wilkins, p. 184-199, 1962.
Calcote, H. F. and Keil, D. G.: Ion-molecule reactions in sooting acetylene-oxygen flames,
5
Comb. Flame, 74, 131–146, 1990.
Dopelheuer, A. and Wahl, C.: Determination of quantities and properties of aircraft engine generated soot, Air Pollution Research Report 74, Aviation, aerosols, contrails and cirrus clouds (A2C3), Proceedings of a European workshop, Frankfurt, Germany, pp. 91–94, July, 2000.
10
Eraslan, A. N. and Brown, R. C.: Chemiionization and ion-molecule reactions in fuel-rich acety-lene flames, Comb. Flames, 74, 19–37, 1988.
Fahey, D. W., Keim, E. R., Boering, K. A., et al.: In situ observations in aircraft exhaust plumes in the lower stratosphere at midlatitudes, J. Geophys. Res., 100, 3065–3074, 1995.
Fialkov, A. B.: Investigation on ions in flames, Prog. Energy Comb. Sci., 23, 399–528, 1997.
15
Frenzel, A. and Arnold, F.: Sulphuric acid cluster ion formation by jet engines: Implications for sulphuric acid formation and nucleation, In: Proc. Intern. Scientific Coll. On Impact from Aircraft and Spacecraft upon the Atmosphere, K ¨oln 1994, DLR-Mitt. 94-06, 106–112, 1994. Gerhardt P. and Homann, K. H.: Ions and charged soot particles in hydrocarbon flames III:
neg-ative ions in fuel-rich acethylene/oxygen flames, Ber. Bunsen-ges. Phys. Chem., 94, 1086–
20
1096, 1990,
Green, J. A. and Sugden, T. M.: Some observation on the mechanism of ionization in flames containing hydrocarbons, Ninth Symposium (Int.) on Combustion, Williams and Wilkins, pp. 607–621, 1963.
Goodings, J. M., B ¨ohme, D. K., and Ng, C.-W.: Detailed ion chemistry in methane-oxygen
25
flames. II. Negative ions, Comb. Flame, 36, 45–62, 1979.
Guo, J. and Goodings, J. M.: Recombination coefficients for H3O+ ions with electronse−and with Cl−, Br− and I− at flame temperatures 1820–2400 K, Chem. Phys. Lett., 329, 393–398, 2000.
Hayhurst, A. N. and Kittelson, D. B.: The positive and negative ions in oxy-acetylene flames,
30
Comb. Flame, 31, 37–51, 1978.
ACPD
2, 2045–2074, 2002Emission by aircraft engines
A. Sorokin et al.
Title Page Abstract Introduction Conclusions References
Tables Figures
◭ ◮
◭ ◮
Back Close
Full Screen / Esc
Print Version
Interactive Discussion
c
EGU 2002 Hu, D., Braun-Unkhoff, M., and Frank, P.: Early stage of soot formation at elevated pressures,
Air Pollution Research Report 74, Aviation, aerosols, contrails and cirrus clouds (A2C3), Proceedings of a European workshop, Frankfurt, Germany, p. 85–90, July, 2000.
IPCC: (Intergovernmental Panel of Climate Change). Aviation and the Global Amosphere, (Eds) Penner, J., Lister, D., Griggs, D., Dokken, D., and McFarland M., Cambridge University Press,
5
Cambridge, U.K., 1999.
K ¨archer, B., Yu, F., Schr ¨oder, F. P., and Turco, R. P.: Ultrafine aerosol particles in aircraft plumes: Analysis of growth mechanisms, Geophys. Res. Lett., 25, 2793–2796, 1998.
Kiendler, A., Aberle, S., and Arnold, F.: Positive ion chemistry in the exhaust plumes of an aircraft engine and a burner: investigations with a quadrupole ion trap mass spectrometer,
10
Atmos. Environ., 34, 4787–4793, 2000a.
Kiendler, A., Aberle, S., and Arnold, F.: Negative chemiions formed in jet fuel combustion: New insights from jet engine and laboratory measurements using a novel quadrupole ion trap mass spectrometer apparatus, Atmos. Environ., 34, 2623–2632, 2000b.
Kiendler, A. and Arnold, F.: Improved composition measurements of negative chemiions in
air-15
craft jet engine exhaust: unambiguous identification of sulphuric acid clustering via sulphur-isotopes, Geophys. Res. Lett., submitted, 2001.
Kossyi, I. A., Kostinsky, A. Yu., Matveyev, A. A., and Silakov, V. P.: Kinetic scheme of the non-equilibrium discharge in nitrogen-oxygen mixtures, Plasma Sources Sci. Technol., 1, 207–220, 1992.
20
Kuznetsov V. R.: Nitric oxides formation in gas turbine combustors, Proc. of Central Institute of Aviation Motors, 1086, Moscow, 1983.
Lawton J.: Rates of charging of small thermo ionic particles in a space charge, Comb.Flame, 12, 534–540, 1968.
Lawton, J. and Weinberg, F.: Electrical aspects of combustion, Oxford Univ. Press, 1969.
25
Lefebvre A. H.: Gas turbine combustion, N.Y., McGraw-Hill, 1985.
Mattingly J. D., Heiser, W. H., and Daley, D. H.: Aircraft Engine Design, AIAA Education Series, N.Y., 1987.
M ¨atzing, H.: Chemical kinetics of flue gas cleaning by irradiation with electrons, Part II, Adv. Chem. Phys., 80, 315–359, 1991.
30
Natanson, G. L.: The theory of the charging of sub-micron aerosol particles by gaseous ions, Sov. J. Tech. Phys. (Engl. Transl.) 5, 538–551, 1960.
ACPD
2, 2045–2074, 2002Emission by aircraft engines
A. Sorokin et al.
Title Page Abstract Introduction Conclusions References
Tables Figures
◭ ◮
◭ ◮
Back Close
Full Screen / Esc
Print Version
Interactive Discussion
c
EGU 2002 A. N., and Panfilov, V. N.: Coulomb interactions in soot particle formation, J. Aerosol Sci, 32,
S71, 2001.
Pederson, T. and Brown, R. C.: Simulation of electric field effects in premixed methane flames, Comb. Flames, 94, 433–448, 1993.
Rapp M.: Capture rates of electrons and positive ions by mesospheric aerosol particles, J.
5
Aerosol. Sci., 31, 1367–1369, 2000.
Schumann, U., Arnold, F., Busen, R., Curties, J., Kaercher, B., Kiendler, A., Petzold, A., Schlager, H., Schroder, F., and Wohlfrom, K.-H.: Influence of fuel sulfur on the compo-sition of aircraft exhaust plumes: The experiments SULFUR 1-7, J. Geophys. Res., 107, doi:10.1029/2001JD000813, 2002.
10
Seinfeld, J. H. and Pandis, S. P.: Atmospheric chemistry and physics, N.Y., Wiley, 1998. Smith, D. and Adams, N. G.: Ionic recombination in the stratosphere, Geophys. Res. Lett., 9,
1085–1087, 1982.
Sorokin, A. and Mirabel, P.: Ion recombination in aircraft exhaust plumes, Geophys. Res. Lett., 28, 955–958, 2001.
15
Starik, A. M., Savel’ev, A. M., Titova, N. S., and Schumann, U.: Modeling of sulfur gases and chemiions in aircraft engines, Aerosp. Sci. Techn., 6, 63–81, 2002.
Sudarev, A. V. and Antonovski, V. I.: Soot content in a gas turbine combustion chamber, Low Grade Fuels, 2, 36, 431–441, 1990.
Tremmel, H. G. and Schumann, U.: Model simulations of fuel sulfur conversion efficiencies in
20
an aircraft engine: Dependence on reaction rate constants and initial species mixing ratios, Aerosp. Sci. Techno., 3, 417–430, 1999.
Vatazhin, A. B., Grabovski, V. I., Likhter, V. A., and Shul’gin, V. I.: Electro-gas-dynamical flows, Nauka, Moscow, (in russian), 1983.
Yu, F. and Turco, R. P.: The formation and evolution of aerosols in stratospheric aircraft plumes:
25
ACPD
2, 2045–2074, 2002Emission by aircraft engines
A. Sorokin et al.
Title Page Abstract Introduction Conclusions References
Tables Figures
◭ ◮
◭ ◮
Back Close
Full Screen / Esc
Print Version
Interactive Discussion
c
EGU 2002 time (s)
10-6 10-5 10-4 10-3 10-2
Te
m
p
era
tu
re (K)
500 1000 1500 2000 2500
Pre
ssu
re (a
tm
)
0,1 1 10
Re
com
b
ina
ti
on coe
fficie
n
t (cm
3/s
)
10-8
10-7
10-6
T P
kii(Mz)
kii(B&B)
Fig. 1.Evolution of the temperature, pressure and ion-ion recombination coefficientski i for the
ACPD
2, 2045–2074, 2002Emission by aircraft engines
A. Sorokin et al.
Title Page Abstract Introduction Conclusions References
Tables Figures
◭ ◮
◭ ◮
Back Close
Full Screen / Esc
Print Version
Interactive Discussion
c
EGU 2002
time (s)
10-8 10-7 10-6 10-5 10-4 10-3 10-2
co
ncent
ration (
c
m
-3 )
105
106
107
108
109
1010
1011
1012
positive ions electrons negative ions
combustion zone engine exit
Fig. 2.Concentration profiles of the electrons, positive and negative ions in the engine for the
ACPD
2, 2045–2074, 2002Emission by aircraft engines
A. Sorokin et al.
Title Page Abstract Introduction Conclusions References
Tables Figures
◭ ◮
◭ ◮
Back Close
Full Screen / Esc
Print Version
Interactive Discussion
c
EGU 2002 time (s)
10-8 10-7 10-6 10-5 10-4 10-3 10-2
ni
+ (c
m
-3 )
105
106
107
108
109
1010
1011
1012
Beig&Brasseur
Matzing
exit of engine
Fig. 3.Evolution of the concentration of positive ions in the engine for the reference case, using
ACPD
2, 2045–2074, 2002Emission by aircraft engines
A. Sorokin et al.
Title Page Abstract Introduction Conclusions References
Tables Figures
◭ ◮
◭ ◮
Back Close
Full Screen / Esc
Print Version
Interactive Discussion
c
EGU 2002 time (s)
10-8 10-7 10-6 10-5 10-4 10-3 10-2
ni
+ (cm -3 )
103 104 105 106 107 108 109 1010 1011 1012 1013
Qo=1015 cm-3s-1
1016 1017 1018 1019
upper limit of ion emission
Fig. 4. Evolution of the concentration of positive ions in the engine, using different
ACPD
2, 2045–2074, 2002Emission by aircraft engines
A. Sorokin et al.
Title Page Abstract Introduction Conclusions References
Tables Figures
◭ ◮
◭ ◮
Back Close
Full Screen / Esc
Print Version
Interactive Discussion
c
EGU 2002
time (s)
0,000 0,005 0,010
Io
n concent
ration
(cm
-3 )
107
108
109
1010
1011
1012
Fig. 5. Evolution of the concentration of positive ions in the engine, in the absence (upper
ACPD
2, 2045–2074, 2002Emission by aircraft engines
A. Sorokin et al.
Title Page Abstract Introduction Conclusions References
Tables Figures
◭ ◮
◭ ◮
Back Close
Full Screen / Esc
Print Version
Interactive Discussion
c
EGU 2002
0 101 102 103 104 105 106 107 108
Combustor exit
Charges
-8 -6 -4 -2 0 2 4 6 8
100 101 102 103 104 105 106 107
Engine exit
Fig. 6. Concentration of soot particles (cm−3) as a function of their charge at the exit of the