* Corresponding author.
E-mail addresses:[email protected] (R.Anbarasan) © 2013 Growing Science Ltd. All rights reserved. doi: 10.5267/j.ccl.2013.06.002
Contents lists available atGrowing Science
Current Chemistry Letters
homepage: www.GrowingScience.com/ccl
FTIR and thermal studies on esters grafted HDPE
Vellaichamy Parthasarathy a, Viswalingam Dhanalakshmb and Ramasamy Anbarasanb*
a
Department of Physics, Hindustan University, Padur- 603103, Chennai, Tamil Nadu, India b
Department of PolymerTechnology, Advanced Nanotechnology Research Laboratory, Kamaraj College of Engineering and Technology, Virudhunagar - 626001, Tamil Nadu, India
C H R O N I C L E A B S T R A C T
Article history:
Received January 26, 2013 Received in Revised form May 10, 2013
Accepted 4 June 2013 Available online 7 June 2013
HDPE was functionalized with two different esters in an inert atmosphere at 160°C, under different experimental conditions by thermolysis method. The order of the functionalization and crosslinking reactions was determined. The C=C formation peak is assigned at 1610 cm-1.The
percentage of functionalization was determined by FTIR spectroscopy method. Thermogravimetric analysis and differential scanning calorimetric methods were also used to study about the thermal properties of the functionalized HDPE.
© 2013 Growing Science Ltd. All rights reserved.
Keywords:
HDPE Functionalization Grafting FTIR DSC TGA Crosslinking
1. Introduction
(LDPE) by melt grafting with glycidylmethacrylate was reported by Wei et al. and LDPE was grafted with acrylic acid3. Craig et al.4 reported UV-exposed polyolefins such as HDPE, LDPE, LLDPE etc., with improved mechanical properties. The maleic anhydride modified PP was ascertained to mix well with organo-metallic clays to form nano composites with improved thermal properties5. During the functionalization process simultaneous crosslinking is also possible one. Below and coworkers6 reported about the electron beam cross linked PE with very high crack resistance. Grafting of undecylenic acid onto ethylene octane copolymer under molten condition was reported by He et al.7 Melt grafting of N-carboxyl maleamic acid onto LLDPE was reported by Ciolino et al.8. Gaylord and Mehta et al.9 studied the melt grafting process of PE with maleic anhydride monomer. Many experimental conditions including initiator, temperature and time, etc, were studied to determine % of cross linking and degradation that accompanies the grafting reaction10. Recently Anbarasan et al.11 studied the melt functionalization of HDPE with acrylic esters under molten condition. By thorough literature survey, we couldn’t find any report based on order of C=C formation reaction for EM and EAA ester functionalized HDPE in the presence of DCP, under inert condition at 160°C.
2. Experimental
2.1. Materials
High density polyethylene (HDPE) was purchased from Ottokemi, India. In order to remove the antioxidant present in the HDPE sample, it was purified prior to thermolysis reaction. The purification procedure was explained in our earlier publication12 Dicumyl peroxide (DCP, Ottokemi, India), 1,2-dichloro benzene (AR, Loba Chemi, India), Diethylmalonate (EM, CDH, India) and Ethylacetoacetate (EAA, Ottochemi, Inida), Dichloromethane (AR, Merck, India), Acetone (AR, Paxmy, India) and Toluene (Loba Chemi, India) were used without subjecting them to any other purification process.
2.2. Thermolysis reaction
Melt graft functionalization of HDPE with EM and EAA was carried out through thermolysis reaction. The short procedure is illustrated further. Previously purified HDPE was taken in a 25 ml round-bottom flask along with the required amount of ester and equal quantity of DCP were taken in a solution of 6ml of dichloromethane(9ml)/cyclohexane(1ml) mixture. The contents were mixed for 2.5 h at room temperature. After this mixing process, the solvents had been removed with the help of a rotavapour under reduced pressure until a constant mass was obtained. The polymer/peroxide/ester mixture thus obtained was taken in a test tube reactor. The reactor was closed and degassed by the injection of sulphur free nitrogen gas for 30 min and then sealed. The reactor was heated in an oil bath at 160°C for 2.5 h without any stirring. When the reactants melted, the reaction started and led to various processes such as surface graft functionalization, alkenes formation and crosslinking reactions. Then the products were cut into small pieces and dissolved in DCB at 120°C for 2 h. During this dissolution process, the non-crosslinked (ester functionalization part is soluble in DCB solvent whereas the crosslinked polymer is insoluble in DCB. 500 ml of acetone was added to precipitate the soluble and functionalized HDPE. The ester functionalized samples were weighed and stored in a zipper bag.
2.3. Characterization
quantitative determination of percentage grafting, the area of the peak at 1730 and 720 cm-1 was determined and relative intensity was calculated as follows:
Relative intensity of carbonyl (RI) = A1730/A720
Relative intensity of C=C (RI) = A1604/A720
RI[C=O/C-H] W
% Ester grafting = 100
C 1.52
(1)
RI[C=C/C-H] W
% C=C formation = 100
C 0.35
(2)
where, W is the weight of non-cross linked polymer, C is the % weight of peroxide and 1.52 and 0.35 are calibration coefficients taken from our earlier publication13. DSC was recorded for the samples by using SDT 2960 simultaneous TGA and DSC, TA instruments under Nitrogen atmosphere at the heating rate of 10° C/min. The TGA analysis was performed under air purge at the heating rate of 10° C/min by using the SDT 2960 simultaneous TGA and DSC, TA instruments. The % crosslinking was determined by using the following formula:
[Weight of Polymer taken for functionalization]-[Weight of non-crosslinked polymer obtained after functionalization]
% crosslinking = 100
Weight of Polymer taken for functionalization
3. Results and Discussion
In the functionalization of HDPE, two types of esters such as EM and EAA were used. Equal % weight of DCP and esters were used. Functionalization reaction was carried out under different experimental conditions like variation in (% weight of DCP), different temperature and different intervals of time.
3.1. FTIR Characterization
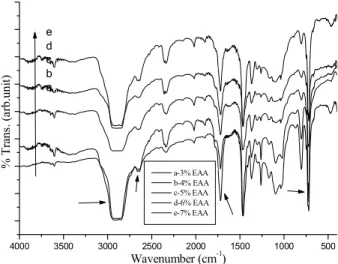
The FTIR spectra of functionalized HDPE with different % weight of EM are shown in Fig 1. Important peaks are discussed below: Peaks between 2600 and 3000 cm-1 are related with the C-H stretching vibrations. The stretching of –C=O- could be seen at 1723 cm-1. The C-H bending vibration is observed at 1490cm-1. A sharp peak at 730cm-1 is associated with the C-H deformations. The new peak, which appeared at the wave number of 1050cm-1, is used to confirm the C-O-C ester linkage. The C=C formation peak is assigned at 1610 cm-1. The remaining peaks correspond to pure HDPE. Fig. 2 illustrated the FTIR spectra of EAA functionalized HDPE under different % weight of EAA. In this system also, the above-mentioned peaks were observed. The FTIR spectra of EM and EAA functionalized HDPE under different temperature and time interval is not shown here.
3.2. Effect of (% weight of DCP) on % functionalization, % crosslinking and C=C formation
4000 3500 3000 2500 2000 1500 1000 500 e d c b a a-3% EM b-4% EM c-5% EM d-6% EM e-7% EM % T ra n s. ( ar b .u n it )
Wavenumber (cm-1)
Fig. 1. FTIR spectrum of EM functionalized HDPE under different % weight of EM
4000 3500 3000 2500 2000 1500 1000 500
e d c b a a-3% EAA b-4% EAA c-5% EAA d-6% EAA e-7% EAA % T ra n s. ( a rb .u n it )
Wavenumber (cm-1)
Fig. 2. FTIR spectrum of EAA functionalized HDPE under different % weight of EAA
0.75 0.80 0.85 0.90 0.9 5 1.00 1 .05 1.10 1.15 1.20
f e d c b a A ,B : lo g (R I[C = O /C H ] ), C ,D : lo g (% C .L ), E ,F : lo g (R
IC=
C /C H ] ) (a .u )
A ,B ,C ,D ,E ,F: 2+log(% w eight of D CP )
Fig. 3. Effect of (% weight of DCP) on (a and b) (RI[C=O/C-H]), (c and d) (% C.L), (e and f) (RI[C=C/C-H])
The slope value was determined as 1.56, which confirmed the 1.50 order of functionalization reaction with respect to (% weight of DCP). The rate of functionalization reaction (Rf) can be written as follows:
Rfα (% weight of DCP)1.50. This explained that 1.50 mol of DCP is required to functionalize one mole
of HDPE. Similar type of plot was made for EAA system as shown in Fig. 3(b). It shows a straight line which proved increase in RI of carbonyl ester. Here the slope value was determined as 1.30. This confirmed 1.25 order of functionalization reaction with respect to (% weight of DCP). The rate of functionalization revealed that 1.25 mole of DCP is required to functionalize one mole of HDPE for EAA system. The % grafting values are listed in Table 1. During the functionalization reaction, crosslinking reaction and C=C formation reactions were competitive. The efficiency of crosslinking was analyzed kinetically for both EM and EAA systems. In order to find the order of crosslinking reaction, a log-log plot was made between log (% weight of DCP) and log (% crosslinking) as shown in Fig. 3(c). The slope value was determined as 0.26 which inferred that 0.25 order of crosslinking reaction with respect to (% weight of DCP). For EAA system, the slope value was found to be 0.25 from Fig. 3(d). This confirmed the 0.25 order of crosslinking reaction with respect to (% weight of DCP). The % crosslinking was dominant than that of % functionalization because of the vigorous coupling nature of HDPE macro radicals. The rate of crosslinking reaction (RC.L) can be written as follows: RC.L α (%
weight of DCP)0.25 for both systems. It means that 0.25 mol of DCP is required to crosslink one mole of HDPE for both EM and EAA. Another possible reaction is C=C formation during the melt functionalization reaction. This formation was confirmed by the presence of Peak at 1610 cm-1. This happened due to the oxidative thermal degradation reaction. Fig. 3(e) represented the plot of log (% weight of DCP) vs log (RI[C=C//C-H]) for EM grafted HDPE system. While increasing the (% weight of
DCP), the % of C=C formation was increased. One recent publication indicated the melt surface grafting of succinimide with HDPE in the presence of DCP, we found that while increasing the % weight of SI, the % C=C formation also increased linearly14. This is in accordance with our results. The slope value was determined as 1.29 which confirmed the 1.25 order of reaction with respect to (% weight of DCP). Similar type of plot was made for EAA grafted HDPE system as shown in Fig. 3(f) and the slope value was noted as 1.54. This confirmed the 1.50 order of double bond formation with respect to (% weight of DCP). The rate of C=C formation reaction (RD.B) can be written as follows: RD.B α (% weight of
DCP)1.25 for EM and RD.B α (% weight of DCP)1.50 for EAA system. It means that 1.25 mole of DCP for
EM and 1.50 mole of DCP for EAA is required to form one mole of olefin bond in HDPE backbone for both EM and EAA. The % crosslinking and C=C formation values are given in Table 1.
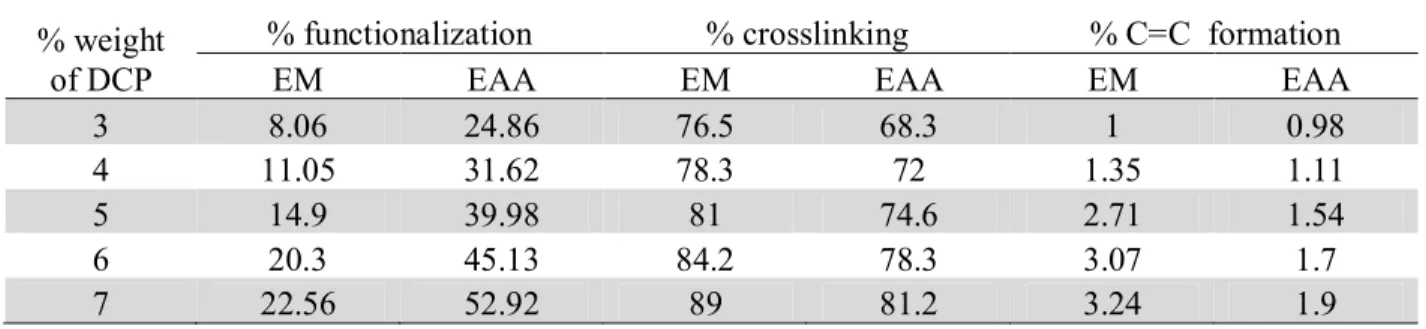
Table 1. Effect of (% weight of DCP) on functionalization, crosslinking and C=C formation
% weight of DCP
% functionalization % crosslinking % C=C formation
EM EAA EM EAA EM EAA
3 8.06 24.86 76.5 68.3 1 0.98
4 11.05 31.62 78.3 72 1.35 1.11
5 14.9 39.98 81 74.6 2.71 1.54
6 20.3 45.13 84.2 78.3 3.07 1.7
7 22.56 52.92 89 81.2 3.24 1.9
3.3. Effect of temperature on % functionalization, % crosslinking and % C=C formation
Generally % ester grafting increased initially and then showed a decreasing trend. Beyond 160°C, the % ester grafting was decreased. This may be due to the formation of unwanted by-products, with very high activation energy at higher temperature. The activation energy (Ea) for functionalization of
EM onto HDPE was determined from the Arrhenius plot i.e., plot of 1/T Vs log (RI[C=O/C-H]) as shown in
Fig. 4(a). The slope was determined and the Ea value was calculated as 250 kJ/mol. Similar type of plot
was calculated as 210 kJ/mol. This revealed that EM consumed more amount of heat energy for functionalization rather than EAA. The lower Ea supported higher % functionalization for EAA than EM
system. The % grafting values are presented in Table 2.
0 . 0 0 2 2 0 0 . 0 0 2 2 5 0 . 0 0 2 3 0 0 . 0 0 2 3 5 0 . 0 0 2 4 0 0 . 0 0 2 4 5 f
e
d
c
b
a
A
,B
:l
o
g
(R
I [C
=
O
/C
H
]
),
C
,D
:
3
+
lo
g
(R
I [C
=
C
/C
H
]
),
E
,F
:
lo
g
(%
C
.L
),
(
a
.u
)
A , B , C , D , E , F : 1 / T ( K - 1)
Fig. 4. Effect of temperature on (a and b) (RI[C=O/C-H]), (c and d) (RI[C=C/C-H]) (e and f) (% C.L) of (a, c
and e) HDPE-DCP-EM and (b, d and f) HDPE-DCP-EAA systems. Time-2 h, % weight of DCP-5%, Weight of HDPE-2.0 g
The effect of temperature on crosslinking of HDPE, in the presence of DCP and ester was tested.
Fig. 4(c) showed the plot of 1/T vs log (% crosslinking) for EM grafted HDPE system. The slope value
was determined and Ea value was found to be 152 kJ/mol. The Same type of plot was made for EAA
system as given in Fig. 4(d) and the Ea value was calculated as 170 kJ/mol. On comparison, EAA
system consumed more amount of heat energy than EM. So the lower Ea value supported higher %
crosslinking for EM than EAA grafted HDPE. Effect of temperature on % C=C formation was analyzed for both esters. Fig. 4(e) showed the plot of 1/T vs log (RI[C=C/C-H]) for EM system and the Ea value was
found to be 110 kJ/mol. Fig. 4(f) showed the same type of plot for EAA system and the slope was calculated as 130 KJ/mol. On critical comparison, one can predict that EAA consumed more amount of heat energy for the formation of C=C than that of EM. The % C=C formation was higher for EM than EAA and this was due to its lower Ea value. Table 2 critically compared the % crosslinking and C=C
formation values for both esters.
Table 2. Effect of temperature on functionalization, crosslinking and C=C formation
Temperature (K)
% functionalization % crosslinking % C=C formation
EM EAA EM EAA EM EAA
413 11.13 36.48 67.5 65 1.88 0.74
423 13.17 42.87 71.5 70 2.65 1.22
433 14.9 55.98 74.3 73.2 2.71 1.94
443 7.03 47.15 80.2 79.5 3.48 2.57
453 3.68 25.11 87.5 82.4 4.11 3.34
3.4. Effect of time on % functionalization, % crosslinking and % C=C formation
Grafting of esters onto HDPE in the presence of DCP was carried out at different intervals of time.
Fig. 5(a) represented the effect of time on RI[C=O/C-H] for EM grafted HDPE system. The plot showed a
radicals resulting with higher % of grafting. The same trend was noticed for the EAA system too as shown in Fig. 5(b).
2000 4000 6000 8000 10000 12000 14000
f e
d c b
a
A
,B
:R
I[C
=
O
/C
H
]
,
C
,D
:
lo
g
(%
C
.L
),
E
,F
:
3
+
R
I[C
=
C
/C
H
]
,
(a
.u
)
A,B,C,D,E,F: Time(sec)
Fig. 5. Effect of time on (a and b) (RI[C=O/C-H]), (c and d) (% C.L), (e and f) (RI[C=C/C-H]) of (a, c and e)
DCP-EM and (b, d and f) DCP-EAA systems. % weight of DCP-5%, Weight of HDPE-2.0 g, Temperature-1600C
Fig. 5(c) and (d) confirmed the increase of % crosslinking with the increase of reaction time. This
happened due to the coupling between HDPE macro radicals. Effect of time on RI[C=C/C-H] for EM and
EAA systems was investigated and represented in Fig. 5(e) and (f) respectively. Here also, when the reaction time is increased, the % of C=C formation is also increased in a linear manner. This may be due to the possible thermal oxidation reaction. The % functionalization, crosslinking and C=C formation values were mentioned in Table 3.
Table 3. Effect of time on functionalization, crosslinking and C=C formation
Time (sec)
% functionalization % crosslinking % C=C formation
EM EAA EM EAA EM EAA
3600 6.07 23.01 72.5 69 0.97 1.17
5400 6.45 37.9 77 73 1.48 1.37
9000 10.06 45.06 81 75.5 2.45 2.34
10800 11.08 52.13 85.5 79.1 3.17 3
12600 13.59 57.85 88 84 4.08 3.71
3.5. DSC Profiles
Melt functionalization of HDPE with different esters such as EM and EAA will lead to the change in physical and chemical properties of HDPE. Fig. 6 represented DSC of EM functionalized HDPE. This thermogram revealed that decrease in Tm value even after the melt functionalization reaction with EM.
chain is one of the possibilities. In the case of crystallization temperature (Tc ), much difference was not
observed. But in the present investigation, nucleation due to grafted EM was not observed.
4 0 6 0 8 0 1 0 0 1 2 0 1 4 0 1 6 0 1 8 0
- 2 0 - 1 0 0 1 0 2 0 3 0
c o o lin g
h e a tin g
e d c b a
a - 3 % E M b - 4 % E M c - 5 % E M d - 6 % E M e - 7 % E M
H
ea
t
fl
o
w
(
m
W
),
E
x
o
u
p
T e m p e ra tu re (0 C )
Fig. 6. DSC of EM functionalized HDPE at different % weight of EM
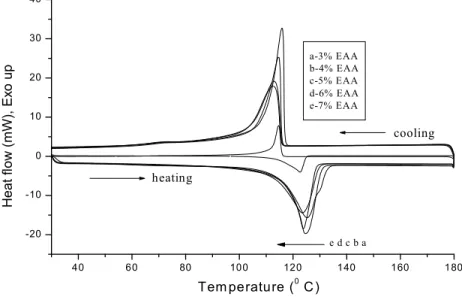
Fig. 7 showed the DSC of different % weight loading of EAA functionalized HDPE system. Here
also, the Tm value decreased while increasing the % weight of EAA. The decrease in Tm value was
thoroughly explained by Campos and Petri15 for the tetrahydrophthalic and maleic anhydride grafted polyolefins in solution. The grafted EAA side chains had influenced the Tc value of HDPE. This
indicated that during the melt functionalization of HDPE with EAA, the crystallinity values were reduced. Further research work on GPC measurement is going on in our laboratory.
40 60 80 100 120 140 160 180
-20 -10 0 10 20 30 40
cooling
heating
e d c b a a-3% EAA b-4% EAA c-5% EAA d-6% EAA e-7% EAA
He
a
t
fl
o
w
(m
W
),
E
x
o
u
p
Tem perature (0 C )
Fig. 7. DSC of EAA functionalized HDPE at different % weight of EAA
3.6. TGA History
extended upto 500°C. This accounts for the main chain scission or degradation. The important point noted here is, while increasing the % weight of EM, the thermal stability of HDPE was slightly affected. Due to the random grafting of EM onto HDPE, the extra thermal stability due to grafted side chain was not observed. The point to be noted here is while increasing the % weight of EM the Tid (initial
degradation) is shifted towards lower temperature with slight decrease in thermal stability of ester functionalized HDPE. Girija et al.16 explained the decrease in thermal stability of LDPE functionalized with maleic ester.
100 200 300 400 500
0 20 40 60 80 100
e d c b a a-EM-3%
b-EM-4% c-EM-5% d-EM-6% e-EM-7%
%
we
ig
h
t
Temperature (o C)
100 200 300 400 500
0 20 40 60 80 100
e d c b a a-EAA-3%
b-EAA-4% c-EAA-5% d-EAA-6% e-EAA-7%
%
w
e
ig
h
t
Temperature (o C)
Fig. 8. TGA of EM functionalized HDPE at
different % weight of EM
Fig. 9. TGA of EAA functionalized HDPE at
different % weight of EAA
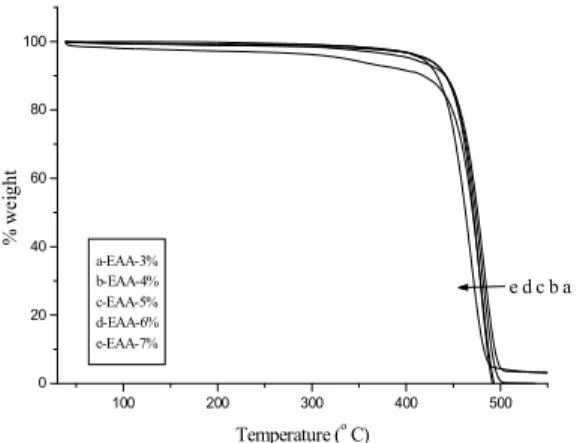
Fig. 9 showed the TGA of EAA functionalized HDPE. Here also, there was almost no change in
thermal stability due to the random functionalization of EAA in the presence of DCP. Due to the random grafting of EAA onto HDPE, with very low % of EAA used for functionalization process, the extra thermal stability due to grafted EAA was not observed. At higher % weight of EAA, HDPE showed a considerable decrease in thermal stability. Recently, Kaith et al17 and Chauhan et al18-20 explained the thermal properties of structurally modified polymers.
4. Conclusions
(1) EM showed higher % crosslinking and C=C formation than EAA. (2) The area of C=O peak increased with increase of % ester grafting. (3) EAA showed higher % functionalization than EM (4) EM consumed less amount of heat energy for crosslinking and C=C formation rather than EAA. (5) Ester grafting was confirmed by the presence of C=O stretching vibration (1723 cm-1) and C-O-C ester linkage peak (1050 cm-1) (6) DSC concluded the slight decrease in Tm and Tc values for functionalized
HDPE for both esters. (7) TGA explored the decrease in initial degradation temperature for EAA grafted HDPE system.
Acknowledgements
The author (R. Anbarasan) is thankful to the Department of Science and Technology, Government of India, New Delhi, for their financial support (Ref. No. SR/FTP/CS-39/2005).
References
2. Wei Q., Chionna D., Pacella M. (2003) Functionalization of LDPE by melt grafting with glycidyl methacrylate and reactive blending with polyamide-6. Macromol. Chem. Phys. 204, 1123-1133.
3. Ashour A.H., Saad H.M., Ibrahim M.M. (2006) Electrical conductivity for irradiated, grafted polyethylene and grafted polyethylene with metal complex. Egypt. J. Solids., 29, 351-362.
4. Craig I.H., White J.R. (2006) Mechanical properties of photo-degraded recycled photo-degraded polyolefins. J. Mater. Sci., 41, 993-1006.
5. Chiu F.C., Chu P.H. (2006) Characterization of solution-mixed polypropylene/clay nanocomposite without compatibilizers. J. Polym. Res., 13, 73-78.
6. Below H., Quilitz W., Schunann W. (2005) Electron beam crosslinking of large diameter thick-walled polyethylene pipes. Plast. Rubber Compos., 34, 34-39.
7. He P., Huang H., Zhang Y., Liu C. (2005) Undecylenic acid grafting on ethylene-octene copolymer in molten state. React. Funct. Polym., 62, 25-29.
8. Ciolino A.E., Pieroni O.I., Vuano B.M., Villar M.A., Valles E.M. (2004) Synthesis of polybutadiene-graft-poly(dimethylsiloxane) and polyethylene-polybutadiene-graft-poly(dimethylsiloxane) copolymers with hydrosilylation reactions. J. Polym. Sci. Polym. Chem. 42, 2920-2930.
9. Gaylord N.G., Mehta M. (1982) Role of homopolymerization in the peroxide-catalyzed reaction of maleic anhydride and polyethylene in the absence of solvent. J. Polym. Sci. Polym. Lett. 20, 481-486.
10. Vito G.D., Lanzetta N., Ralumbo R. (1984) Functionalization of an amorphous ethylene-propylene copolymer by free radical initiated grafting of unsaturated molecules. J. Polym. Sci. Polym. Chem. 22, 1335-1347.
11. Anbarasan R., Babout O., Dequiel M., Maillard B. (2005) Functionalization and cross-linking of high-density polyethylene in the presence of dicumyl peroxide-An FTIR study. J. Appl. Polym. Sci., 97, 766-774.
12. Parthasarathy V., Sundaresan B., Dhanalakshmi V., Anbarasan R. (2010) Functionalization and cross-linking of high-density polyethylene in the presence of dicumyl peroxide—An FTIR study.
Thermochim. Acta 510, 766-774
13. Parthasarathy V., Sundaresan B., Dhanalakshmi V., Anbarasan R. (2010) Melt surface grafting of HDPE with mercaptoesters by thermolysis method. Polym. Eng. Sci., 50, 474-483.
14. Anbarasan R., Kanchana S., Gayathri S., Jayalakshmi T. (2010)Synthesis and characterizations of calcium di(meth)acrylate divinyl monomers and melt surface graft functionalization with linear low density poly(ethylene). J. Appl. Polym. Sci., 115, 2582-2590.
15. Campos P.G.S., Petri D.F.S. (2004) Grafting of tetrahydrophthalic and maleic anhydride onto polyolefins in solution. J. Braz. Chem. Soc., 15, 532-540.
16. Girija B.G., Sailaja R.R.N. (2006) Low-density polyethylene/plasticized tapioca starch blends with the low-density polyethylene functionalized with maleate ester: Mechanical and thermal properties.
J. Appl. Polym. Sci., 101, 1109-1120.
17. Balbir Singh Kaith., Rajeev Jindal., Jaspreet Kaur Bhatia. (2011) Evaluation of thermal behavior of microwave induced graft copolymerization of ethylmethacrylate onto soy protein concentrate. J. Macromol. Sci., 48, 299-308.
18. Ashish Chauhan., Balbir Kaith. (2012) Using the advanced analytical techniques to investigating the versatile cellulosic graft copolymers. J. Anal. Bio-Anal. Tech., 3(5), 7-14.
19. Ashish Chauhan., Balbir Kaith. (2012) Versatile Sereni graft-copolymers : Xrd studies and their mechanical evaluation after use as reinforcement in composites. J. Chil. Chem. Soc., 57 (3).1262-1266.
![Fig. 4. Effect of temperature on (a and b) (RI [C=O/C-H] ), (c and d) (RI [C=C/C-H] ) (e and f) (% C.L) of (a, c and e) HDPE-DCP-EM and (b, d and f) HDPE-DCP-EAA systems](https://thumb-eu.123doks.com/thumbv2/123dok_br/18373864.355607/6.918.216.723.148.370/effect-temperature-hdpe-dcp-hdpe-dcp-eaa-systems.webp)
![Fig. 5. Effect of time on (a and b) (RI [C=O/C-H] ), (c and d) (% C.L), (e and f) (RI [C=C/C-H] ) of (a, c and e) DCP-EM and (b, d and f) DCP-EAA systems](https://thumb-eu.123doks.com/thumbv2/123dok_br/18373864.355607/7.918.287.643.136.398/fig-effect-time-ri-dcp-dcp-eaa-systems.webp)