Abstract
An experimental investigation followed by fundamental characterization and discussion on the effect of nanoclay filler on the mechanical and fracture properties of polymer matrix was carried out. The study was carried out on clay/polymer nanocomposite made of High Density pol-yethylene (HDPE M40060) produced by Saudi Arabian company SABIC and montimorillonite MMT nanoclay (Nanomer I.34TCN) produced by Nanocore, USA. MMT nanomer I.34TCN is surface modified with orga-nic surfactant to facilitate the bonding between nanoclay and HDPE. Current clay/polymer nanocomposite CPNC was produced by special technique of mixing, processing and molding. Samples of nanoclay, HDPE and nanocomposite were characterized by XRD, SEM and EDAX for investigating the chistillanity, distribution, desperion, intercalation, exfoliation, homogenity and defects. These aspects govern CPNC pro-cessing and bond between nanoclay and HDPE which controls the me-chanical and fracture properties. Sheets of the produced CPNC were prepared for mechanical and fracture testing. Mechanical properties such as tensile strength, yield stress and elongation were tested and compared for both of pure HDPE and CPNC using non standard test specimens of flat sheets for comparison purposes. Fracture mechanics tests for che-cking and comparing the critical stress intensity factor due to stress concentration at the crack tips for mode I crack (KIc) were carried out
using precracked non standard flat sheet specimens subjected to uniaxial uniform tensile stresses. Furthermore, standard experimental tests were conducted for both of HDPE and CPNC for investigating standard mechanical properties aspects based on ASTM D 638 using standard dumbbell-shaped specimen while for investigating standard fracture toughness standard single edge notch specimens SENB subjected bending moment due to effect of 3-point load based on ASTM D 5045 were ca-rried out. The results showed that procedures of mixing, processing tech-nique could produce nanocomposite with enhanced mechanical and frac-ture properties.
Keywords
Nanoclay, HDPE, Nanocomposites, Dry mixing, Melt processing, Me-chanical properties, Fracture Properties, Nonstandard specimens, ASTM D638, ASTM D5045
On the Processing and Properties of Clay/Polymer
Nanocomposites CPNC
Refat El-Sheikhy 1a Mosleh Al-Shamrani 2b
aProfessor, Bughshan Research chair,
Civil Eng. Dept., Faculty of Engineering, King Saud University, P.O.Box 800, Ri-yadh 11421Saudi Arabia,
bProfessor, Civil Eng. Dept. & Bughshan
Research chair Director, Civil Eng. Dept., Faculty of Engineering, King Saud Uni-versity, P.O.Box 800, Riyadh 11421, [email protected]
http://dx.doi.org/10.1590/1679-78251399
Latin A m erican Journal of Solids and Structures 12 (2015) 385-419 1 INTRODUCTION
nano-Latin A m erican Journal of Solids and Structures 12 (2015) 385-419
composite is montimorillonite MMT which relates to of the semectite clay family. Clay properties make clay particles convenient for reinforcing polymers for developing new composite with enhanced properties since polymers are thermoplastic, hydrophobic and organic materials. But mixing and processing step of nanoclay and polymer to manufacture nanocomposite faced several difficulties such as homogeneity, nanoclay distribution, particles orientation, defects, voids and air bulbs, par-ticle agglomeration, debonding between nanoclay and polymer, exfoliation and intercalation (Asma Y 2003, Fouad H. 2001, Gilman W 1999, 2011, Haruguchi K 2002, Hasmulkh 2006, Kazimi 2014, Kornamaa X. 2001, Lebaron P. 1999, Lili C. 2008, Meneghetti P. 2005, Okada A. 2006, Okamoto M. 2003, Subri A. 2008, Wang H. 2006, Zhang K. 2009 ). Mixing and processing are most important steps to avoid such these problems which control nanocomposite manufacturing and properties and to avoid producing conventional composite instead of the main target of producing of Nanocompo-sites. Main objective of current research is to find solutions for the problems to produce high quality advanced nanocomposite. Current research is checking the effect of a new developed approach for mixing and processing on the mechanical and fracture properties of nanocomposite in comparison to original pure polymer. Mixing stage is the most important stage for overcoming the manufacturing difficulties and problems. Most famous mixing techniques by melt processing are extruding the nanoclay filler and polymer using single or twin screw extruders or mixing using two or three roll mill mixers under high temperature based on the polymer type (Asma Y 2003, Fouad H. 2001, Gil-man W 1999, 2011, Haruguchi K 2002, Hasmulkh 2006, Kazimi 2014, Kornamaa X. 2001, Lebaron P. 1999, Lili C. 2008, Meneghetti P. 2005, Okada A. 2006, Okamoto M. 2003, Subri A. 2008, Wang H. 2006, Zhang K. 2009 ). Each method should be under high shear effect to facilitate the exfolia-tion of the nanoclay layers. Before extruding or roll milling stages we believe that well preparaexfolia-tion of the materials will facilitate the processing and control the quality of final product. Therefore current research depends on preliminary dry preparation and mixing. Previous studies depended mainly on the mixing during melting process through the extruder or the mixer (Asma Y 2003, Fouad H. 2001, Gilman W 1999, 2011, Haruguchi K 2002, Hasmulkh 2006, Kazimi 2014, Kornamaa X. 2001, Lebaron P. 1999, Lili C. 2008, Meneghetti P. 2005, Okada A. 2006, Okamoto M. 2003, Subri A. 2008, Wang H. 2006, Zhang K. 2009). Some researchers mixed the nanoclay and polymer before extruding putting the polymer and nanoclay together in one bag and then closing the bag and shaking the bag by free hand (Okamoto M. 2003).
Depending on the melt processing stage only for producing the nanocomposite even if it is re-peated for more than one time will not produce nanocomposite with good properties for several reasons. The reasons are:
1. Nanoclay particles before mixing should be surface modified by organic surfactant to facilitate the bond with polymer since nanoclay is inorganic material. Mixing the nanoclay under high temperature and high shear with destroy the surfactant layer of the nanoclay particles and then create debonding zones and defects in the nanocomposite.
Latin A m erican Journal of Solids and Structures 12 (2015) 385-419
debonding zones which will produce concentration of the stresses in the final product produc-ing cracks, fracture and propagation and may be failure decreasproduc-ing the lifetime of the materi-al and product.
Therefore, in current study, we mixed the nanoclay and HDPE very well with high shear effect several times. First mixing time was for nanoclay only as dry mixing under room temperature fol-lowed by mixing of nanoclay with HDPE by dry mixing under room temperature and high shear effect. This method will help in exfoliating the agglomerated micro nanoclay particles to nano clay layers, dispersing of the nanoclay particles in the polymer powder, intercalating the dry polymer powder between the dry nanoclay layers and homogeneity of the dry nanoclay/polymer mix without breaking or erasing the nanoclay organic surfactant. Then it is mixed under high shear and thermal effect of 190 0C temperature by using two roll mill mixer producing sheets with about 0.5 mm thickness as shown in Figure 3. Then the sheets were pelletized by sheet pelletizer to very small pellets as shown in Figure 4. Then it was molded to sheets of about 2.0 mm thickness under com-pression loading and temperature degree of 190 0C as shown in Figures 5 and 6. Samples are pre-pared for characterizations and properties testing for fracture and mechanical properties.
The advantages of this method in comparison to direct extruding of the nanoclay and polymers are:
1. The voids and bulbs in the nanocomposites produced by the extruder are very difficult to be avoided even with the presence of vacuum system due to the presence of trapped air with the high pressure of the extruder screws movement while in the two roll mill there is no trapped air. The air bulbs and voids are very dangerous in the final product since they can produce stress concentration zones, fracture and propagation and failure.
2. Using the twin or single screw extruder usually there are two feeders one for the polymer and other for nanoclay to feed the materials to the extruder with certain feeding rate for each one. Therefore, controlling the homogeneity of the extruded material is difficult by direct melting process but pre-mixing of the materials will help and easiest the homogeneity of the final prod-uct. The homogeneity will control the mechanical and fracture properties.
3. Without prior preparation of the nanoclay and polymer exfoliation of nanoclay particles and polymer intercalation will be difficult to be achieved.
4. There was no good distribution in extruding by mean feeder and secondary feeder since the nanoclay particles usually are agglomerated and most of them are still in microscale without ex-foliation.
2 EXPERIMENTAL WORK
Latin A m erican Journal of Solids and Structures 12 (2015) 385-419
testing for mechanical and fracture mechanics properties were conducted. The results were analyzed and discussed followed by the conclusion and acknowledgements.
Some previous studies (Asma Y 2003, Fouad H. 2001, Gilman W 1999, 2011, Haruguchi K 2002, Hasmulkh 2006, Kazimi 2014, Kornamaa X. 2001, Lebaron P. 1999, Lili C. 2008, Meneghetti P. 2005, Okada A. 2006, Okamoto M. 2003, Subri A. 2008, Wang H. 2006, Zhang K. 2009) conclude that nanoclay may increase the mechanical properties such as tensile strength and modulus of elas-ticity E with decreasing of the fracture properties such critical stress intensity factor for mode I crack KIc which may called fracture toughness; and energy release rate Gf which may called fracture
energy. But actually these results are not matching each other since if the tensile strength could be increased it will mean that there is good bond without defects or micro or nano cracks. In the same time KIc depends mainly on the tensile strength and crack geometry (mainly crack length (a) and
crack location such as edge or center of the material) (El-Sheikhy 1997, 1999, 2005, 2010, Cartwrite D, Brooke D. 1974) where KIC =c (a)0.5 , (c ) is critical fracture stress , (a) equals crack
length in case of single edge or double edge cracks while it equals half crack length in case of central cracks (El-Sheikhy 1997, 1999, 2005, 2010, Cartwrite D, Brooke D. 1974). This means that if ten-sile strength is increased or cracks lengths are decreased (KIc) will be increased and vice versa.
In addition, since Gf depends on KIC and modulus of elasticity E where Gf = KIc2/ E, then Gf
will be increased if KIc is increased or E decreased and vise versa. Previous studies considered that
KIc will be decreased because they found that Gf will be decreases when they calculated the Gf
based on integrating the area under stress-strain curve. But they did not consider that for pure polymer the Gf include the elastic energy and plastic energy while in CPNC it will be almost elastic
energy since the material changed from ductile to brittle or quasi brittle. Therefore they considered only the elastic KIC for both cases while for pure polymer the fracture is ductile and for CPNC the
fracture is almost brittle as shown in the figures of fracture Figures 16 and 28. Therefore it is logic for Gf to be decreased while KIc plastic is different than KIc elastic or elastic –plastic.
Latin A m erican Journal of Solids and Structures 12 (2015) 385-419
2.1 Materials
2.1.1 Polymer Matrix (monomer HDPE M40060)
The properties of polyolefin HDPE (M40060) (produced by Saudi Arabia Basic Industries Company SABIC) are shown in Table 1. Figure 9 shows the micrograph of SEM characterization for HDPE M40060 pellets mixed with nanoclay powder by dry mixing method before melting process for pro-ducing CPNC.
H D PE M 40060
Melting point (o) 190o
Density at 23 o (Kg/m3) 960 Tensile strength at yield (MPa) 24 Tensile strength at break (MPa) 22
Elongation at break (%) 600
Table 1: Properties of HDPE M40060 produced by SABIC-Saudi Arabia.
2.1.2 Nanoclay (nanomer I.34TCN)
Nanomer (I.34TCN) produced by Nanocre-Sigmna Aldrich –USA is surface modified nanoclay with organic surfactant to facilitate the bonding process to the polymer matrix to enhance the mechani-cal properties rather than the fracture properties of the nanocomposite. Bonding between nanoclay particles and polymer system is the main criterion for producing nanocomposite since any de-bonding defect at bi-surface between the two materials will produce cracks and concentration of stresses at the tips of nanoclay layers as cracks shown in Figure 9. The properties of nanomer (I.34CTN) are shown in Table 2.
N anomer I.34TCN
Property Minimum Mean Maximum
Bulk Density (Kg/m3) 200 332 500
Moisture (wt %) 3
Particle size (micron) 13 20
Table 2: Properties of Nanoclay nanomer I.34 TCN produced by Sigma Aldrich, USA.
2.2 Nanocomposite Processing
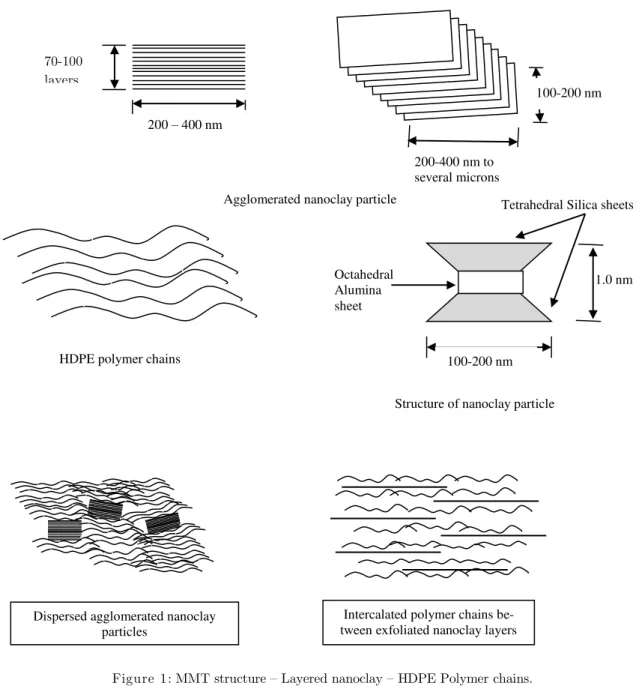
Latin A m erican Journal of Solids and Structures 12 (2015) 385-419 Figure 1: MMT structure – Layered nanoclay – HDPE Polymer chains.
Figure 2: Dispersed, intercalated nanoclay , and exfoliated nanoclay in HDPE matrix.
100-200 nm
200-400 nm to several microns
Agglomerated nanoclay particle
70-100 layers
200 – 400 nm
1.0 nm Octahedral
Alumina sheet
Tetrahedral Silica sheets
100-200 nm
Structure of nanoclay particle HDPE polymer chains
Intercalated polymer chains be-tween exfoliated nanoclay layers Dispersed agglomerated nanoclay
Latin A m erican Journal of Solids and Structures 12 (2015) 385-419
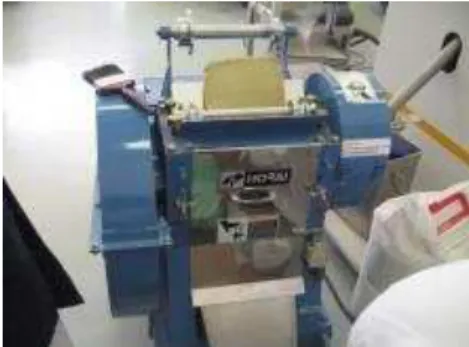
Figure 3: HDPE and Nanomer I.34TCN CPNC during during mixing in 2-roll mill.
Figure 4: Sheet pelletizer machine during changing CPNC sheets to pellets.
Figure 5: Compression machine under temperature control for molding the CPNC pellets to sheets.
Latin A m erican Journal of Solids and Structures 12 (2015) 385-419 The MMT nanoclay/ HDPE polymer nanocomposite was made by melt processing method. A new technique was applied according to the following steps:
1. The ratio of the nanoclay powder to the polymer powder in the mix of the nanocomposite was 5% by weight. This ratio is the most trusted ratio for producing clay/polymer nanocomposite based on the previous studies of the academics and companies (Asma Y 2003, Fouad H. 2001, Gilman W 1999, 2011, Haruguchi K 2002, Hasmulkh 2006, Kazimi 2014, Kornamaa X. 2001, Lebaron P. 1999, Lili C. 2008, Meneghetti P. 2005, Okada A. 2006, Okamoto M. 2003, Subri A. 2008, Wang H. 2006, Zhang K. 2009).
2. Before starting the mixing of nanoclay with the polymer by melting process technique, the nanoclay Nanomer I.34TCN was dry mixed alone under high shear and room temperature for ex-foliating the agglomerated nanoclay micro particles to nano layers. This step is very important and essential since the nanoclay layers are strongly hydrophilic and usually absorb the water from the surrounding air producing agglomeration for the nano layers connecting in micro size. This step is newly applied just in current research while previous studies depended on exfoliating the nanoclay micro particles during mixing with the polymer matrix in the melting process mix. This step would facilitate and easiest the nanococomposite manufacturing by ensuring that the nanoclay particles were exfoliated to layers with minimizing the agglomeration. It will minimize the defects and inclusions in the nanocomposite, facilitate intercalation of polymer matrix be-tween nanoclay layers, dispersing the nanoclay layers in the polymer matrix and facilitate the bonding process between nanoclay layers and polymer.
3. Dry mixing of the nanoclay nanomer I.34TCN with HDPE powder for two times where first mixing will be under room temperature without shear effect while the second time will under high shear and room temperature without melting. This step is very important for homogeneity and uniformity distribution of the nanoclay particle within the polymer powder.
4. Melt mixing of the mixture of I.34TCN nanoclay and HDPE under high shear and temperature of 190 oC using 2-Roll Mill as shown in Figure 7 to produce sheets of about 0.5 mm thickness.
5. The produced sheet was rolled several time by the 2-roll mill to ensure the dispersion, intercala-tion, exfoliation and killing any possibility for producing air bubbles or voids in the product sheets.
6. The produced sheets were pelletized to very small pellets using sheet pelletizer device shown in Figure 8. This step also helped in producing sheets with any requested size and thickness in ad-dition to avoiding any voids, air bubbles, inclusions or defects in the nanocomposites.
Latin A m erican Journal of Solids and Structures 12 (2015) 385-419
8. Using the same technique sheets of pure HDPE we produced with the same steps of milling and molding. The HDPE sheets were made on the same thickness of 2.0 mm and same procedures for comparison purpose to CPNC.
9. Samples of CPNC and HDPE sheets were tested for characterizing the mechanical and fracture mechanics and finding the differences due to the effect of nanoclay filler and processing.
3 CHARACTERIZATIONS
Samples of each of Nanoclay powder, HDPE powder and produced CPNC were characterized by using X-ray diffraction XRD, Scanning electron microscope SEM and EDAX chemical analysis by the same scanning electron microscope. Samples of CPNC and HDPE sheets were prepared and tested for characterizing the mechanical and fracture properties for checking the differences due to the effect of nanoclay filler and processing.
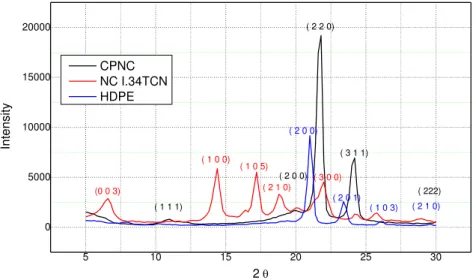
3.1 X-ray diffraction XRD
Samples of each of nanoclay, HDPE and CPNC were characterized by wide angle X-ray diffraction for checking each of crystallinity, dispersion of nanoclay in the polymer matrix, exfoliation and in-tercalation of polymer between nanoclay layers. These can be known through calculation of each of d and D where d is the spacing between layers of atom levels of the crystals while D is particle crys-tal size. This depends on recognition of the peaks, diffraction angles, and cryscrys-tal orientation. The crystals direction ( h, k, l) , crystal size (D), spacing between layers of atom levels of the crystals (d) , angle of diffraction (2 peak intensities and width of the peaks (B) are calculated using both of Bragg law; Equation 1 and Scherer law ; Equation 2.
3.1.1 Bragg’s Law
n = 2d sin (1)
where:
is the X-ray wave length , = 0.1315 nm , n= 1.0
From Bragg law and XRD results for each of HDPE M40060, Nanomer I.34TCN and CPNC at (h k l) ( 2 2 0) as shown in Figure 7, it is found from peaks, diffraction angles that; at the CPNC peak at 2= 20.75 o , 22.5 o respectively d equals d1 and d2 respectively where:
d1=0. 365 nm at 2=20.75 o , d2=0.337 nm at 2=22.5 o
3.1.2 Scherrer’s Law
D = 0.9 / (B cos ) (2)
where:
B = peak width in radians. B = 22.5 o -20.75 o
Latin A m erican Journal of Solids and Structures 12 (2015) 385-419
The particle size D= 3.944 nm, at 2 = 20.75 , D = 3.95 nm, at 2= 22.5 respectively, while the original particle size of nanoclay is (13 micron) as minimum size and (20 microns) as maximum size.
The results means that the mixing and processing technique could exfoliate the agglomerated nanoclay layers to be in nano size.
It is shown from Figure 7 and Equations 1 and 2 that (d) was decreased for CPNC which means that there are exfoliation, intercalation and dispersion producing material with better mechanical properties than the original material. It is recognized from Figure 7 that the peak width (B) of CPNC is larger than peak widths of each of the nanoclay and HDPE which means that there are exfoliations for the nanoclay particles. This means decrease of particle size (D) as shown from the results of Equation 2 which means that there is no agglomeration of nanoclay particles.
5 10 15 20 25 30
0 5000 10000 15000 20000
( 1 1 1)
( 2 0 0)
( 222) ( 2 1 0) ( 1 0 3) ( 2 0 1)
( 2 1 0)
( 3 0 0) (0 0 3)
( 1 0 5)
( 3 1 1)
( 2 0 0)
( 1 0 0)
In
te
n
sity
2
CPNC NC I.34TCN HDPE
( 2 2 0)
3.2 SEM characterization
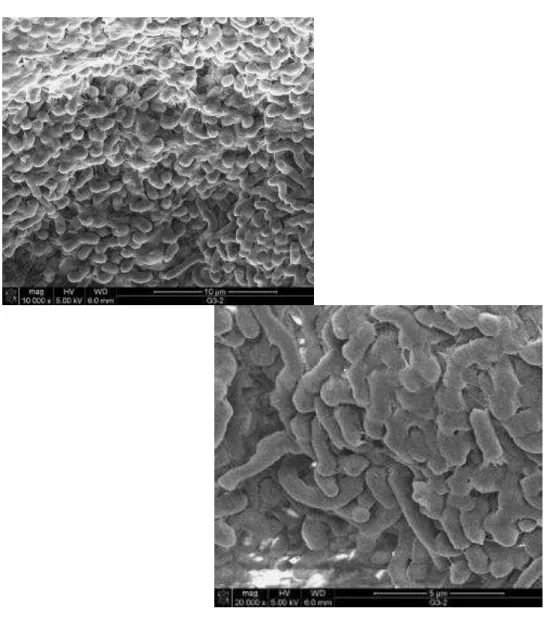
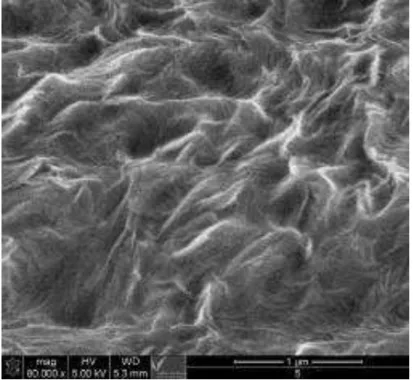
Microscopy imaging were taken by using scanning electron microscope SEM for investigating of each of the morphology, distribution, dimensions, homogeneity and checking the presence of de-fects, cracks, debonding which help in prediction of intercalation, dispersion and exfoliation process-es for nanoclay, polymer and clay/polymer nanocomposite. The SEM micrographs were taken for each of HDPE M40060, nanoclay nanomer I.34TCN and produced CPNC as shown in Figures 8, 9 and 10 respectively. Figure 9 of nanomer I.34TCN shows the nanoclay layers and dimensions. Fig-ure 8 shows the HDPE dry particles indicating the dimensions and shape mixed with 5% of nanoclay powder while Figure 10 is showing the CPNC of the melted HDPE matrix after mixing with nanoclay indicating the homogeneity, distribution of nanoclay layers, dispersion of nanoclay layers in the polymer matrix, exfoliation of nanoclay layers and intercalation of polymer between the nanoclay layers. There are no agglomerated nanoclay particles or inclusions or nanoclay ag-glomeration which proves that processing and mixing techniques could make homogeneous distribu-tion, exfoliation and intercalation.
Latin A m erican Journal of Solids and Structures 12 (2015) 385-419
Latin A m erican Journal of Solids and Structures 12 (2015) 385-419
Latin A m erican Journal of Solids and Structures 12 (2015) 385-419
Figure 10: SEM micrograph for CPNC made of HDPE and nanomer I.34TCN.
3.3 EDAX analysis
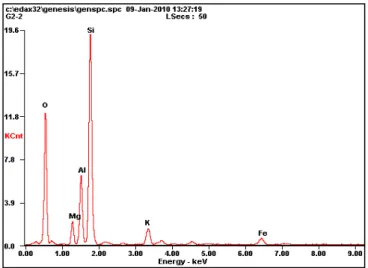
Chemical composition characterization was carried out by using electronic beam of scanning elec-tron microscope and EDAX system to investigate the composition of the produced nanocomposite made of nanomer I.34TCN and HDPE-M40060 in addition to investigation of the chemical compo-sition of samples of Nanomer I.34TCN and samples of HDPE. The characterization was made at several locations of the samples of CPNC, HDPE and Nanoclay. The chemical characterization in-vestigates and proves the dispersion of nanoclay particles in the polymer matrix, exfoliation of nanoclay layers, and intercalation of polymer matrix between the nanoclay layers. It also investi-gates and proves the uniform distribution of nanoclay in the polymer matrix and homogeneity prov-ing the bondprov-ing between nanoclay and polymer. Figure 11 indicates the composition of the nano-mer I.34TCN MMT nanocly ( Si Al O Mg ) showing the elements of Silicon (Si), aluminum (Al), oxygen (O), magnesium (Mg+), and potassium(K+). MMT particle consists of two sheets of Silicon (Si) sandwiching one sheet of Alumina (Al) connecting together with oxygen (O) with ex-changing cations with magnesium (Mg+) and potassium (K+). The chemical composition of HDPE M40060 [- (CH2)n -] consists of the carbon element ( C ) and the hydrogen (H ) as known for the
Latin A m erican Journal of Solids and Structures 12 (2015) 385-419
Figure 11: Chemical analysis for nanoclay by EDAX system.
Figure 12: Chemical analysis for CPNC nanoclay/HDPE by EDAX system.
4 MECHANICAL PROPERTIES TESTING
The mechanical properties comparison included testing of nonstandard specimens and testing of other specimens according to ASTM D638 standard test.
4.1Testing of flat sheet specimens with nonstandard dimensions
ma-Latin A m erican Journal of Solids and Structures 12 (2015) 385-419
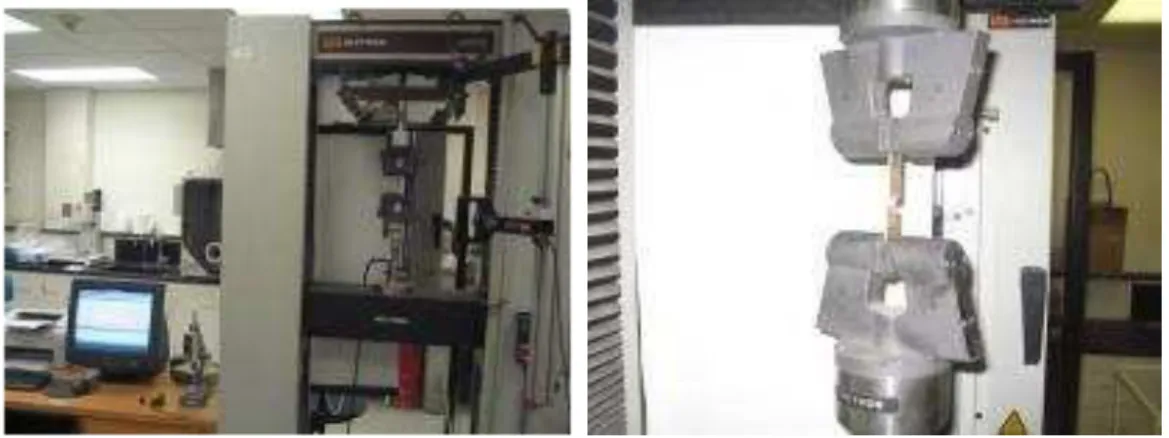
terials were tested under uniaxial tension load using displacement control machine Instron type as shown in Figure 17. Three samples as minimum number were tested for each material at least with cancelling of any failed test. Each sample dimensions were 120 mm length, and 12 mm width, with average thickness of 2.0 mm. The samples were tested under displacement control of rate 50 mm/min at the room temperature of 25 oC and humidity of 50%. The tests were made mainly to record the results of load-displacement curve, tensile strength (Mpa), elongation percentage,
Y”u“g’s m”dulus ”f elasticity E (MPa), and stresses at yield and break (Mpa). The comparisons of the results were made as shown in Table 3. From the results shown in Figures 15 and 27, it is clear that load-displacement curves show that pure HDPE is a ductile behaving in elastic-plastic shape with elongation equal ( 560.7%) while the load-displacement curve of CPNC is almost similar to quasi-brittle material with elongation of (28.33%) and behavior similar to quasi-elastic material. It is shown that the tensile strength of the nanocomposite is larger than the tensile strength of HDPE by the ratio of (38 %) where tensile strength of HDPE is (23.336 MPa) while the tensile strength of CPNC at break is (16.908 MPa). It is shown that the yield stress for CPNC is (23.336 MPa) while for HDPE is (25.144 MPa). From the comparison it is clear that the nanoclay could enhance the mechanical properties of HDPE.
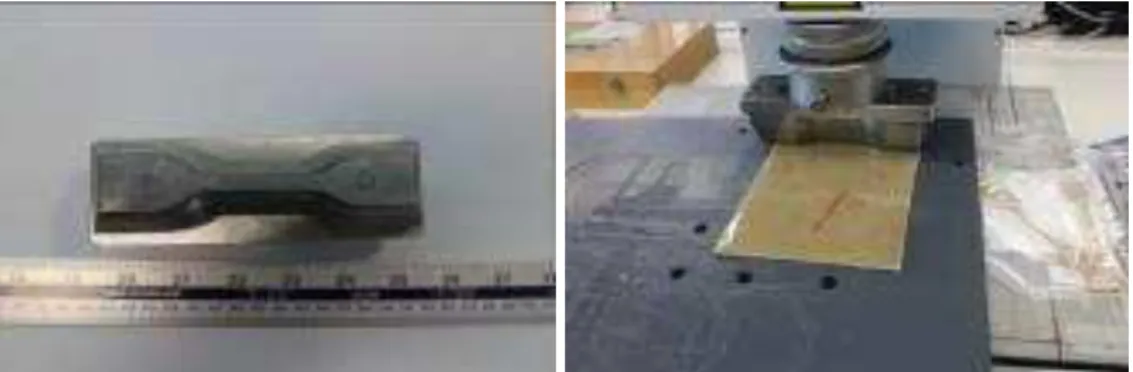
Figure 13: Non standard flat sheet samples for tensile test.
Latin A m erican Journal of Solids and Structures 12 (2015) 385-419
-100 0 100 200 300 400 500 600 700
0 5 10 15 20 25
Str
e
s
s
MPa
Strain %
0 5 10 15 20 25 30 35
-2 0 2 4 6 8 10 12 14 16
Str
e
s
s
MPa
Strain %
Figure 15: Stress-Strain curve for pure HDPE without
Latin A m erican Journal of Solids and Structures 12 (2015) 385-419
Figure 17: Instron displacement control machine with (10 KN) capacity and CPNC sample during testing.
M echanical properties com parison between Pure H D PE and CPN C N onstandard specim ens
Property Material
HDPE without cracks
CPNC Without cracks Tensile strength at break (MPa) 16.908 23.336 Tensile strength at yield (MPa) 25.144 23.336
Ultimate elongation (%) 560.714 28.296
Y”u“g’s M”dulus E (MPa) 712.218 395.402
Max. Load (KN) 0.607 0.579
Displacement at break (mm) 379.6 8.4
Table 3: Mechanical properties comparison between Pure HDPE and CPNC for Nonstandard specimens.
4.2Mechanical properties testing of dumbbell-shaped specimens (ASTM D638 standard)
Test procedures are depending on the standard specifications of ASTM D638. Test samples were prepared in the shape of dumbbell with the dimensions shown in Figure 18.
4.2.1 Equipments
The equipments used in ASTM D638 test are:
1- Calibrated displacement control machine shown in Figure s 21, 22, 23 and 24 with the following properties:
Latin A m erican Journal of Solids and Structures 12 (2015) 385-419
3- Load Cell Sensitivity 2m V/V 4- Load cell type: i Xforce HP
5- Nominal force of load cell 10 KN, manufactured 2012
2- Sample cutter machine for making Dumbbell-shaped standard specimens according to ASTM D 638, as shown in Figure 19 and Table 4.
4.2.2 Specimens for ASTM D638 Test
Test specimens dimensions are shown in Figures 18, 19 and 20 prepared according to ASTM D 638 test specifications for plastics and were prepared using special cutting machine based on ASTM D638 specifications.
Figure 18: ASTM D638-02a Dumbbell-shaped test specimen the type IVB group.
Latin A m erican Journal of Solids and Structures 12 (2015) 385-419
Figure 20: ASTM D638-02a Dumbbell-shaped test specimen the type IVB group.
Latin A m erican Journal of Solids and Structures 12 (2015) 385-419
Figure 22: Test setup.
Figure 23: Dumbbell-shaped sample during test. Figure 24: dumbbell-shaped sample during testing.
4.2.3 Results and Analysis of ASTM D 638 Tensile Strength Test
The test results are shown in Figure 25 for pure HDPE while in Figure 26 for Clay/polymer nano-composite. Mechanical properties were investigated for both of pure HDPE and CPNC for compar-ison purposes and to check the effect of adding the nano clay powder to the polymer matrix of HDPE. Tensile strength, E, strain, elongation, and poisons ratio were investigated based on the American specifications of ASTM D 638 – 02a, using dumbbell – shaped test specimen of the type IVB group ( ASTM Designation: D 638 -02a, 2003, pp 46-58, ASTM International, 100 Barr har-bor Drive, P.O. Box C700, West Conshohocken, PA 19428-2959). The specimen dimensions are shown in Figure 18. The sample thickness was about 2.0 mm.
sam-Latin A m erican Journal of Solids and Structures 12 (2015) 385-419
ples before testing are shown in Figure 20 while samples setup and during the tests were shown in Figures 23 and 24. The results of the tests are plotted in the shape of stress-strain curves shown in Figure 25 for HDPE and Figure 26 for CPNC. The test results are also indicated in the table 4. Figures 18, 19, 20, 21, 22, 23, 24 and Table 4 show the results of the tension test based on the standard test of ASTM D 638 for both of HDPE and CPNC samples prepared according to the standard test specifications as dumbbell-shaped specimens where 6-samples for HDPE and CPNC. The test results for HDPE and CPNC explain that tensile strength and modulus of elasticity of CPNC are larger than the tensile strength and E of pure HDPE as shown in the Table 4 where these results prove the correctness and match the results of nonstandard test specimens shown in Table 3 and Figures 15 and 16.
-100 0 100 200 300 400 500 600 700 0
5 10 15 20 25
Str
e
s
s
MPa
Strain %
-1 0 1 2 3 4 5 6 7 8
0 5 10 15 20 25 30
Str
e
s
s
MPa
Strain %
Figure 25: Pure HDPE Stress-Strain curve without cracks (ASTM D638).
Latin A m erican Journal of Solids and Structures 12 (2015) 385-419 M echanical properties com parison between Pure H D PE
and CPN C D um bbell-shaped specim en A STM D 638
Property Material
HDPE without cracks
CPNC Without cracks
Tensile strength at break (MPa) 15.5 26.8
Tensile strength at yield (MPa) 23.9 26.8
Ultimate strain (%) 630 7.4
Y”u“g’s M”dulus E (MPa) 1188 1959
Table 4: Mechanical properties comparison between Pure HDPE and CPNC Dumbbell-shaped specimen, ASTM D638.
5 FRACTURE PROPERTIES TESTING
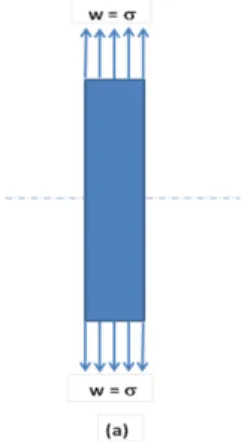
The fracture behavior and fracture properties comparison included testing of nonstandard specimens with single edge crack under uniform uniaxial tension stress in addition to testing of other speci-mens according to ASTM D5045 standard test of SENB under 3-point load as shown in Figures 29, 30.
5.1Testing of single edge cracked flat sheet specimens with nonstandard dimensions
Fracture mechanics were done for both of pure high density polyethylene HDPE and CPNC to check the differences and changes due to the effects of nanoclay additive using melt processing technique with new approach. The fracture tests were carried out on pre-cracked samples of single edge crack which may be called single edge notch SEN locatedat middle height of the sample with perpendicular to the test load direction as shown in Figure 17 and results shown in Figures 16, 28 and Table 5. The fracture tests for HDPE and nanocomposite samples were carried using Instron displacement control machine of maximum loading capacity is (10 KN). Machine crosshead speed during the test was (5 mm/min). The tests were carried out at room temperature of (25 oC), and humidity of (50%). Each sample length was (120 mm) and width was (12 mm) with average thick-ness of about (2.0 mm).
The test was carried out for mode I crack to check the critical stress intensity factor at the crack tips due to the concentration of stresses under loading which may also called as fracture toughness KIc, as indicated in Equations 3 & 4 (Cartwright D. J., Rooke D. P., 1974, El-Sheikhy 1997, 1999,
2005, 2010).
KIc = c(a)0.5 (F) (3)
Latin A m erican Journal of Solids and Structures 12 (2015) 385-419
Where:
(F) is correction factor for edge cracks in finite sheet under uniform tensile stress (Cartwright D. J., Rooke D. P., 1974).
(a) = crack length, (b) = test sample width, (c ) = critical stress at fracture.
For current experiments: a = 2.0 mm, b= 12.0 mm.
The sample dimensions are of 120 mm length, 12 mm width and thickness of about 2.0 mm.
The test was done under the condition of plan stress fracture mechanics since the samples were made of thin sheets of thin thickness. Some samples were pre-cracked at the middle at the edge from just one side to be cracked with single edge crack of length a = 2.0 mm and crack width of about 0.3 mm. The elastic fracture energy Gf was calculated by using the Equation 5, for elastic
energy release rate for plane stress condition (El-Sheikhy 1997, 1999, 2005, 2010, Cartwrite D, Brooke D. 1974).
Gf = (KIc )2/E (5)
Where:
Gf = Elastic energy release rate for plane stress condition
KIc =Fracture toughness (Critical stress intensity factor for mode I crack)
KIc = ( 3.14 a)0.5 [MPa (mm)0.5]
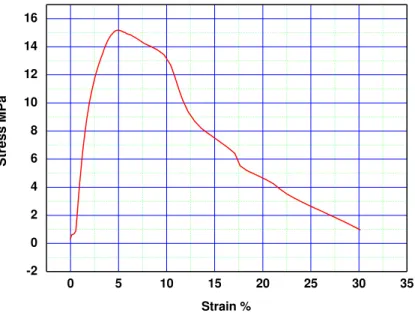
The results are shown in Figures 16, 28 and Table 4, for HDPE and CPNC respectively for results of tested sample of single edge cracks for both of HDPE and CPNC respectively. It is shown that the fracture load of CPNC is larger than the fracture load of HDPE by the ratio of (10.44 %) where the fracture load of HDPE is (15.175 MPa) while fracture load for CPNC is (16.759 MPa). It is shown that the elastic fracture energy release rate of CPNC is larger than the elastic fracture ener-gy release rate of HDPE by the ratio of (155 %) where the elastic fracture enerener-gy release rate of HDPE is (1.85 MPa mm) while elastic fracture energy release rate for CPNC is (4.73 MPa mm). It is clear that the fracture toughness of CPNC is larger than the fracture toughness of HDPE. Also, it is clear that the elastic energy release rate of CPNC is larger than the elastic energy release rate of HDPE.
-2 0 2 4 6 8 10 12 14 16 18
0 5 10 15 20 25
Str
e
s
s
MPa
Strain %
Latin A m erican Journal of Solids and Structures 12 (2015) 385-419
0 1 2 3 4 5
-2 0 2 4 6 8 10 12 14 16 18
Str
e
s
s
MPa
Strain %
Fracture properties com parison between Pure H D PE and CPN C U nder Tension Load effect
N onstandard specim ens
Property
Materi-al
HDPE CPNC
Tensile strength at failure ( Fracture strength) (MPa) 15.175 16.759
Tensile strength at yield (MPa) 15.175 16.759
Ultimate elongation at fracture (%) 4.875 9.656
Y”u“g’s M”dulus E (MPa) 782.077 372.937
( Critical fracture Load)(KN) 0.41 0.445
Displacement at fracture (mm) 18.3 2.45
KIc Critical stress intensity factor for mode I crack
fracture toughness)(MPa (mm)0.5 ) 54 62
Elastic Fracture Energy Release Rate Gf = KI2/E ( MPa (mm ))
3.72 10.33
Table 5: Fracture properties comparison between Pure HDPE and CPNC under uniform uniaxial Tension for Nonstandard specimens.
Latin A m erican Journal of Solids and Structures 12 (2015) 385-419
5.2 Testing of Fracture Toughness According to ASTM D 5045
The standard test for investigating fracture toughness through 3-point load flexural test is very difficult and sensitive for plastics especially because the samples are very small while for metals may be convenient. The testing of fracture toughness for both of pure HDPE and CPNC samples was done according to the international standard test ASTM D 5045 using single edge notched speci-mens as shown in Figures 29 and 30.
5.2.1 Test Specimens and Testing Procedures for ASTM D 5045 Standard
Test samples of ASTM D5045 test for predicting the fracture toughness are notched specimens pre-pared as shown in Figure 29.
Testing procedures are following the specifications and recommendations of ASTM D 5045 for testing the fracture toughness of plastics by using SENB method under 3-point load while based on fundamental analysis the applied actual forces on the notch can be derived as shown in Figure 30.
5.2.2 ASTM D 5045 testing equipments
Equipments used in carrying out the ASTM D5045 fracture toughness tests are:
1- Notch cutter machine shown in Figure 31: 1- Notching cutter NOTCH VIS
2- Manufactured by CEAST 3- Type: PSME-17 ML-036
2- Flexural 3-point Load Testing machine shown in Figures 32 and 33: 1- Type: Calibrated displacement control machine ZWICK/Roell Zoo5 2- Load Cell Capacity is (1.0 KN)
3- Load Cell Sensitivity 2 m V/V 4- Load cell type: XForce HP
5- Manufactured : 2014
Latin A m erican Journal of Solids and Structures 12 (2015) 385-419
Latin A m erican Journal of Solids and Structures 12 (2015) 385-419
Figure 31: Notching cutter CEAST NOTCH VIS Type: PSME-17-ML-036.
Latin A m erican Journal of Solids and Structures 12 (2015) 385-419
Latin A m erican Journal of Solids and Structures 12 (2015) 385-419
5.3 Results, analysis and discussion of fracture toughness
Fracture properties com parison between Pure H D PE and CPN C SEN B specim ens under 3-pointload
A STM D 5045
Property
Materi-al
HDPE CPNC
Test speed (mm / Min)
Maxium flexural strength at failure (MPa)
5.0 29.0
5.0 13.0
fracture toughness KIc )(MPa (mm)0.5 ) 123.7 60
Elastic Fracture Energy Release Rate Gf = KI2/E ( MPa (mm ))
1.85 4.73
Table 6: Fracture properties comparison between Pure HDPE and CPNC SENB specimens under 3-pointload ASTM D5045.
The results of the test are shown in Figures 34, 35 and table 6. Based on the results of the stand-ard test ASTM D 5045 , it is clear from the test and analysis that flexural strength of HDPE is almost twice the flexural strength of CPNC and from Equations 6, 7, 8 KQ = K Ic under bending
stress due to 3-point load effect are shown in Table 6 .
Under same conditions which show that under bending stress, the fracture toughness of HDPE is larger than the fracture toughness of CPNC which means that HDPE bending strength is larger than bending strength of CPNC. This result is matching the behavior of the mechanical test at which CPNC is brittle while HDPE is ductile where ductile materials can always carry bending moment stresses more than the brittle.
KQ = K Ic = [PQ / BW0.5] F(x) (6)
F(x) = 6x ½ (1.99 – x (1-x) (2.15-3.93x+2.7x2))/ (1+2x) (1-x) 3/2) (7)
(x) = (a/W) = 0.5) (8)
Where:
(B) = specimen thickness or beam width, (W) = the specimen height or beam depth,
(P) = the applied critical load PQ, () = applied tensile stress on the crack, (a) = crack length.
As it is already known that the fracture toughness represents a material intrinsic parameter, it is actually known as the value of the produced critical stress intensity factor KIc due to stress
Latin A m erican Journal of Solids and Structures 12 (2015) 385-419
and material geometry (F) (where (F) is a correction factor depending on material geometry with respect to crack dimension) in addition to material behavior as plane stress or plane strain or plane stress-plane strain. The stress intensity factor also changes based on crack location with respect to the material geometry such as edge crack, double edge crack, internal or central crack, orientation with respect to applied load direction such as normal stress ( tension or compression), shear stress (in plane or out of plane) or mixed normal and shear stresses. Also the stress intensity factor de-pends on the type of loading such as tension, shear, moment, concentrated load, crack with far field under remotely applied load,….etc. This means that for the same material, the critical stress inten-sity factor will have different values for each crack and will change by the changing of any factor such the case of crack propagation where the crack length will be changed. Even for the same mate-rial and same crack length the stress intensity factor will have different values based on the thick-ness of the material which means that stress intensity factor in plane stress for very thin sheets will be different from plane strain for thicker material. Even in the thick material stress intensity factor at outer face will be in plane stress condition different from inner cases as plane strain.
0 5 10 15 20 25
0 5 10 15 20 25 30 Str e s s MPa
Strain %
0.0 0.5 1.0 1.5 2.0
-2 0 2 4 6 8 10 12 14 St re ss MPa
Strain %
Figure 34: Stress-Strain curve for pure HDPE - SENB standard specimen based on ASTM D5045 for fracture toughness.
Latin A m erican Journal of Solids and Structures 12 (2015) 385-419 6 DISCUSSIONS
The main aim of the research was to study the effects of nanoclay filler on the properties of the polymer composite and microstructure including mechanical and fracture properties of most popu-lar cracks. Therefore the study depended mainly on making comparisons on real cases of non standard specimens without intending mainly to predict the standard properties since these types of materials are still under extensive research without international special standardizations for processing and production. But anyway, in addition to testing of non standard specimens, ard test based on ASTM D638 was carried out to predict the mechanical properties while stand-ard test for predicting the fracture toughness also carried out based on ASTM D5045 for standstand-ard samples for both of pure HDPE and clay/polymer nanocomposite. Therefore the study was de-signed mainly to compare real cases on non standard samples. It is made to compare between the polymer material of HDPE as pure material in comparison to polymer nanocomposite made of Nano clay particles mixed to HDPE polymer matrix to produce new nanocomposite by applying special procedures and technique of production as mentioned in the manuscript. Characteriza-tion using SEM, EDAX, and XRD diffracCharacteriza-tion were carried out to verify that the produced mate-rial is nanocomposite through comparing between the pure matrix samples, nanoclay samples and samples of nanoclay/polymer nanocomposite. Characterization aspects proved the phenomenon of nanocomposite with clear difference and changes in the microstructure and crystallinity. Fur-thermore, it was important to check the effect of nanoclay on changing of mechanical and frac-ture properties of the polymer matrix. Therefore, as a first step of current research procedures, flat sheet samples with nonstandard were studied for both of pure HDPE and nanoclay/HDPE nanocomposite using samples with same dimensions and test conditions to check the differences in mechanical and fracture properties. The test samples are shown in Figures 13 and 14 for non cracked and pre-cracked samples for both of pure HDPE and clay/HDPE nanocomposite. The test conditions included unifying of the sample dimensions, test displacement rate as (5.0 mm/min), at the same time in same room temperature and humidity. The comparisons included stress-strain relation, maximum stress, maximum elongation, modulus of elasticity, critical stress intensity factor at crack tip for mode I internal crack which is most popular crack and defect in the materials industry. For checking and comparing the fracture behavior and fracture properties samples with free dimensions (Non standard dimensions) having same dimensions and test condi-tions for both of the tow materials of pure HDPE and nanocomposite were tested to investigate the critical stress intensity factor and fracture behavior through the stress-strain behavior of the cracked material and non cracked specimens with the same dimensions. This is in addition to comparing of the values of critical stress intensity factors produced due to stress concentration at the tips of the cracks which is known as fracture toughness KIc in case of mode I crack. The
Latin A m erican Journal of Solids and Structures 12 (2015) 385-419
samples for each material were tested under static tension with displacement control by the rate of (5.0 mm/Min). For fracture toughness testing according to ASTM D5045, (5) samples of each material were tested under static 3-point load test using displacement control machine with ad-justing the test rate at displacement of (5.0 mm/Min). The main purpose of current study is to investigate the effect of nanoclay filler on the properties of HDPE matrix which will be changed from pure HDPE to nanocomposite. The effects will be shown clearly by comparing the properties of HDPE matrix before and after mixing process of nanoclay filler to HDPE. In other words, this means testing of samples of both of pure HDPE and produced clay/polymer nanocomposite. There-fore, the study aimed to compare the behavior of central internal mode I crack in non standard flat sheet specimens under uniaxial tension load in addition to testing another specimens with same dimensions without cracks under same loading setup and same machine to check and compare the followings:
1- Comparison of the mechanical properties and material behavior under uniaxial tensile stresses for cracked and non cracked pure HDPE samples.
2- Comparison of the mechanical properties and material behavior under uniaxial tensile stresses for cracked and non cracked clay/polymer nanocomposite samples.
3- Comparison of the mechanical properties and material behavior under uniaxial tensile stresses for non cracked pure HDPE samples and clay/polymer nanocomposite samples.
4- Comparison of the fracture properties and material behavior under uniaxial tensile stresses for non cracked pure HDPE samples and clay/polymer nanocomposite samples.
7 CONCLUSIONS
Latin A m erican Journal of Solids and Structures 12 (2015) 385-419
Acknowledgements
This work was funded by Center of Excellence in Engineering Materials (CEREM)-Faculty of Engineering-King Saud University under the Grant Number CEREM – IR013 . The authors would like to introduce their sincere thanks to CEREM. The authors also would like to introduce their sincere thanks to King Saud University RE-SEARCH CHAIRS for their kind support. The authors extend their thanks to technicians of Nanotechnology Lab and Nuclear Energy Laboratories at King Abdulaziz City for Science and Technology KACST and SABIC, Saudi Arabia for their kind assist during processing, testing and characterization stages.
References
Asma Y., Jandro L., Isaac D., (2003) Processing of clay/epoxy nanocomposites with a three-roll mill machine. Mat. Res. Soc. Symp. Proc. 740: 13.7.1-13.7.6.
Asma Y., Jandro A., Isaac D.,(2003) Processing of clay/epoxy nanocomposites by shear mixing, Scripta materialia. 49: 81-86.
Bhaskar A., (2003) Polymer silicate and magnetic polymer nanocomposites processing and characterization. M. Sc. Thesis, University of Florida, USA.
Cartwright D. J., Rooke D. P., (1974), the compendium of stress intensity factor, University of Southampton, Uk. El-Sheikhy R., Al-Shamrani M., (2010) General Analytical Concept and Methodology of Design and Producing of Clay – Based Polymer Nanocomposite, J. Ceramic Transactions, 219: 165-174
El-Sheikhy R., (1997) A New Treatment of Fracture in Uniaxial Fields. Proc. 5th Int. Conf. On Bia-xial/Multiaxial Fatigue and Fracture, European Structural Integrity Socity, Cracow, Poland. II: 657-666
El-Sheikhy R., Nishimura N., (1999) Comparisons of Cracking Processes among Directional fracture Theories (New treatment). J. Technology Reports of the Osaka University, 49 Nos 2338-2347: 63-77
El-Sheikhy R., Masaaki N., (2005) On the concept and Mechanism of MN Fracture Theoery. J. Transactions of JWRI, 34 No.2: 73-80
Fouad H., et. al., (2011) Characterization and Processing of High Density Polyethylene/carbon nano-composites, Materials and Design 32: 1974-1980.
Gilman W., (1999)Falammability and thermal stability studies of polymer layered-silicate (clay) nanocomposites. National Institute of Standards and Technology, Gatherburg, MD, USA
Gilman W., et. al, (2011) Effect of Montmorillonite dispersion on flammability properties of poly(styrene-co-acrylomitrile) nanocomposites. Polymer, 52 (14): 3092.
Haraguchi K., (2002), Organic / inorganic hybrid hydrogel and manufacturing method therefor, US patent 6943206 B2
Hasmukh A P, et al., (2006). Nanocly for polymer nanocomposites, paints, inks, greases and cosmetics formulations, drug delivery vehicle and waste water treatment, Bull. Mat. Sci. 29, No.2: 133-145.
Kazimi M., et. al. (2014) characterization of functionalized low density polyethylene/polyaniline nano fiber compo-site, journal of medical and bioengineering, 3 No.4: 306-310.
Kornamann X., Lindberg H., and Berglund L., (2001) synthesis of epoxy-clay nanocomposites: influence of the nature of clay on structure, Polymer 42: 1303-1310.
Latin A m erican Journal of Solids and Structures 12 (2015) 385-419
Lili C., et. al., (2008) Effect of Organocl;ays purity and degradation on nanocomposite performance, Texas material institute, USA
Meneghetti P., Qutubuddin S., (2005). Application of mean field model of polymer melt intercalation in organic-silicates for nanocomposites. Journal of Colloid and Interface Science, 288:387-389
Nogi K., et. al, (2007), Handbook of Nanoparticles. Osaka Univ., Japan.
Okada A., Usuki A., (2006). Twenty Years of Polymer-clay Nanocomposite. Macromolecular materials and Engineer-ing, 291. 12: 1449-1476
Okamoto M., et. al, (2003). New Polylactide-layered silicate nanocomposites. Polymers. 44: 857-866
Subri A.G., Salah H., Hazwan K., (2008). Low density polyethylene-Nanoclay composites. Malaysian Polymer jour-nal (MPJ) 3. 2: 39-53.
Durate, H.V., Donadon, L.V., and Avila, A.F. (2014). Mechanical properties of nanocomposite laminated struc-ture and its sensibility to modal analysis procedure. Latin American Journal of Solids and Strucstruc-tures LAJSS, 11:245-259
Avila, A.F., Durate, H.V., and Soares, M.I. (2006). The nanoclay influence on impact response of laminated plates. Latin American Journal of Solids and Structures LAJSS, 3:30-20
Durate, H.V., Donadon, L.V., and Avila, A.F. (2011). Comparison of two modal procedures to determine mechan-ical properties of nanocomposite laminated structure. 21st International Congress of Mechanical Engineering, Na-tal, RN, Brazil
Durate, H.V., Donadon, L.V., and Avila, A.F. (2010). Mechanical properties of nanocomposite laminated struc-ture by modal method. 2nd International Conference on Engineering Optimization, Lispon, Portugal, 1-6
Velmurugan, R., and Balaganesan, G. (2011). Modal analysis of pre and post impacted nanocomposite laminates. Latin American Journal of Solids and Structures LAJSS, 8:9-26
Wang H., S. Hoa S., Wood P., (2006) new Method of synthesis of Clay/epoxy nanocomposites, Journal of applied polymer science, 100: 4286-4296
Zhang K., et. al., (2009), Sonochemical Preparation of Polymer nanocomposites, Molecules, 14: 2095-110.
Williams, J.G., Rink, M. (2007). The sta“dardizati”“ ”f the EWF test , J”ur“al ”f E“gineering Fracture Mechanics, 74: 1009-1017
Etienne M. F., Sharon, K. W. Fracture Toughness of Non Standard Specimens. School of Engineering, Bleking Insti-tute of Technology, Karlskrona, Sweden, 371. 44: 1-15
ASTM Designation: D 638 – 02a. Standard test Method for tensile properties of plastics. 46-58
Prasad, Venkatesha C. S., Jayarasu T. (2011) Experimental methods of determining fracture toughness of fiber rein-forced polymer composition under various loading conditions. Mineral & Material Characterization & Engineering, 10. 13: 1263-1275 http://www.nde-ed.org/Education resources/Community College/ma....
Alexandre C., et. al., (2012). Fracture Toughness characterization as a criterion for selection of friction materials. International journal of science and advanced technology, (ISSN 2221-8386), 2. 1