Vol.52, n. 1: pp.85-91, January-February 2009
ISSN 1516-8913 Printed in Brazil BRAZILIAN ARCHIVES OF
BIOLOGY AND TECHNOLOGY
A N I N T E R N A T I O N A L J O U R N A L
Metabolic and Morphometric Alterations Inherent to
Neuromuscular Electric Stimulation in the Antagonist
Muscle Submitted to Ankle Joint Immobilization
João Luiz Quagliotti Durigan
1, Karina Maria Cancelliero
2*, Paula Lima Bosi
1, Gabriel
Borges Delfino
1, Maria Imaculada de Lima Montebelo
1, Rinaldo Roberto de Jesus Guirro
1,
Carlos Alberto da Silva
1and Maria Luiza Ozores Polacow
11Departamento de Fisioterapia; Universidade Metodista de Piracicaba; Piracicaba - SP - Brasil. 2Rua Gomes
Carneiro, 875; 13400-530; Piracicaba - SP - Brasil
ABSTRACT
The aim of this work was to investigate the effect of the neuromuscular electrical stimulation (ES) on the metabolic and morfometric profile of the tibialis anterior muscle, antagonist to the soleus muscle which was stimulate, under the joint immobilization condition of the ankle for 7 and 15 days. The immobilization promoted the reduction in the muscle mass (I7: 17.36%, I15: 20.83%), in the glycogen content (I7: 48%, I15: 48%), in the muscle fibers areas (I7: 27%, I15: 40%) and increase in intramuscular connective tissue density (I7: 122%, I15: 206%). The EE didn’t promote significant alterations in the mass of the immobilized groups, however, promoted increase in the glycogen (IEE7: 31.25%; IEE15: 56.25%), reduction in the muscle fibers areas (IEE7: 14%, IEE15: 24.69%) and reduction in the connective tissue density (IEE7: 25.63%, IEE15: 49.09%) when compared with the respective immobilized groups.
Key words: Immobilization, muscle disuse, metabolic, morphometric, neuromuscular electrical stimulation,
rehabilitation
* Author for correspondence: [email protected]
INTRODUCTION
Several studies have demonstrated that the muscle disuse induces a series of harmful effects, such as the proliferation of intramuscular connective
tissue, muscular hypotrophy, reduction in
glycogen content, capillary density, serial
sarcomeres, as well as force and fatigue resistance (Józsa et al., 1990; Reardon et al., 2001). With the intention of minimizing the events set off by the muscle disuse, several techniques have been used, in an endeavor to improve the homeostatic
conditions of the muscle fibers, with
neuromuscular electrical stimulation (ES) (Silva et
al., 1999). It is worth pointing out that ES has been used directly in the disused muscle. However, some studies were not limited to analyzing its effect on the stimulated muscle only, but also on the antagonist and contralateral muscles. In this context, Lieber et al. (1988) described the effectiveness of the resource in minimizing the hypotrophy in the directly stimulated muscle (tibialis anterior), and also its antagonist (soleus), since the authors considered that the latter underwent passive stretching during the ES. Ashmore and Summers (1981) described a direct relationship between the passive stretching and the
Furthermore, it was also observed that the static stretching was more efficient for the muscle protein synthesis than the contraction induced by ES (Goldspink et al., 1995). Previous work have demonstrated that the ES minimized some of the harmful effects inherent to joint immobilization on the soleus muscle, such as the reduction of the muscle mass, fiber area, glycogen content, as well as an increase in the intramuscular connective tissue (Cancelliero et al., 2005; Durigan et al., 2006; Silva et al., 2006). These aspects have, however, not yet been characterized in the antagonistic muscles to those receiving the direct
electrical stimulation, during the joint
immobilization period.
Considering these observations, the aim of this study was to investigate the effect of the ES on the metabolic and morphometric profile of the tibialis anterior muscle, antagonist to the soleus muscle, which was stimulated under the condition of ankle immobilization in the neutral position for 7 and 15 days.
MATERIAL AND METHODOS
Male Wistar rats (3 to 4 months old; 250-300g) were kept under the controlled vivarium conditions, with free access to the food and water
and treated in accordance with the
recommendations in the Guide on the care and use of the laboratory animals (National Research
Council, 1996). The size of the box containing
three animals was 40 x 30cm and it was covered with the newspaper, in order to prevent the sawdust from entering the internal compartment of the orthoses and causing cutaneous lesions. The animals were divided into five groups (n=5): control (C), immobilized for 7 days (I7), immobilized for 15 days (I15), immobilized associated with the ES for 7 days (IES7) and immobilized associated with the ES for 15 days (IES15). For the immobilization, the rats were anesthetized with the sodic pentobarbital (50 mg/Kg weight) and the left hindlimb was immobilized with the acrylic resin model in the ankle neutral position (90o) associated with the polyvinyl chloride belt (40mm diameter) covered with the latex, besides two lateral rotators (15mm) which allowed the movement and left the knee and hip joints free (Silva et al., 2006).
The left hindlimb was tricotomized and ES was realized in daily sessions of 20 minutes for 7 and
15 days, initiating immediately after the
immobilization. An electrode (1cm2) was placed in
the inguinal region and the other (1cm2) in the triceps sural muscle in the immobilized limb so that this second electrode was connected inside of orthoses. The ES parameters were the frequency of 10Hz, pulsewidth of 0,4ms, two-phase quadratic pulse, intensity of 5.0mA, from the visualization of the muscle contraction, increased 1.0 mA after each 5 minutes to keep the contraction level during the all stimulation period. After the experimental period, the analyses performed in the tibialis anterior were glycogen content, weight, fiber area and intramuscular connective tissue.
To determine the muscle glycogen, the muscle
samples were digested in 30% KOH at 100oC and
the glycogen was precipitated by ethanol, after which, the sample was centrifuged at 3000 rpm for 15 minutes. The precipitated glycogen was submitted to the acid hydrolysis in the presence of phenol. The values were expressed in mg/100 mg of wet weight and the method used was of Siu et al. (1970).
For the morphometric analysis, the ventral segment of the tibialis anterior was fixed in buffered 10% formol solution. The tissue was embedded in the paraffin, cut into several non-serial 7 m thick cross-sections and stained with hematoxylin-eosin. The image analysis system used consisted of the Image Pro-plus 4.0 software (Media Cybernetics, Silver Spring, MD, USA) and
a digital camera (JVC® manufacturer,
Lawrenceville, GA, USA) coupled to a
microscope (Zeiss, Narberth, PA, USA) and connected to a microcomputer. All the images were captured at 10X magnification. The areas of 375 tibialis anterior muscle fibers from each animal were analyzed as follows: 15 fibers per area in five areas per section, and a total of five sections per animal. A square reticulum was used for randomly choosing 15 fibers per cuts that coincided with the straight intersections.
A planimetry system was used for the analysis of the intramuscular connective tissue density by scoring the points by means of a reticulum with
2500 m2 squares containing 56 straight line
intersections in the connective tissue (endomysium and perimysium) by the total number of points. The statistical analysis was initially performed by the Kolmogorov-Smirnov normality test and for the homoscedasticity test (Bartlett criterion). After
the observation that the variables had
contemplated the parametric methodology,
ANOVA test, was performed and when the presented difference was significant, the Tukey test was performed for the multiple comparisons. The level of significance was set at P < 0.05 for all the analyses.
RESULTS
Significant reduction was observed in the muscle mass (mg) as follows: 17.36% (p<0.05) in I7 group; and 20.83% (p<0.05) in I15 group, when compared with C, and no significant difference was observed between I7 and I15. Moreover, there was a reduction of 48% (p<0.05) in the glycogen content in both the immobilized groups. In the morphometric analysis, I7 and I15 groups demonstrated significant reduction in the fiber area when compared with C, represented by 27% and 40% (p<0.05), respectively, in addition to presenting significant differences among them. The intramuscular connective tissue density demonstrated a significant increase of 122% in I7 and of 206% in I15, in relation to C (p<0.05), and I7 presented significant difference when compared with I15.
The ES did not promote significant alterations (p>0.05) in the muscle mass in the IES7 and IES15 groups in relation to the respective immobilized groups. On the other hand, there was a significant increase of 31.25% in the glycogen content in the IES7 (p<0.05) and 56.25% in IES15 (p<0.05), when compared with the respective immobilized groups. Moreover, IES7 did not show significant difference when compared with IES15. The muscle fiber area presented a reduction of 14% in IES7 and 24.69% in IES15 (p<0.05) when compared with the respective immobilized groups, whereas IES7 and IES15 presented no significant difference. The resource also promoted a
significant reduction in intramuscular connective tissue density of 25.63% in the IES7 (p <0.05) and 49.09% in the IES15 (p <0.05) when compared
with the respective immobilized groups.
Futhermore, the IES7 presented no significant difference when compared with the IES15. (Table 1 and Fig. 1).
DISCUSSION
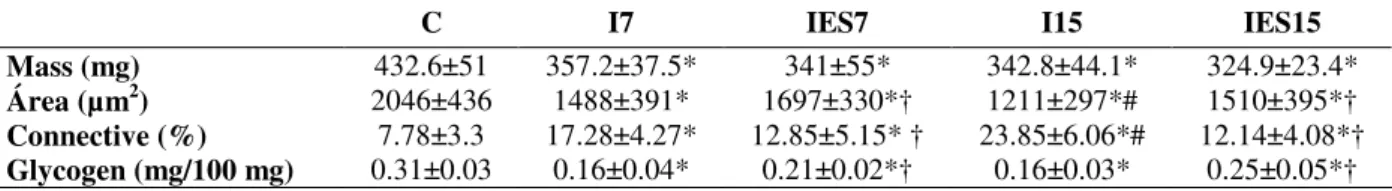
Table 1 - Mean±sd of tibialis anterior mass (mg), muscle fibers area (µm2), connective tissue area density (%), glycogen content (mg/100 mg) of control group (C), immobilized for 7 days (I7), immobilized for 15 days (I15), immobilized treated with ES for 7 days (IES7) and immobilized treated with ES for 15 days (IES15) n=5, p<0.05, * compared with control group, † compared whit respective immobilized group, # compared with I7.
C I7 IES7 I15 IES15
Mass (mg) 432.6±51 357.2±37.5* 341±55* 342.8±44.1* 324.9±23.4*
Área (µm2)
2046±436 1488±391* 1697±330*† 1211±297*# 1510±395*†
Connective (%) 7.78±3.3 17.28±4.27* 12.85±5.15* † 23.85±6.06*# 12.14±4.08*†
Glycogen (mg/100 mg) 0.31±0.03 0.16±0.04* 0.21±0.02*† 0.16±0.03* 0.25±0.05*†
Figure 1 - Tibialis anterior muscle fibers of C group (A), muscle fibers of I7 group (B), muscle fibers of IES7 group (C), muscle fibers of I15 group (D), muscle fibers of IES15 group (E). A reduction of muscle fiber area (*) and an increase of intramuscular connective tissue (arrows) can be seen in immobilized groups with compared to control group. An increase of muscle fiber area (*) and a decrease of intramuscular connective tissue (arrows) can be seen in immobilized associated to ES groups with compared to respective immobilized groups
The immobilization for 7 and 15 days in the neutral position promoted significant reduction in the tibialis anterior muscle mass, fiber area, increase of intramuscular connective tissue, in addition to reduction of the glycogen content, showing the interrelation of contractile activity with energy homeostasis and muscle fiber morphology, pointing towards a condition of muscle hypotrophy. According to Qin et al. (1997), the immobilization for different periods results in the hypotrophy varying from 15% to 70%, depending on the animals used and on the type of fibers assessed. Savolainen et al. (1988) reported reduction in the muscle mass to the order of 35.14% in the shortened position and of 16.31% in the stretched position in the rat tibialis anterior muscles submitted to the plaster cast ankle immobilization for 7 days. The immobilization for 7 days also promoted significant increase in the connective tissue density to the order of 122% and 168% on the fifteenth day, when compared with the control group. These results are in agreement with the literature, since for Józsa et al. (1990), irrespective of the muscular disuse model studied (immobilization, tenotomy or denervation) and of the muscle type, the amount of connective tissue in the endomysium and perimysium increased significantly, varying from 50% to 700%.
The muscle disuse caused by the conditions of long periods in the bed, ortheses or limb fixations and microgravity, induces resistance to the insulin and a catabolic state in the affected skeletal muscles of the humans (Ferrando et al., 1996). Hirose et al. (2000), in rats that had the left hindlimb immobilized in the neutral position for 7 days, observed reduction in the transduction of the intracellular signal stimulated by the insulin, suggesting deficit in the insulin receiver activation and in the molecules activated by this, indicating that the insulin resistance could also be set off during the immobilization. This condition of
resistance to insulin could explain the
compromised glycogen content as a result of the immobilization of the tibialis anterior muscle analyzed in the above mentioned study.
As regards the use of the ES, the resource was shown to be effective in minimizing the increase of the connective tissue density, as well as reducing the muscle fiber area of the tibialis anterior submitted to immobilization for 7 and 15 days. These results corroborate the statement of Avramidis et al. (2003) who described the
importance of the ES to recovering the muscle force, reducing the connective tissue, reducing the time of rehabilitation and preventing the muscle atrophy due to the immobilization. Qin et al. (1997) used the ES with a frequency of 50Hz applied daily for 30 minutes, five times the week for three weeks in the rabbit tibialis anterior muscles and observed that the resource was effective for preventing the muscular hypotrophy, minimizing the fiber area reduction, interstitial fibroses and blood supply deficiency.
According to Goodyear et al. (1992), the increase in the glycogen content was due to the larger glucose uptake by the GLUT4 population that was insensitive to the insulin, externalized and resulted from the activation of the enzymatic cytosolic systems in the glycogenesis. Other studies also mentioned the ES as a resource that increased the glucose uptake and metabolism, and cellular metabolic pathway activities (Silva et al., 1999; Guirro et al., 2004). Etgen et al. (1993) evaluated the GLUT 4 content in the rat plantar muscle after the chronic ES and observed an increase of 82% in its content. Longer periods of the ES, 30 to 40 and 60 to 90 days, only showed a tendency towards increase in GLUT4 content, reaching a plateau around 30 to 40 days. An important result of the study of Hamada et al. (2003) was that the corporal glucose uptake in the rats was acutely increased in response to 20 minutes of the ES, and this increase lasted for at least 90 minutes after the use of the resource ended. The results of the present study demonstrated that the muscular glycogen remained elevated even after 24 h of the ES.
activation through the antidromic transport. The results of the present study corroborated these findings, since the direct stimulation of the soleus muscle minimized the reduction of the fiber area, glycogen content and the increase in theconnective tissue density in the tibialis anterior muscle. These findings cannot, however, be attributed to the passive stretching, since the immobilization promoted by the acrylic resin ortheses fixed the ankle in a neutral position that disabled the stretching of the tibialis anterior muscle. Moreover the current density used in that study was 5
mA/cm2, being extremely high, considering that
for the fist flexors muscle contraction elicited by the ES in the human, a current density of between 0.5 and 2 mA/cm2 was used. (Wang et al., 2004) The high current density applied in the animals might have generated an electrical field broad
enough to stimulate both the posterior
compartment (directly stimulated soleus muscle), and the anterior (tibialis anterior). The proximity of the soleus muscles and tibialis anterior, as well as the good electrical current transport by the muscular tissue should also be considered. Thus, the tibialis anterior could have been activated by the action of the electrical field, minimizing the harmful effects promoted by the immobilization. The ES applied directly in the soleus muscle minimized the reduction of the glycogen content, fiber area and increase in the connective tissue density in the tibialis anterior muscle during the joint immobilization condition in the periods of 7 and 15 days. Thus, the importance of the physical therapy intervention with the ES during this period could be important, not only to minimize the muscle skeletal alterations in the directly stimulated muscle, but also in its antagonist, since the ES was a resource of extreme importance in the rehabilitation process.
RESUMO
O objetivo desse trabalho foi investigar o efeito da estimulação elétrica neuromuscular (EE) sobre o perfil metabólico e morfométrico do músculo tibial anterior, antagonista ao músculo sóleo, o qual foi estimulado, sob a condição de imobilização articular de tornozelo durante 7 e 15 dias. A imobilização promoveu redução na massa muscular (I7: 17,36%, I15: 20,83%), no conteúdo de glicogênio (I7: 48%, I15: 48%), na área das
fibras musculares (I7: 27%, I15: 40%) e aumento na densidade do tecido conjuntivo intramuscular (I7: 122%, I15: 206%). A EE não promoveu alterações significativas na massa muscular dos grupos imobilizados, porém, promoveu aumento no glicogênio (IEE7: 31,25%; IEE15: 56,25%), redução na área das fibras musculares (IEE7: 14%, IEE15: 24,69%) e redução na densidade do tecido conjuntivo de (IEE7: 25,63%, IEE15: 49,09%) quando comparado aos respectivos grupos imobilizados.
REFERENCES
Appell H.J. (1986), Skeletal muscle atrophy during immobilization. Int J Sports Med., 7, 1-5.
Ashmore C.R. and Summers P.J. (1981), Stretch-induced growth in chicken wing muscles: myofibrillar proliferation. Am J Physiol., 241, 93-7. Avramidis K.; Strike P.W.; Taylor P.N.and Swain I.D.
(2003), Effectiveness of electric stimulation of the vastus medialis muscle in the rehabilitation of patients after total knee arthroplasty. Arch Phys Med Rehabil., 84, 1850-53.
Bodine S.C.; Latres E.; Baumhueter S.; Lai V.K.and Glass D.J. (2001), Identification of Ubiquitin Ligases Required for Skeletal Muscle Atrophy. Science, 1704, 1704-1708.
Cancelliero K.M.; Dias C.K.N.; Silva C.A. and Guirro R.R.J. (2005), Imobilização altera o conteúdo de glicogênio e peso muscular de acordo com o período e a posição articular. Rev Bras Fisioter., 9, 173-179. Durigan J.L.Q.; Cancelliero K.M.; Dias C.K.N.; Silva
C.A.; Guirro R.R.J.and Polacow M.L. (2006), Efeitos da estimulação elétrica neuromuscular sobre o membro posterior imobilizado de ratos durante 15 dias: análises metabólicas e morfométricas. Rev Bras Fisioter, In press.
Etgen G.J.; Farrar R.P.and Ivy J.L. (1993), Effect of chronic electrical stimulation on GLUT 4 protein content in fast-twitch muscle. Am J Physiol., 264, 816-19.
Ferrando A.A.; Lane H.W.; Stuart C.A.; Davis-Street J. and Wolfe R.R. (1996), Prolonged bed rest decreases skeletal muscle and whole body protein synthesis. Am J Physiol.,270, 627-33.
Fournier M.; Roy R.R.; Perham H.; Simard C.P. and Edgerton V.R. (1983), Is limb immobilization a model of muscle disuse? Exp Neurol,. 80, 147-56. Goldspink D.F.; Cox V.M.; Smith S.K.; Eaves L.A.;
Osbaldeston N.J.; Lee D.M. and Mantle D. (1995), Muscle growth in response to mechanical stimuli. Am J Physiol., 268, 288-97.
function, and subcellular distribution in rat skeletal muscle after exercise training. Diabetes, 41, 1091-1099.
Guirro R.R.J.; Silva C.A.; Forti F. and Cancelliero K.M. (2004), Análise do músculo esquelético desnervado tratado com metformina e/ou estimulação elétrica de baixa freqüência. Rev Bras Fisioter, 8, 21-27.
Hamada T.; Sasaki H.; Hayashi T.; Moritani T. and Nakao K. (2003), Enhancement of whole body glucose uptake during and after human skeletal muscle low-frequency electrical stimulation. J Appl Physiol, 94, 2107-2112.
Hirose M.; Kaneki M.; Sugita H.; Yasuhara S. and Martyn J.A. (2000), Immobilization depresses insulin signaling in skeletal muscle. Am J Physiol Endocrinol Metab, 279, 1235-41.
Józsa L.; Kannus P.; Thoring J.; Reffy A.; Jarvinen M. and Kvist M. (1990), The effect of tenotomy and immobilization on intramuscular connective tissue. J Bone Joint Surg., 72, 293-7.
Lieber R.L.; Ferro T.D. and Hargens A.R. (1988), Differential effects of 10-Hz and 50 Hz-stimulation of the tibialis anterior on the ipsilateral, unstimulated soleus muscle. Exp Neurol., 100, 426-35.
Mathieu O.; Cruz-orive L.M.; Hoppeler H. and Weibel E.R. (1981), Measuring error and sampling variation in stereology: comparison of the efficiency of various methods for planar image analysis. J Microsc, 121, 75-88.
National Research Council. (1996), Guide for the Care and Use of Laboratory Animals. Washington: National Academy Press.
Okita M.; Yoshimura T.; Nakano J.; Motomura M. and Eguchi K. (2004), Effects of reduced joint mobility on sarcomere length, collagen fibril arrangement in the endomysium, and hyaluronan in rat muscle. J Muscle Res Cell Motil, 25,159-66.
Picquet F. and Falempin M. (2003), Compared effects of hindlimb unloading versus terrestrial deafferentation on muscular proprieties of the rat soleus.Exp Neurol, 182, 186-164.
Qin L.; Appell H.J.; Chan K.M. and Maffulli N. (1997), Electrical stimulation prevents immobilization atrophy in skeletal muscle of rabbits. Arch Phys Med Rehabil,78, 512-7.
Reardon K.A.; Davis J.; Kapsa R.M.; Choong P. and Byrne E. (2001), Myostatin, insulin-like growth factor-1, and leukemia inhibitory factor mRNAs are upregulated in chronic human disuse muscle atrophy. Muscle Nerve, 24, 893-9.
Savolainen J.; Vaananen K.; Puranen J.; Takala T.E.; Komulainen J. and Vihko V. (1988), Collagen synthesis and proteolytic activities in rat skeletal muscle: effect of cast-immobilization in the lengthened and shortened positions. Arch Phys Med Rehabil, 69, 964-969.
Silva C.A.; Guirro R.R.J.; Polacow M.L.O.; Cancelliero K.M. and Durigan J.L.Q. (2006), Rat hindlimb joint immobilization with acrylic resin orthoses. Braz J Med Biol Res., In press.
Silva C.A.; Guirro R.R.J.; Polacow M.L.O; Silva H.; Tanno A.P. and Rodrigues D. (1999), Efeito da meftormina e estimulação elétrica sobre as reservas de glicogênio do músculo sóleo normal e denervado. Rev Bras Fisiot., 3,55-60.
Siu L.O.; Russeau J.C. and Taylor A.W. (1970), Determination of glycogen in small tissue samples. J Apll Physiol, 28, 234-236.
Wang J.S.; Chen S.Y.; Lan C.; Wong M.K. and Lai J.S. (2004), Neuromuscular electric stimulation enhances endothelial vascular control and hemodynamic function in paretic upper extremities of patients with stroke. Arch Phys Med Rehabil., 85, 1112-6.
Williams P.E.; Catanese T.; Lucey E.G. and Goldspink G. (1988), The importance of stretch and contractile activity in the prevention of connective tissue accumulation in muscle. J Anat., 158, 109-114. Williams P.E. and Goldspink G. (1984), Connective
tissue changes in immobilized muscle. J Anat, 138, 343-504.