Kinetic Analysis of the Gas-Phase Reactions of Methacrolein with
the OH Radical in the Presence of NO
xAndré Silva Pimentel*, and Graciela Arbilla
Departamento de Físico-Química, Instituto de Química,
Universidade Federal do Rio de Janeiro, Centro de Tecnologia, Bloco A, Sala 408,
Cidade Universitária, 21949-900 Rio de Janeiro - RJ, Brazil
Um mecanismo explícito para a reação da metacroleína (MTA) com radicais OH, numa mistura NOx - ar, foi simulado resolvendo as equações diferenciais ordinárias usando o método Runge-Kutta-4-semi-implícito. Os resultados simulados são consistentes com os dados experimentais publicados e o modelo explica as principais vias de reação para a oxidação da MTA com radicais OH na presença de NOx - ar. Usando uma análise dos autovetores e autovalores dos coeficientes de sensibilidade, para todas as espécies químicas envolvidas em diferentes tempos de reação, foi extraída informação cinética do sistema. Este método foi utilizado para reduzir o modelo cinético de forma objetiva. Foi utilizado, também, o método tradicional de análise de velocidade de produção (ROPA) para estudar a importância relativa das reações individuais. Usando a informação da análise de componente principal e da análise de velocidade de produção, foram identificadas as principais reações individuais.
An explicit chemical mechanism for the reaction of methacrolein (MTA) with OH radicals in NOx-air systems, was simulated by solving the corresponding ordinary differential equations using Runge-Kutta-4-semi-implicit method. The simulated results are consistent with the published experimental data and the model accounts for all the major pathways by which MTA reacts in NOx-air systems. An eigenvalue-eigenvector analysis is used to extract meaningful kinetic infor-mation from linear sensitivity coefficients computed for all species of the chemical mechanism at several time points. This method is used to get an objective condition for constructing a minimal reaction set. Also, a classic method called rate of production analysis (ROPA) was used for the study of the reactions relevance. Using the principal component information as well as the rate of production analysis the main paths of reaction are identified and discussed.
Keywords: principal component analysis, eigenvalue-eigenvector analysis, rate of production analysis, methacrolein
Introduction
Methacrolein is an α,β-unsaturated aldehyde. It is pro-duced in a significant yield from the gas-phase reactions of isoprene, a vegetative emission1-6, with OH radical in the presence of NOx7-10 and O311-12. Since the emissions of isoprene may dominate over anthropogenic nonmethane emissions on regional and global scales13-15, a knowledge of the atmospheric chemistry of methacrolein is a necessary input into the chemical mechanism for the atmospheric photooxidation of isoprene for use in airshed computers models16-17. Under atmospheric conditions, the major loss process for methacrolein is calculated to occur by reaction with the OH radical18.
In this work, the gas-phase reactions of methacrolein (hereafter MTA, CH2=C(CH3)CHO) with OH radicals in NOx-air systems are simulated and an eigenvalue-eigen-vector analysis of the linear sensitivity coefficients, called Principal Component Analysis19, is used to assess the pa-rameter-concentration interdependence and obtain a re-duced mechanism.
Reaction rate analysis for complex kinetic systems in-cludes the solution of a mathematical model, i. e., a set of coupled kinetic ordinary differential equations, the study of the effects of parameter changes on the results and the exploration of important reaction pathways19-25. This infor-mation is important to decide which reactions should be included in a atmospheric photochemical mechanism and, Article
also, which reactions should be experimentally studied. A good mechanism should be as simple as possible and the number of its parameters and components should be mini-mum.
Only one experimental study has been conducted for the MTA reaction with OH radicals26. In this study the products of MTA oxidation were measured and identified, obtaining d irectly qu an titativ e y ield s fo r h yd ro xy aceto ne (HOCH2C(O)CH3) , methylglyoxal (CH3COCHO), for-maldehyde (HCHO) and peroxymethacryloyl nitrate (here-after PMN, CH2=C(CH3)C(O)OONO2). The authors have also discussed and recommended a mechanism to represent the MTA + OH chemistry. Nevertheless, to our knowledge, the solution of kinetic differential equations and a sensitiv-ity analysis of the mechanism have not been done up to now.
Since the calculated results from a deterministic model are strictly a function of its parameters and variables as time, temperature and pressure, in these simulations the initial conditions for the simulations were those of the experimental work26 in order to compare the calculated and laboratory smog chamber results.
The Chemical Mechanism
As experimentally determined26 MTA reacts essentially with OH radicals by H-atom abstraction, with an overall rate constant of 3.35 x 10⁻¹¹ cm3 molecule-1 s-1 at 298 K27. The complete chemical mechanism is listed in Table 1. It includes 38 species and 50 reactions. It was proposed on the basis of previous mechanisms28,29 and of the known MTA26 and PMN30 chemistry. Thermal rate constants were either taken from literature31-34 or estimated by comparison
Table 1. Chemical Mechanism for Gas-Phase Reactions of MTA with the OH Radical in the Presence of NOx.
Reactions Rate Constants at 298 K
Units of molecule, cm3, s
#1) HONO + OH → H2O + NO2 k1 = 4.86 x 10⁻¹²
#2) OH + HNO3→ H2O + NO3 k2 = 1.50 x 10⁻¹³
3) NO + OH → HONO k3a = 1.12 x 10⁻¹¹
4) OH + NO2→ HNO3 k4a = 1.34 x 10⁻¹¹
5) HO2 + NO → OH + NO2 k5 = 8.28 x 10⁻¹²
6) NO + O3→ NO2 + O2 k6 = 1.81 x 10⁻¹⁴
7) NO + NO3→ 2 NO2 k7 = 2.60 x 10⁻¹¹
8) NO2 + O3→ NO3 + O2 k8 = 3.23 x 10⁻¹⁷
9) HONO + hν→ OH + NO j9 = 1.63 x 10⁻³
10) NO2 + hν + (O2) → NO + O3 j10 = 4.26 x 10⁻³
11) HCHO + OH + (O2) → HO2 + CO + H2O k11 = 9.57 x 10⁻¹²
12) CH3CHO + OH + (O2) → CH3CO3 + H2O k12 = 1.58 x 10⁻¹¹
13) CH3O + (O2) → HCHO + HO2 k13 = 4.59 x 10⁴
14) CH3O2 + NO → NO2 + CH3O k14 = 7.68 x 10⁻¹²
15) CH3CO3 + NO + (O2) → NO2 + CH3O2 + CO2 k15a = 9.98 x 10⁻¹²
16) CH3CO3 + NO2→ CH3CO3NO2 k16 = 3.63 x 10⁻¹²
17) CH3CO3NO2→ CH3CO3 + NO2 k17 = 1.81 x 10⁻⁴
18) CH3CH2O + O2→ CH3CHO + HO2 k18 = 9.48 x 10⁻¹⁵
19) CH3CH2O + NO → CH3CH2ONO k19 = 4.40 x 10⁻¹¹ (k∞)
20) CH2=C(CH3)CHO + OH + (O2) → 0.42 HOCH2C(O2)(CH3)CHO +
0.08 O2CH2C(OH)(CH3)CHO + 0.50 CH2=C(CH3)C(O)OO + 0.50 H2O
k20b = 3.35 x 10⁻¹¹
21) HOCH2C(O2)(CH3)CHO + NO → HOCH2C(O)(CH3)CHO + NO2 k21c = 8.90 x 10⁻¹²
22) HOCH2C(O)(CH3)CHO + (O2) → HOCH2C(O)CH3 + CO + HO2 k22c = 7.00 x 10⁴
23) O2CH2C(OH)(CH3)CHO + NO → OCH2C(OH)(CH3)CHO + NO2 k23c = 8.90 x 10⁻¹²
with similar compounds35 when there was no available information. As photochemical reaction rates are depend-ent on the experimdepend-ental conditions and were not reported by Tuazon and Atkinson26 they were estimated on the basis of the methacrolein photooxidation experimental data26.
Methodology
As usual, the chemical process can be described by a system of kinetic differential equations,
∂c(t)
∂t = f (k, c(t))
where c(t) is the n-vector of species concentrations with c(t = 0) = c0 and k is the m-vector of kinetic parameters. For complex systems a numerical solution is required. The
available methods to solve the differential equations and to investigate the main features of the mechanism are fully discussed in the literature19,24,25,36-38.
In investigating a chemical mechanism, it is important to assess the effects of parameter uncertainties on the pre-dicted concentrations of the various intermediate and prod-uct species. This analysis is known as sensitivity analysis and is useful in determining the main reaction path. An element of the first order local concentration sensitivity matrix, Sij is given by
Sij(k0, c0, t1, t2) = ∂ ci(t2)
∂kj
and is the linear approximation of concentration change of species i at the time t2 caused by the differential change of 25) CH3C(OH)CHO + (O2) → CH3C(O)CHO + HO2 k25c = 3.80 x 10⁶
26) CH2=C(CH3)C(O)OO + NO2→ CH2=C(CH3)C(O)OONO2 k26 = 3.60 x 10⁻¹²
27) CH2=C(CH3)C(O)OONO2→ CH2=C(CH3)C(O)OO + NO2 k27 = 2.30 x 10⁻⁴
28) CH2=C(CH3)C(O)OO + NO → CH2=C(CH3)C(O)O + NO2 k28c = 8.90 x 10⁻¹²
29) CH2=C(CH3)C(O)O + (O2) → CH2=C(CH3)O2 + CO2 k29c = 7.00 x 10⁴
30) CH2=C(CH3)O2 + NO + (O2) → O2CH2C(O)CH3 + NO2 k30c = 8.90 x 10⁻¹²
31) O2CH2C(O)CH3 + NO → OCH2C(O)CH3 + NO2 k31c = 8.90 x 10⁻¹²
32) OCH2C(O)CH3 + (O2) → HCHO + CH3CO3 k32c = 7.00 x 10⁴
33) CH2=C(CH3)C(O)OONO2 + OH + (O2) → O2CH2C(OH)(CH3)C(O)OONO2 k33 = 3.60 x 10⁻¹²
34) O2CH2C(OH)(CH3)C(O)OONO2 + NO → OCH2C(OH)(CH3)C(O)OONO2 + NO2 k34c = 8.90 x 10⁻¹²
35) OCH2C(OH)(CH3)C(O)OONO2→ 0.51 HOCH2C(O)CH3 + 0.51 CO3NO2 +
0.49 CH3C(O)C(O)OONO2 + 0.49 HCHO
k35c = 7.00 x 10⁴
36) CH3CH2ONO + hν→ CH3CH2O + NO j36c = 2.15 x 10⁻⁴
#37) 2 OH → H2O2 k37 = 1.14 x 10⁻¹¹
#38) H2O2 + OH → H2O + HO2 k38 = 1.70 x 10⁻¹²
39) HO2 + HO2→ H2O2 + O2 k39 = 7.73 x 10⁻¹²
40) HO2 + NO2→ HO2NO2 k40 = 2.33 x 10⁻¹²
41) HO2NO2→ HO2 + NO2 k41 = 1.68 x 10⁻¹
42) NO2 + NO3→ N2O5 k42 = 6.56 x 10⁻¹³
43) N2O5→ NO2 + NO3 k43 = 2.27 x 10⁻²
44) CH3O + NO → CH3ONO k44 = 2.13 x 10⁻¹¹
#45) CH3O + NO2→ CH3ONO2 k45 = 8.75 x 10⁻¹²
46) CH3O2 + NO2→ CH3O2NO2 k46 = 2.93 x 10⁻¹²
47) CH3O2NO2→ CH3O2 + NO2 k47 = 1.698
48) HCHO + (2 O2) + hν→ 2 HO2 + CO j48 = 1.76 x 10⁻⁵
49) HCHO + hν→ H2 + CO j49 = 2.66 x 10⁻⁵
the parameter of reaction j at time t1 from value kj0 to kj. In this work the parameters are the photochemical coefficients and the thermal rate constants.
Sensitivity coefficients are normalized in order to elimi-nate their dependence on the dimensions of the kinetic model. The parameter-concentration interdependence may be described in two ways: by the overall sensitivities, which are the sum of the squares of the normalized sensitivities, and by the principal component analysis of the normalized sensitivity matrix. The overall sensitivities give the effect of a single parameter on a concentration group. The princi-pal component analysis consists in the identification of the parameters group which has joint influence on a concentra-tion group. This method is a kind of factor analysis and its main goal is to decry those hidden factors which have generated the dependence or variation in responses.
The eigenvectors of the matrix STS, where S is the array of sensitivity coefficients, identify parameter groups while the eigenvalues give information about the effectiveness of these parameter groups for the change of species concen-trations. A parameter is considered important if it belongs to a large element of an eigenvector corresponding to a large eigenvalue. The lth principal component of the system is the linear compound
Ψl= a1l X1 +…+ ap1 Xp
whose coefficients apl are the characteristic vector elements associated with the l eigenvalue. The importance and usefulness of the component would be measured by the total variance magnitude attributable to it, that is by the ratio of its eigenvalue λl to the sum of all eigenvalue.
An alternative way and more classical method for the investigation of the reactions relevance is the rate of pro-duction analysis called ROPA38,39. This method calculates the contribution of each reaction step to the total production rate of each species using concentration data and the rate coefficients. Although very simple to implement, this method gives results which are rather difficult to interpret in a correct way and sometimes leads to misleading conclu-sions. Thus, the combination of species reduction and rate sensitivity analysis25 seems to be a more effective way for this purpose, the rate of production analysis is a classic method for the identification of important reaction path-ways. This methodology requires the calculation of the Pij matrix elements40,41, which show the contribution of reac-tion j to the rate of producreac-tion of species i.
Results and Discussions
The full mechanism and rate constants are presented in Table 1. The reduced mechanism was obtained after elimi-nation of the unimportant reactions (denoted by # in Table 1) on the basis of the principal component analysis de-scribed below. The rank of reactions ordered by overall
sensitivities and rates is shown in Table 2. We calculated normalized sensitivities for all species at time points 1.9, 6.9, 11.9, 15.9, 19.9, 24.9 and 40.9 min. Eigenvalues of STS and the corresponding eigenvectors are listed in Table 3.
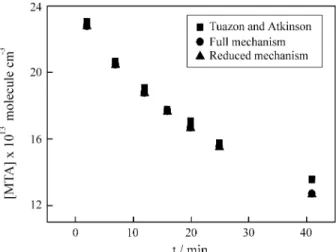
In the conditions of the modeling, the main source of hydroxyl radicals is the reaction (5) (HO2 + NO → OH + NO2) which follows the photolysis of the ethyl nitrite (CH3CH2ONO + hν→ CH3CH2O + NO) and the oxidation of the CH3CH2O radicals (CH3CH2O + O2→ CH3CHO + HO2). Reaction (5) accounts for ca. 95% of OH radical formed and the only significant sources of NO are the photodecomposition of ethyl nitrite (7%) and NO2 (93%), reactions (36) and (10), respectively. Since photolysis light intensities during the experiments were not reported26, the ethyl nitrite photodecomposition coefficient was estimated from the experimental concentration profiles of MTA as a function of time (Fig. 1). This method of parameter estima-tion is supported by the facts discussed above: in the smog chamber conditions, the only significant source of hydroxyl radicals is ethyl nitrite phololysis and MTA reacts primarily with OH radicals. The selected values gave consistent results for other photodecompositions and are also in agree-ment with the value reported in literature42 for NO2 in the same experimental conditions. The set of reactions (Table 1) accounts for the MTA photooxidation in good agreement with experimental data (Fig. 1). As presented in Fig. 2, simulated results for the formation of the main products where hydroxyacetone and methylglyoxal show a good agreement with experimental data. On the other hand, formaldehyde and peroxymethacryloyl nitrate (Figs. 3 and 4), show a slight deviation mainly for longer times.
In these simulation conditions, formaldehyde is formed both from acetaldehyde, the initial product of ethyl nitrite photolysis, reaction (36), and by the sequence of reactions initiated by OH radical oxidation of MTA, reaction (20):
CH2=C(CH3)C HO + OH + (O2) → 0 .4 2 HOCH2C(O2)(CH3)CHO + 0.08 O2CH2C(OH)(CH3)CHO + 0.50 CH2=C(CH3)C(O)OO + 0.50 H2O
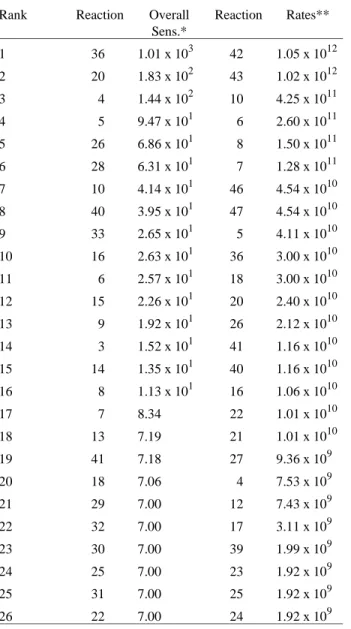
Table 2. Rank of reactions by overall sensitivity and rates.
Rank Reaction Overall Sens.*
Reaction Rates**
1 36 1.01 x 10³ 42 1.05 x 10¹²
2 20 1.83 x 10² 43 1.02 x 10¹²
3 4 1.44 x 10² 10 4.25 x 10¹¹
4 5 9.47 x 101 6 2.60 x 10¹¹
5 26 6.86 x 101 8 1.50 x 10¹¹
6 28 6.31 x 101 7 1.28 x 10¹¹
7 10 4.14 x 101 46 4.54 x 10¹⁰
8 40 3.95 x 101 47 4.54 x 10¹⁰
9 33 2.65 x 101 5 4.11 x 10¹⁰
10 16 2.63 x 101 36 3.00 x 10¹⁰
11 6 2.57 x 101 18 3.00 x 10¹⁰
12 15 2.26 x 101 20 2.40 x 10¹⁰
13 9 1.92 x 101 26 2.12 x 10¹⁰
14 3 1.52 x 101 41 1.16 x 10¹⁰
15 14 1.35 x 101 40 1.16 x 10¹⁰
16 8 1.13 x 101 16 1.06 x 10¹⁰
17 7 8.34 22 1.01 x 10¹⁰
18 13 7.19 21 1.01 x 10¹⁰
19 41 7.18 27 9.36 x 10⁹
20 18 7.06 4 7.53 x 10⁹
21 29 7.00 12 7.43 x 10⁹
22 32 7.00 17 3.11 x 10⁹
23 30 7.00 39 1.99 x 10⁹
24 25 7.00 23 1.92 x 10⁹
25 31 7.00 25 1.92 x 10⁹
26 22 7.00 24 1.92 x 10⁹
Rank Reaction Overall Sens.*
Reaction Rates**
27 24 7.00 11 1.42 x 10⁹
28 23 7.00 33 8.25 x 10⁸
29 34 7.00 34 8.25 x 10⁸
30 21 7.00 35 8.25 x 10⁸
31 39 6.78 49 6.98 x 10⁸
32 46 6.74 48 4.62 x 10⁸
33 47 6.74 14 3.69 x 10⁸
34 12 6.44 13 3.62 x 10⁸
35 42 5.95 50 2.95 x 10⁸
36 50 4.07 9 2.41 x 10⁸
37 43 3.69 29 1.62 x 10⁸
38 27 1.75 28 1.62 x 10⁸
39 48 7.18 x 10⁻¹ 30 1.62 x 10⁸
40 17 4.24 x 10⁻¹ 32 1.62 x 10⁸
41 11 4.05 x 10⁻¹ 31 1.62 x 10⁸
42 44 1.68 x 10⁻¹ 15 9.04 x 10⁷
43 19 9.66 x 10⁻² 2 2.97 x 10⁷
44 45 3.45 x 10⁻² 3 1.95 x 10⁷
45 1 2.00 x 10⁻² 38 1.18 x 10⁷
46 49 5.56 x 10⁻³ 45 6.88 x 10⁶
47 37 2.36 x 10⁻⁴ 1 4.02 x 10⁶
48 2 1.38 x 10⁻⁴ 19 1.80 x 10⁶
49 38 4.48 x 10⁻⁵ 44 5.19 x 10⁴
50 *** 37 3.62 x 10²
*undimensional. **units in molecule, cm3 and s. ***Overall sensitivity for reaction 35 was not calculated because of numerical convergence problems.
Table 3. Eigenvalues and eigenvectors for the mechanism of MTA photooxidation.
Eigenvaluesa 1.51 x 10³ 8.95 x 101 7.93 x 101 3.71 x 101 3.25 x 101 2.86 x 101 1.92 x 101 1.49 x 101 1.27 x 101 1.06 x 101 Eigenvectorsb
1 (36) .810 (26) .508 (5) -.476 (20) .487 (5) .569 (9) .535 (9) -.402 (33) .465 (20) .307 (13) -.375 2 (20) .323 (28) -.477 (10) -.430 (14) .351 (10) -.358 (3) -.394 (40) .379 (41) -.408 (9) -.275 (16) -.359 3 (4) -.298 (10) -.363 (6) .343 (9) .275 (6) .288 (14) -.328 (8) .342 (40) .398 (46) .261 (18) .326 4 (5) -.202 (6) .293 (33) -.338 (16) .260 (14) -.257 (20) .261 (33) -.247 (9) .215 (47) -.261 (4) -.288 5 (33) .274 (36) -.311 (3) -.234 (4) -.241 (15) .241 (7) -.245 (36) -.203 (40) -.257 (41) .285 6 (20) -.244 (20) .268 (5) .233 (26) -.211 (16) -.236 (20) .242 (4) -.241 (15) .283 7 (40) .227 (12) -.214 (39) -.201 (46) .216 (28) -.233 (8) -.232 (36) -.232
8 (46) -.213 (47) -.216 (26) .222 (39) .229 (40) -.221
9 (47) .213 (39) -.221 (5) -.227
10 (33) .210 (10) .226
HO2. Under the modelling conditions, the decomposition reactions of formaldehyde, reactions (11), (49) and (48), are initially 11% of the total and after this the yield increases up to 45% at the end of reaction. As observed experimen-tally26,42, the formed formaldehyde reacts essentially with OH radicals which are in relatively high concentrations
(calculated values about 0.6-1.3 x 10⁷ molecule cm-3). In comparison with the OH radical reaction (11) (HCHO + OH + (O2) → HO2 + CO + H2O), the photochemical decompositions (39) and (40) (HCHO + (2 O2) + hν→ 2 HO2 + CO and HCHO + hν→ H2 + CO) are of non-negli-gible importance (30-40%).
Eigenvaluesa 9.50 7.69 7.00 7.00 7.00 7.00 7.00 7.00 6.45 6.24
Eigenvectorsb
1 (8) .491 (18) -.400 (23) -.522 (32) -.685 (30) .713 (31) -.625 (24) .734 (21) -.629 (18) -.409 (42) .565 2 (7) -.334 (13) -.380 (25) .451 (22) .445 (31) -.474 (29) .548 (25) -.676 (23) .565 (15) .401 (43) -.458 3 (41) .314 (25) -.321 (22) -.407 (29) .415 (29) -.402 (22) -.385 (22) -.411 (13) -.365 (18) .258 4 (13) .276 (22) -.321 (32) -.372 (21) -.304 (22) .214 (21) .319 (24) .251 (12) -.293 (23) -.222
5 (10) -.236 (24) -.321 (24) .344 (30) .223 (25) .223 (4) .244 (21) -.221
6 (4) .212 (29) -.222 (30) .255 (9) -.243 (4) .204
7 (42) .212 (32) -.222 (20) .203 (8) -.202
8 (16) .205 (9) .219
9 (50) .210
10 (42) .201
Eigenvaluesa 5.68 5.46 4.57 4.19 3.86 3.36 2.62 1.94 1.63 1.22
Eigenvectorsb
1 (18) -.636 (34) .739 (14) -.399 (28) .389 (12) .440 (26) -.520 (34) .405 (33) -.400 (50) -.433 (3) .506 2 (16) -.313 (4) -.273 (46) -.393 (26) .377 (15) -.421 (28) -.497 (21) .354 (31) -.361 (15) .424 (39) .431 3 (13) .294 (47) .393 (16) -.311 (3) -.315 (16) -.346 (23) .354 (30) -.361 (16) .387 (20) .341 4 (4) -.270 (13) .351 (14) .271 (9) -.289 (50) -.210 (14) .292 (28) -.299 (12) .303 (4) .330 5 (42) .256 (34) .315 (50) -.242 (50) .250 (39) -.260 (29) -.296 (41) -.260 (41) -.244 6 (50) -.239 (15) .305 (21) -.232 (14) -.246 (29) -.243 (32) -.296 (3) -.258 (5) .235
7 (43) -.213 (23) -.232 (20) .221 (32) -.243 (3) .244 (4) -.223 (33) .218
Eigenvaluesa 1.05 9.57 x 10-15.93 x 10-14.71 x 10-12.10 x 10-17.94 x 10-24.46 x 10-23.28 x 10-22.91 x 10-21.52 x 10⁻² Eigenvectorsb
1 (39) -.668 (12) .492 (6) -.395 (27) -.795 (7) .424 (43) -.714 (17) -.832 (11) -.803 (7) -.497 (44) .756 2 (12) .316 (50) .487 (40) .393 (41) -.289 (6) -.413 (42) -.551 (48) -.310 (49) -.308 (8) -.424 (17) -.426 3 (5) -.309 (13) .332 (7) .367 (40) -.286 (27) .365 (44) -.229 (48) -.202 (6) -.407 (19) .363 4 (3) .268 (14) .323 (41) .330 (50) .221 (10) -.349 (19) -.201 (10) -.397 (11) -.218
5 (50) -.264 (15) .310 (27) -.324 (8) .308 (43) -.278
6 (40) -.248 (33) .210 (50) -.225 (41) -.288 (11) -.257
7 (16) .207 (40) -.251 (42) -.225
Eigenvaluesa 6.86 x 10-31.27 x 10-35.16 x 10-42.93 x 10-41.55 x 10-45.64 x 10-57.39 x 10-65.64 x 10-69.17 x 10⁻⁷ Eigenvectorsb
1 (48) -.860 (19) -.812 (45) -.802 (49) .787 (1) -.905 (37) -.843 (2) .995 (38) .994 (47) -.707 2 (44) .398 (44) .383 (1) -.402 (37) .490 (45) .397 (49) .479 (46) -.707 3 (17) .240 (45) -.366 (19) .358 (11) -.282
4 (48) .212
a Each column represents a principal component, that is a group of coupled reactions. The eigenvalues indicate the effectiveness of each group in changing
the modeling results.
bFirst entry refers to the rate constant for the reaction listed in Table 1 and second entry lists eigenvector components. The eigenvectors give the relative
In the conditions of this simulation, the formation of acetaldehyde and peroxyacetyl nitrate (PAN) can be
attrib-uted to the photooxidation of ethyl nitrite26,42. In compari-son with OH radical reaction (CH3CHO + OH + (O2) → CH3CO3 + H2O), the acetaldehyde photochemical decom-positions (CH3CHO + (2 O2) + hν→ CH3O2 +HO2 +CO) are of non-negligible importance, as shown by the principal component analysis.
The 1st and 2nd principal components in Table 3 show that ethyl nitrite photodecomposition, reaction (36), oxida-tion of MTA, reacoxida-tion (20), and OH/NO chemistry, reac-tions (4) and (5), are strongly coupled and are the most influential reaction sequence in the mechanism. Thus, a small deviation in k20 or j36 should largely affect the simu-lation results. The same conclusions were obtained in the simulation of methyl-tert-butyl ether (MTBE)43 and methyl vinyl ketone (MVK)44 photooxidation by OH radicals.
According to the magnitude of the eigenvalues and significant entries (≥ 0.20) of the corresponding eigenvec-tor, the individual reactions may be classified in three groups:
1) Eigenvalues λ1 to λ31 are much larger than the
remaining ones. Note that
∑
i = 1 31λi ⁄
∑
j = 1 49λj = 0.9987.
Principal components ψ1 to ψ31 contain steps (3)-(10), (12)-(16), (18), (20)-(26), (28)-(36), (39)-(43), (46)-(47) and (50), forming the “basic” part of mechanism. Accord-ing to ψ1, the most influential reaction sequence is formed by (36), (20), (4) and (5). This first component emphasizes that the largest effect is brought about by setting the pa-rameters j36 and k20. Reactions (4) and (5) largely affect the NO/NO2 ratio and the simulated results. Due to the cou-pling of the individual reactions, this ratio not only depends on the rate of reactions (20) and (36) but also on all the reactions involving NOx. Since j36 is an estimated parame-ter, some deviations of the simulated results may be attrib-uted to it. An uncertainty analysis of this parameter shows
Figure 4. Simulated and experimental data for the peroxymethacryloyl
nitrate (PMN) concentrations as a function of reaction time.
Figure 2. Simulated and experimental data for the main products of the
gas-phase reactions of MTA with the OH radical in the presence of NOx as a function of reaction time.
Figure 1. Simulated and experimental data for the oxidation of the MTA
as a function of reaction time.
Figure 3. Simulated and experimental data for formaldehyde
that a change of 10% in j36 leads to a substantial change of all product concentrations (4.8% in hydroxyacetone, 4.4% in methylglioxal, 5.9% in peroxymethacryloyl nitrate and 7.3% in formaldehyde). The inclusion of another minor path of reaction, such the formation of alkylnitrates, might affect the NO/NOx ratios in a non-negligible amount.
2) According ψ32 to ψ39, reactions (11), (17), (19), (27), (44) and (48)-(49), are of “transitional” importance. As it will be shown, in spite of their small contributions they can not be removed from the mechanism.
3) Reactions (1), (2), (37)-(38) and (45) contained in ψ40 to ψ49 with eigenvalues below 2.66 x 10⁻² are unimpor-tant and can be eliminated.
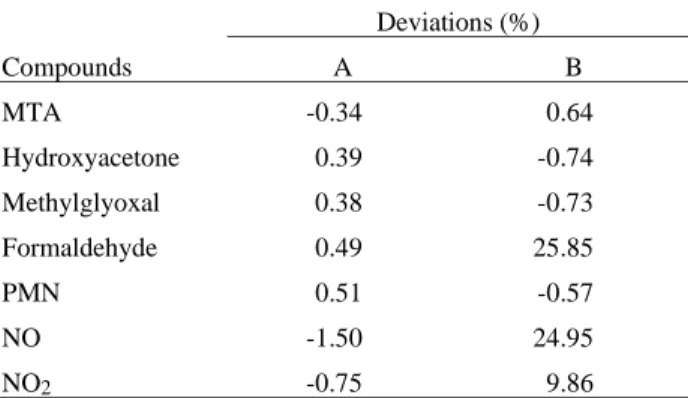
As shown in Table 4, eliminating the last group of reactions causes small changes in concentrations. However, additional elimination of steps (11), (17), (19), (27), (44) and (48)-(49) (i.e. reactions of “transitional” importance) leads to large deviations (Table 4). Since all concentration changes should be small, no further mechanism reduction is possible.
The rank of reactions by overall sensitivity (Table 2) suggests that reaction 49 may be eliminated. However, this elimination leads to large deviations (e. g. at t = 40.9 min the deviation for HCHO is 5.9%). The rate reaction rank (Table 2) gives a different rank of reactions and is not an effective way of reducing a mechanism. Individual rates do not consider the interactions between reactions and may lead to incorrect conclusions about the relevance of indi-vidual reactions. Anyway, the rate of production analysis is a good method for the exploration of the reaction path-ways and provides useful information as shown in the initial part of this discussion.
Conclusions
The proposed chemical mechanism gives satisfactory results for the oxidation of MTA by OH radicals in com-parison with experimental chamber data. Unfortunately the experimental data were obtained for a rather narrow range
of conditions. Since mechanism results are a function of initial conditions, the conclusions taken from the eigen-value-eigenvector analysis are only valid for this set of conditions. Anyway, the results shows that the reaction mechanism is strongly coupled and confirms that the most influential reactions are ethyl nitrite photolysis, the MTA oxidation, PAN and HOx/NOx chemistry. This is in agree-ment with independent evidences that tropospheric chem-istry is controlled by NOx concentrations and OH oxidation of volatile organic compounds.
On the basis of the calculated eigenvalues, the mechanism can be reduced to 45 reactions. Since reactions (21) -(35) form the basic part of the mechanism, the estimation of their rate constants may lead to a considerable uncer-tainty in the simulated results. Then, further experiments with this system, in order to study those reaction paths, would be important in the improvement of atmospheric photochemical mechanisms.
Acknowledgements
The authors gratefully acknowledge CAPES and FAPERJ for partial financial support, NCE/UFRJ for com-puting facilities on the SP2 supercomputer, and Prof. T. Turányi (Central Research Institute for Chemistry, Buda-pest, Hungary) for a free copy of the KINAL package.
Note
All calculations were performed using the KINAL package45.
References
1. Rasmussen, R.A. Environ. Sci. Technol. 1970, 4, 667. 2. Rasmussen, R.A. J. Air Pollut. Control Assoc. 1972,
22, 537.
3. Tingey, D.T.; Manning, M.; Grothaus, L.C.; Burns, W.F. Physiol. Plants 1979, 47, 112.
4. Zimmerman, P.R. Determination of emission rates of hydrocarbons from indigenous species of vegetation in the Tampa/St. Petersburg FL, area, EPA-904/9-77-028, 1979.
5. Isidorov, V.A.; Zenkevich, I.G.; Ioffe, B.V. Atmos. Environ. 1985, 19, 1.
6. Lamb, B.; Westberg, H.; Allwine, G.; Quarles, T. J. Geophys. Res. 1985, 90, 2380.
7. Arnts, R.R.; Gay Jr., B.W. Photochemistry of some naturally emitted hydrocarbons, EPA-600 3-79-081, September, 1979.
8. Cox, R.A.; Derwent, R.G.; Williams, M.R. Environ. Sci. Technol. 1980, 14, 57.
9. Gu, C.L.; Rynard, C.M.; Hendry, D.G.; Mill, T. Envi-ron. Sci. Technol. 1985, 19, 151.
10. Tuazon, E.C.; Atkinson, R. Int. J. Chem. Kinet. 1990, 22, 1221.
11.
Table 4. Comparison of concentration deviations from full mechanism,
eliminating of steps (1), (2), (37), (38) and (45) (column A) and also steps (11), (17), (44), (48) and (49) (column B).
Deviations (%)
Compounds A B
MTA -0.34 0.64
Hydroxyacetone 0.39 -0.74
Methylglyoxal 0.38 -0.73
Formaldehyde 0.49 25.85
PMN 0.51 -0.57
NO -1.50 24.95
Kamens, R.M.; Gery, M.W.; Jeffries, H.E.; Jackson, M.; Cole, E.I. Int. J. Chem. Kinet. 1982, 14, 955. 12. Niki, H.; Maker, P.D.; Savage, C.M.; Breitenbach,
L.P. Environ. Sci. Technol. 1983, 17, 312A.
13. Zimmerman, P.R.; Chatfield, R.B.; Fishman, J.; Crutzen, P.J.; Hanst, P.L. Geophys. Res. Lett. 1978, 5, 679.
14. Lamb, B.; Guenther, A.; Gay, D.; Westberg, H. Atmos. Environ. 1987, 21, 1695.
15. Zimmerman, P.R.; Greenberg, J.P.; Westberg, C.E. J. Geophys. Res. 1988, 93, 1047.
16. Lloyd, A.C.; Atkinson, R.; Lurmann, F.W.; Nitta, B. Atmos. Environ. 1983, 17, 1931.
17. Killus, J.P.; Whitten, G.Z. Environ. Sci. Technol. 1984, 18, 142.
18. Atkinson, R. Chem. Rev. 1986, 86, 69.
19. Vajda, S.; Valko, P.; Turányi, T. Int. J. Chem. Kinet. 1985, 17, 55.
20. Dickinson, R.P.; Gelinas, R.J. J. Comp. Phys. 1976, 21, 123.
21. Hwang, J.T.; Dougherty, E.P.; Rabitz, S.; Rabitz, H. J. Chem. Phys. 1978, 69, 5180.
22. Dougherty, E.P.; Hwang, J.T.; Rabitz, H. J. Chem. Phys. 1979, 71, 1794.
23. Edelson, D.; Allara, L. Int. J. Chem. Kinet. 1980,12, 605.
24. Turányi, T.; Bérces, T.; Vajda, S. Int. J. Chem. Kinet. 1989, 21, 83.
25. Turányi, T. J. Math. Chem. 1990, 5, 203.
26. Tuazon, E.C.; Atkinson, R. Int. J. Chem. Kinet. 1990, 22, 591.
27. Atkinson, R. Atmos. Environ. 1990, 24A, 1.
28. Pimentel, A.S.; Arbilla, G. Química Nova 1997, 20, 252.
29. Carter, W.P.L. Atmos. Environ. 1990, 24A, 481.
30. Grosjean, D.; Williams II, E.L.; Grosjean, E. Int. J. Chem. Kinet. 1993, 25, 921.
31. Atkinson, R. J. Phys. Chem. Ref. Data 1989, Mono-graph n. 1, 1.
32. Atkinson, R. J. Phys. Chem. Ref. Data 1994, Mono-graph n. 2, 1.
33. Atkinson, R.; Baulch, D.L.; Cox, R.A.; Hampson Jr., R.F.; Kerr, J.A.; Troe, J.; J. Phys. Chem. Ref. Data 1992, 21, 1125.
34. Atkinson, R.; Baulch, D.L.; Cox, R.A.; Hampson Jr., R.F.; Kerr, J.A.; Troe, J. J. Phys. Chem. Ref. Data 1989, 18, 881.
35. Atkinson, R. Int. J. Chem. Kinet. 1997, 29, 99. 36. Steinfeld, J.I.; Francisco, J.S.; Hase, W.L. Chemical
Kinetics and Dynamics, Prentice-Hall, Englewood Cliffs, NJ, 1989.
37. Pilling, M.J. In: Modern Gas Kinetics, Pilling, M.J.; Smith, I.W.M., eds., Blackwell, Oxford, 1987. 38. Hirst, D.M. A Computational Approach to Chemistry,
Blackwell Scientific Publications, Oxford, 1990. 39. Gelinas, R.J.; Science Applications, Inc., Preprint No
AI/PL/C279, 1979.
40. Kee, R.J.,Grear, J.F., Smooke, M.D.; Miller, J.A. Sandia National Labs., SAND 85-8240, 1985. 41. Gardiner Jr., W.C. J. Phys. Chem. 1977, 81, 2367. 42. Carter, W.P.L.; Tuazon, E.C.; Ashmann, S.M.
Inves-tigation of the Atmospheric Chemistry of Methyl tert-butyl ether (MTBE), prepared for the Auto/Oil Air Quality Improvement Research Program, January, 1991.
43. Pimentel, A.S.; Arbilla, G. J. Braz. Chem. Soc. 1998, 9, 539.
44. Pimentel, A.S.; Arbilla, G. J. Braz. Chem. Soc. 1998, 9, 551.
45. Turányi, T. Comp. Chem. 1990, 14, 253-254.