Kinetic Analysis of the Gas-Phase Reactions of Methyl
Tert
-Butyl
Ether with the OH Radical in the Presence of NO
xAndré Silva Pimentel*, and Graciela Arbilla
Departamento de Físico-Química, Instituto de Química, Universidade Federal do Rio
de Janeiro, Centro de Tecnologia -- Bloco A -- Sala 408, Cidade Universitária,
21949-900 Rio de Janeiro - RJ, Brazil; *e-mail [email protected]
Received: June 22, 1998
Um mecanismo explícito para a reação do metil-terc-butil-éter (MTBE) com radicais OH, numa
mistura NOx -- ar, foi simulado resolvendo as equações diferenciais ordinárias usando o método
Runge-Kutta-4-semi-implícito. Os resultados simulados são consistentes com os dados experimen-tais publicados e o modelo explica as principais vias de reação para a oxidação do MTBE com
radicais OH na presença de NOx -- ar. Usando uma análise dos autovetores e autovalores dos
coeficientes de sensibilidade, para todas as espécies químicas envolvidas em diferentes tempos de reação, foi extraída informação cinética do sistema. Este método foi utilizado para reduzir o modelo cinético de forma objetiva. Foi utilizado, também, o método tradicional de análise de velocidade de produção (ROPA) para estudar a importância relativa das reações individuais. Usando a informação da análise de componente principal e da análise de velocidade de produção, foram identificadas as principais reações individuais.
An explicit chemical mechanism for the reaction of methyl tert-butyl ether (MTBE) with OH
radicals in NOx-air systems, was simulated by solving the corresponding ordinary differential
equations using Runge-Kutta-4-semi-implicit method. The simulated results are consistent with the published experimental data and the model accounts for all the major pathways by which MTBE
reacts in NOx-air systems. An eigenvalue-eigenvector analysis is used to extract meaningful kinetic
information from linear sensitivity coefficients computed for all species of the chemical mechanism at several time points. This method is used to get an objective condition for constructing a minimal reaction set. Also, a classic method called rate of production analysis (ROPA) was used for the study of the reactions relevance. Using the principal component information as well as the rate of production analysis the main paths of reaction are identified and discussed.
Keywords: principal component analysis, eigenvalue-eigenvector analysis, rate of production analysis, methyl tert-butyl ether
Introduction
Numerical integration of the coupled differential equa-tions, which describe a reaction system, is becoming an important tool in chemical kinetics. The results and condi-tions obtained from such kinetic models are largely depend-ent on the selection of the elemdepend-entary steps and their rate coefficients. For complex models, it is frequently difficult to assess the relative importance of each step or to explain certain features of the system kinetic behavior.
In order to assess the relationship between the model results and kinetic parameters and to evaluate which parts of the model are of particular importance, some sensitivity analysis is usually required1-6.
In this work, the gas-phase reactions of methyl tert-bu-tyl ether (hereafter MTBE, CH3OC(CH3)3) with OH radi-cals in NOx-air systems are simulated and the relative importance of the elementary processes is carried out by an eigenvalue-eigenvector analysis of the linear sensitivity coefficients called Principal Component Analysis7. Article
J. Braz. Chem. Soc., Vol. 9, No. 6, 539-550, 1998. © 1998 Soc. Bras. Química
Like other oxygenated organic compounds, including alcohols and ethers, MTBE is oxidized in ambient air by OH radical-initiated reactions8-21. The secondary products formed from MTBE may produce ozone in a complex sequence of photochemical reactions, involving volatile organic compounds and nitrogen oxides.
Some experimental studies have been conducted for the MTBE reaction with OH radicals12-14, 19-20. The results of Tuazon et al.19 and Carter et al.20 are the most complete data set for MTBE reactions. These references report the same experiments. The authors measured and identified the products of MTBE oxidation, obtaining directly quantita-tive yields for the tert-butyl formate (TBF, (CH3)3 CO-CHO), formaldehyde (HCO-CHO), acetone (CH3C(O)CH3) and methyl acetate (CH3C(O)OCH3). They also discussed and recommend a mechanism to represent the MTBE + OH chemistry. Nevertheless, to our knowledge, a sensitivity analysis of the mechanism has not been done up to now.
In this paper the initial conditions for the simulations were those of the laboratory smog chamber experiments from Tuazon et al.19 in order to compare the calculated and experimental results.
The Chemical Mechanism
As previously discussed19-20, 22-24 MTBE reacts essen-tially with OH radicals by H-atom abstraction, with an overall rate constant of 2.80 x 10⁻¹² cm3 molecule-1 s-1 at 298 K.
The present chemical mechanism considers 30 species and 41 reactions. It was proposed on the basis of reliable, previous models25-30 and of the known MTBE and CH3Ox radicals chemistry. Thermal rate constants were either taken from literature22-24, 29-32 or estimated by comparison with similar compounds22-24, 32. The photochemical reac-tion rates were estimated on the basis of the ethyl nitrite photodecomposition experimental data 19-20. The chemical mechanism is listed in Table 1.
Methodology
Numerical simulation and principal component analy-sis of kinetic models is fully described in the literature 6-7,33-35. Briefly, the kinetic model can be represented by a set of
ordinary kinetic differential equations,
∂c(t)
∂t =f(k, c(t))
where c(t) is the n-vector of species concentrations with c(t = 0) = c0 and k is the m-vector of kinetic parameters. A change in the kinetic parameters from k0 to k at time t1 causes a change in the solution of the system at a time t2 (with t2 > t1). The effect of the parameter change on the solution can be expressed through the first order local sensitivity coefficients defined as
Sij (k0, c0, t1, t2)=∂ci (t2) ∂kj
In the first order approximation, the concentration sen-sitivity defined above represents the magnitude of the deviation in the concentration of species i at time t2 due to the differential variation of the parameter of reaction j at time t1 from value kj0 to kj. For the present model, the parameters kj are the thermal rate constants and photo-chemical coefficients.
Sensitivity coefficients are normalized in order to elimi-nate their dependence on the dimensions of the kinetic model. The sum of the squares of the normalized sensitivi-ties is called overall sensitivity. A convenient way to un-derstand the sensitivity results is in terms of the eigenvalues and eigenvectors of the matrix STS, where S is the array of normalized sensitivity coefficients. The methodology of principal component analysis is fully discussed in the lite-rature5-7.
The classic method for the study of the reactions rele-vance is the rate of production analysis called ROPA36-37. Although the combination of species reduction and rate sensitivity analysis6 seems to be a more effective way for this purpose, the rate of production analysis is still an important method for the exploration of important reaction pathways. The rate of production analysis requires the calculation of the Pij matrix elements38, which show the contribution of reaction j to the rate of production of species i.
Results and Discussions
The full mechanism and rate constants are presented in Table 1. The reduced mechanism was obtained after elimi-nation of the non-important reactions (denoted by # in Table 1) on the basis of the principal component analysis described below. The rank of reactions ordered by overall sensitivities and rates is shown in Table 2. We calculated normalized sensitivities for all species at time points 1, 2, 3, 4, 5 and 6 min. Eigenvalues of STS and the corresponding eigenvectors are listed in Table 3.
In the conditions of the modelling, the main source of hydroxyl radicals is the reaction (5) (HO2 + NO → OH + NO2) which follows the photolysis of the ethyl nitrite (CH3CH2ONO + hν→ CH3CH2O + NO) and the oxidation of the CH3CH2O radicals (CH3CH2O + O2→ CH3CHO + HO2). Reaction (5) accounts for ca. 95% of OH radical formed and the only significant sources of NO are the photodecomposition of ethyl nitrite (46%) and NO2 (54%), reactions (27) and (10), respectively. Since we had no data on photolysis light intensities during the experiments, the ethyl nitrite photodecomposition coefficient was estimated from experimental data (Fig. 1) and values, which gave consistent results for other photodecompositions, were used. The photolysis rates were also consistent with the
Vol. 9, No. 6, 1998 Kinetic Analysis of the Gas-Phase Reactions of Methyl Tert-Butyl Ether 541
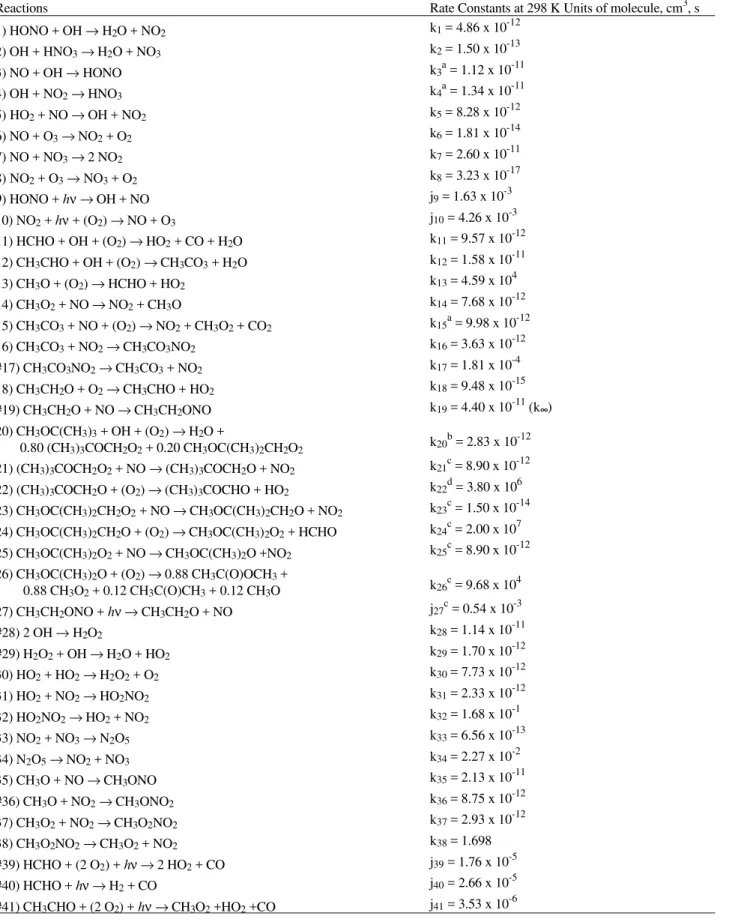
Table 1. Chemical mechanism for gas-phase reactions of MTBE with the OH radical in the presence of NOx.
Reactions Rate Constants at 298 K Units of molecule, cm3, s
1) HONO + OH → H2O + NO2 k1 = 4.86 x 10
-12
2) OH + HNO3→ H2O + NO3 k2 = 1.50 x 10
-13
3) NO + OH → HONO k3a = 1.12 x 10⁻¹¹
4) OH + NO2→ HNO3 k4
a = 1.34 x 10⁻¹¹
5) HO2 + NO → OH + NO2 k5 = 8.28 x 10
-12
6) NO + O3→ NO2 + O2 k6 = 1.81 x 10
-14
7) NO + NO3→ 2 NO2 k7 = 2.60 x 10
-11
8) NO2 + O3→ NO3 + O2 k8 = 3.23 x 10⁻¹⁷
9) HONO + hν → OH + NO j9 = 1.63 x 10⁻³
10) NO2 + hν + (O2) → NO + O3 j10 = 4.26 x 10
-3
11) HCHO + OH + (O2) → HO2 + CO + H2O k11 = 9.57 x 10⁻¹²
12) CH3CHO + OH + (O2) → CH3CO3 + H2O k12 = 1.58 x 10
-11
13) CH3O + (O2) → HCHO + HO2 k13 = 4.59 x 10
4
14) CH3O2 + NO → NO2 + CH3O k14 = 7.68 x 10
-12
15) CH3CO3 + NO + (O2) → NO2 + CH3O2 + CO2 k15
a = 9.98 x 10⁻¹²
16) CH3CO3 + NO2→ CH3CO3NO2 k16 = 3.63 x 10
-12
#17) CH3CO3NO2→ CH3CO3 + NO2 k17 = 1.81 x 10
-4
18) CH3CH2O + O2→ CH3CHO + HO2 k18 = 9.48 x 10
-15
#19) CH3CH2O + NO → CH3CH2ONO k19 = 4.40 x 10⁻¹¹ (k∞∞)
20) CH3OC(CH3)3 + OH + (O2) → H2O +
0.80 (CH3)3COCH2O2 + 0.20 CH3OC(CH3)2CH2O2 k20
b = 2.83 x 10⁻¹²
21) (CH3)3COCH2O2 + NO → (CH3)3COCH2O + NO2 k21
c = 8.90 x 10⁻¹²
22) (CH3)3COCH2O + (O2) → (CH3)3COCHO + HO2 k22
d
= 3.80 x 10⁶
23) CH3OC(CH3)2CH2O2 + NO → CH3OC(CH3)2CH2O + NO2 k23
c = 1.50 x 10⁻¹⁴
24) CH3OC(CH3)2CH2O + (O2) → CH3OC(CH3)2O2 + HCHO k24c = 2.00 x 10⁷
25) CH3OC(CH3)2O2 + NO → CH3OC(CH3)2O +NO2 k25
c
= 8.90 x 10⁻¹²
26) CH3OC(CH3)2O + (O2) → 0.88 CH3C(O)OCH3 +
0.88 CH3O2 + 0.12 CH3C(O)CH3 + 0.12 CH3O k26
c = 9.68 x 10⁴
27) CH3CH2ONO + hν → CH3CH2O + NO j27
c = 0.54 x 10⁻³
#28) 2 OH → H2O2 k28 = 1.14 x 10
-11
#29) H2O2 + OH → H2O + HO2 k29 = 1.70 x 10⁻¹²
30) HO2 + HO2→ H2O2 + O2 k30 = 7.73 x 10
-12
31) HO2 + NO2→ HO2NO2 k31 = 2.33 x 10
-12
32) HO2NO2→ HO2 + NO2 k32 = 1.68 x 10
-1
33) NO2 + NO3→ N2O5 k33 = 6.56 x 10
-13
34) N2O5→ NO2 + NO3 k34 = 2.27 x 10
-2
35) CH3O + NO → CH3ONO k35 = 2.13 x 10
-11
#36) CH3O + NO2→ CH3ONO2 k36 = 8.75 x 10
-12
37) CH3O2 + NO2→ CH3O2NO2 k37 = 2.93 x 10
-12
38) CH3O2NO2→ CH3O2 + NO2 k38 = 1.698
#39) HCHO + (2 O2) + hν → 2 HO2 + CO j39 = 1.76 x 10⁻⁵
#40) HCHO + hν → H2 + CO j40 = 2.66 x 10
-5
#41) CH3CHO + (2 O2) + hν → CH3O2 +HO2 +CO j41 = 3.53 x 10⁻⁶
542 Pimentel & Arbilla J. Braz. Chem. Soc.
Table 2. Rank of reactions by overall sensitivity and rates.
Rank Reaction Overall Sens.* Reaction Rates**
1 27 3.61 x 10+02 10 5.07 x 10+11
2 20 1.04 x 10+02 6 5.03 x 10+11
3 3 5.27 x 10+01 5 2.18 x 10+11
4 4 4.36 x 10+01 27 1.26 x 10+11
5 5 2.78 x 10+01 18 1.25 x 10+11
6 12 1.67 x 10+01 31 1.15 x 10+11
7 10 1.35 x 10+01 32 1.12 x 10+11
8 6 1.34 x 10+01 4 1.07 x 10+11
9 14 1.20 x 10+01 20 6.27 x 10+10
10 7 1.18 x 10+01 21 5.01 x 10+10
11 15 8.69 22 5.01 x 10+10
12 8 7.70 3 4.79 x 10+10
13 18 6.01 12 4.20 x 10+10
14 26 6.00 14 3.64 x 10+10
15 24 6.00 13 3.60 x 10+10
16 22 6.00 9 2.85 x 10+10
17 25 6.00 37 2.59 x 10+10
18 21 6.00 38 2.58 x 10+10
19 23 6.00 15 2.53 x 10+10
20 37 5.98 16 1.72 x 10+10
21 38 5.91 26 1.25 x 10+10
22 33 5.90 24 1.25 x 10+10
23 16 5.77 25 1.25 x 10+10
24 31 5.70 23 1.25 x 10+10
25 13 5.31 11 9.61 x 10+09
26 32 5.19 1 5.66 x 10+09
27 30 4.24 7 1.89 x 10+09
28 9 1.73 8 1.68 x 10+09
29 34 1.55 19 1.54 x 10+09
30 2 4.89 x 10-01 35 1.07 x 10+09
31 1 4.63 x 10-01 36 8.17 x 10+08
32 19 2.17 x 10-01 17 4.12 x 10+08
33 28 1.66 x 10-01 40 3.98 x 10+08
34 11 7.37 x 10-02 39 2.64 x 10+08
35 35 6.52 x 10-02 2 2.46 x 10+08
36 36 5.23 x 10-03 41 1.40 x 10+08
37 39 1.10 x 10-03 33 8.90 x 10+07
38 17 1.03 x 10-03 34 5.71 x 10+07
39 29 8.38 x 10-04 30 1.32 x 10+06
40 41 7.00 x 10-04 28 5.12 x 10+04
41 40 4.56 x 10-05 29 2.66 x 10+04
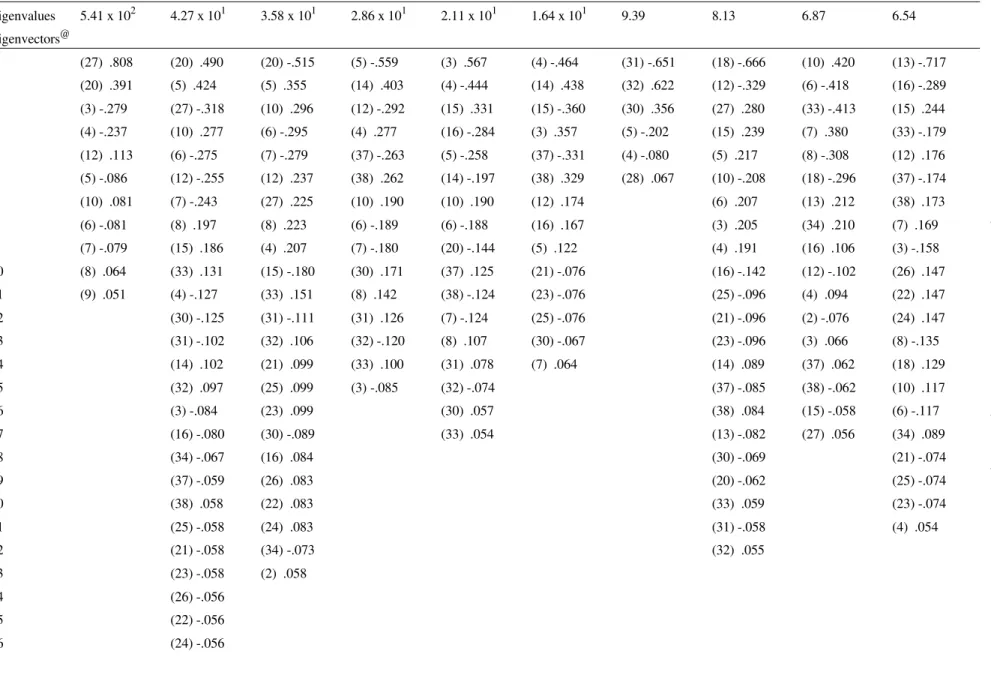
Table 3. Eigenvalues and eigenvectors for the MTBE photooxidation mechanism.
Eigenvalues 5.41 x 10² 4.27 x 101 3.58 x 101 2.86 x 101 2.11 x 101 1.64 x 101 9.39 8.13 6.87 6.54
Eigenvectors@
1 (27) .808 (20) .490 (20) -.515 (5) -.559 (3) .567 (4) -.464 (31) -.651 (18) -.666 (10) .420 (13) -.717
2 (20) .391 (5) .424 (5) .355 (14) .403 (4) -.444 (14) .438 (32) .622 (12) -.329 (6) -.418 (16) -.289
3 (3) -.279 (27) -.318 (10) .296 (12) -.292 (15) .331 (15) -.360 (30) .356 (27) .280 (33) -.413 (15) .244
4 (4) -.237 (10) .277 (6) -.295 (4) .277 (16) -.284 (3) .357 (5) -.202 (15) .239 (7) .380 (33) -.179
5 (12) .113 (6) -.275 (7) -.279 (37) -.263 (5) -.258 (37) -.331 (4) -.080 (5) .217 (8) -.308 (12) .176
6 (5) -.086 (12) -.255 (12) .237 (38) .262 (14) -.197 (38) .329 (28) .067 (10) -.208 (18) -.296 (37) -.174
7 (10) .081 (7) -.243 (27) .225 (10) .190 (10) .190 (12) .174 (6) .207 (13) .212 (38) .173
8 (6) -.081 (8) .197 (8) .223 (6) -.189 (6) -.188 (16) .167 (3) .205 (34) .210 (7) .169
9 (7) -.079 (15) .186 (4) .207 (7) -.180 (20) -.144 (5) .122 (4) .191 (16) .106 (3) -.158
10 (8) .064 (33) .131 (15) -.180 (30) .171 (37) .125 (21) -.076 (16) -.142 (12) -.102 (26) .147
11 (9) .051 (4) -.127 (33) .151 (8) .142 (38) -.124 (23) -.076 (25) -.096 (4) .094 (22) .147
12 (30) -.125 (31) -.111 (31) .126 (7) -.124 (25) -.076 (21) -.096 (2) -.076 (24) .147
13 (31) -.102 (32) .106 (32) -.120 (8) .107 (30) -.067 (23) -.096 (3) .066 (8) -.135
14 (14) .102 (21) .099 (33) .100 (31) .078 (7) .064 (14) .089 (37) .062 (18) .129
15 (32) .097 (25) .099 (3) -.085 (32) -.074 (37) -.085 (38) -.062 (10) .117
16 (3) -.084 (23) .099 (30) .057 (38) .084 (15) -.058 (6) -.117
17 (16) -.080 (30) -.089 (33) .054 (13) -.082 (27) .056 (34) .089
18 (34) -.067 (16) .084 (30) -.069 (21) -.074
19 (37) -.059 (26) .083 (20) -.062 (25) -.074
20 (38) .058 (22) .083 (33) .059 (23) -.074
21 (25) -.058 (24) .083 (31) -.058 (4) .054
22 (21) -.058 (34) -.073 (32) .055
23 (23) -.058 (2) .058
24 (26) -.056
25 (22) -.056
26 (24) -.056
V
o
l.
9
, N
o
. 6
, 1
9
9
8
K
in
et
ic
A
n
al
y
sis
o
f t
h
e
G
as
-P
h
as
e
R
ea
ct
io
n
s o
f M
et
h
y
l T
er
t
-B
u
ty
l E
th
er
5
4
Eigenvalues 6.00 6.00 6.00 6.00 5.98 3.85 3.26 2.91 2.71 1.95
Eigenvectors@
1 (26) .814 (24) -.681 (25) -.728 (23) -.806 (22) -.429 (14) .492 (18) .623 (33) -.686 (16) .799 (23) .405
2 (24) -.420 (22) .676 (21) .621 (21) .475 (24) -.429 (37) .487 (12) -.372 (7) -.435 (14) -.319 (21) .405
3 (22) -.391 (21) -.226 (22) .218 (25) .332 (26) -.426 (38) -.484 (27) .311 (8) .357 (15) .318 (25) .405
4 (21) .069 (25) .152 (24) -.140 (22) .093 (23) .326 (13) -.391 (3) .272 (34) .352 (13) -.221 (14) .272
5 (25) -.066 (23) .074 (23) .106 (24) -.079 (21) .324 (16) .281 (14) .219 (18) -.123 (3) .132 (22) .270
6 (26) -.078 (25) .324 (18) -.110 (33) -.203 (3) -.107 (37) -.132 (24) .270
7 (13) -.313 (15) -.081 (4) .201 (10) -.104 (38) .131 (26) .270
8 (18) -.151 (33) .072 (5) .197 (6) .104 (12) -.130 (15) .213
9 (16) -.061 (5) -.067 (20) -.129 (2) .083 (33) -.098 (4) -.173
10 (20) .058 (22) -.123 (4) -.081 (18) .088 (13) .157
11 (24) -.123 (16) -.075 (7) -.075 (7) .145
12 (26) -.123 (27) -.071 (8) .059 (5) .129
13 (16) -.122 (12) .060 (27) .055 (6) .096
14 (34) .102 (34) .053 (10) -.096
15 (15) .093 (31) -.087
16 (30) -.080 (30) -.087
17 (37) .070 (8) -.086
18 (38) -.070 (12) -.084
19 (1) -.062 (32) .080
20 (10) -.055 (3) -.076
21 (6) .054 (20) .073
22 (33) -.069
23 (2) -.057
5
4
4
P
im
en
te
l &
A
rb
ill
a
J
. B
ra
z.
C
h
e
m
. S
o
c
Eigenvalues 1.56 8.93 x 10⁻¹ 5.54 x 10⁻¹ 2.44 x 10⁻¹ 6.58 x 10⁻² 3.99 x 10⁻² 2.75 x 10⁻² 1.69 x 10⁻² 1.21 x 10⁻² 3.25 x 10⁻³
Eigenvectors@
1 (20) -.510 (30) .846 (15) .566 (9) -.623 (34) .656 (11) -.786 (1) .938 (2) .657 (28) -.863 (35) -.928
2 (3) -.473 (5) .352 (12) .521 (15) .233 (11) -.484 (34) -.475 (34) .243 (8) -.465 (2) -.300 (11) .267
3 (4) -.463 (31) .179 (14) .309 (3) -.192 (33) .337 (33) -.238 (33) .103 (28) -.402 (8) .219 (36) .125
4 (12) -.357 (32) -.172 (13) .293 (12) .157 (2) .281 (35) -.211 (28) .092 (34) -.268 (35) -.176 (28) .124
5 (9) .162 (28) .159 (9) .235 (4) -.139 (1) -.256 (28) .156 (11) -.085 (7) -.238 (11) -.165 (32) -.088
6 (30) .158 (20) .123 (4) .150 (14) .120 (8) -.207 (15) -.068 (9) .083 (33) -.148 (30) .153 (31) -.085
7 (15) .127 (3) .110 (30) .122 (11) -.098 (35) -.129 (1) .066 (35) .072 (11) .129 (7) .112 (19) -.081
8 (5) .116 (9) -.093 (16) .112 (13) .096 (7) -.110 (12) -.059 (19) -.052 (1) .105 (1) .086 (17) -.080
9 (31) .089 (15) -.082 (22) -.096 (1) .095 (19) -.052 (30) .081 (29) -.071 (1) .061
10 (32) -.085 (4) .061 (24) -.095 (20) -.090 (30) -.050 (34) .056
11 (23) -.080 (23) .054 (26) -.095 (22) -.083
12 (25) -.080 (25) .054 (23) -.084 (24) -.083
13 (21) -.080 (21) .054 (21) -.084 (26) -.083
14 (24) -.062 (25) -.084 (23) -.059
15 (22) -.062 (34) -.056 (21) -.059
16 (26) -.062 (5) .052 (25) -.059
17 (7) .061
18 (16) .058
19 (8) -.056
20 (13) .051
V
o
l.
9
, N
o
. 6
, 1
9
9
8
K
in
et
ic
A
n
al
y
sis
o
f t
h
e
G
as
-P
h
as
e
R
ea
ct
io
n
s o
f M
et
h
y
l T
er
t
-B
u
ty
l E
th
er
5
4
Eigenvalues 9.75 x10⁻⁴ 4.45 x10⁻⁴ 1.44 x10⁻⁴ 1.19 x10⁻⁴ 2.00 x10⁻⁵ 1.52 x10⁻⁵ 5.72 x10⁻⁶ 3.23 x10⁻⁶ 2.08 x10⁻⁶ 1.77 x10⁻⁶
Eigenvectors@
1 (32) .671 (19) -.911 (17) -.976 (36) .930 (38) -.673 (39) .783 (6) .551 (29) .979 (40) .706 (41) .858
2 (31) .639 (32) -.236 (19) .113 (19) .195 (37) -.669 (41) .420 (10) .548 (41) -.160 (2) -.324 (39) -.412
3 (19) -.310 (31) -.226 (39) -.106 (38) -.140 (36) -.223 (2) -.200 (2) -.336 (40) -.080 (6) -.310 (29) .142
4 (36) .179 (35) .135 (41) -.101 (37) -.139 (39) -.180 (7) -.185 (7) -.324 (28) -.075 (10) -.308 (6) .141
5 (11) .066 (36) .116 (35) .071 (39) -.127 (40) .065 (8) -.180 (8) -.317 (7) -.299 (10) .140
6 (39) -.107 (35) .097 (17) -.168 (39) -.187 (8) -.290 (40) .082
7 (17) -.082 (32) -.083 (36) .141 (41) -.182 (39) -.135 (38) .079
8 (1) -.068 (31) -.079 (38) -.135 (29) -.070 (29) .087 (37) .078
9 (28) -.053 (41) -.077 (37) -.134 (2) .068
10 (11) -.064 (19) -.083 (7) .063
11 (40) -.067 (8) .061
12 (29) .052
@First entry refers to the rate constant for the reaction listed in Table 1 and second entry lists eigenvector components.
5
4
6
P
im
en
te
l &
A
rb
ill
a
J
. B
ra
z.
C
h
e
m
. S
o
c
value reported in the literature20 for NO2 photodecomposi-tion. Also, photochemical reactions of other species, not including NO2 photodecomposition, are of negligible im-portance compared with other paths. As expected the set of reactions of Table 1 accounts for the formation of the main products, tert-butyl formate, formaldehyde, methyl acetate, and acetone. As shown in Figs. 2 and 3, the simulated results are in reasonable agreement with experimental data, both for MTBE and the main products concentrations.
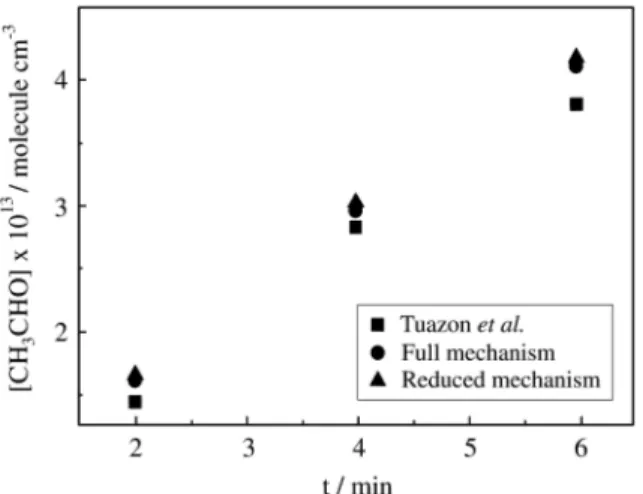
In this simulation conditions, formaldehyde is formed both from acetaldehyde, the initial product of ethyl nitrite photolysis, reaction (27), and by the sequence of reactions initiated by OH radical oxidation of MTBE:
CH3OC(CH3)3 + OH + (O2) → H2O + 0.80 (CH3)3 COCH2O2 + 0.20 CH3OC(CH3)2CH2O2
The rate of production analysis shows that 60% of formaldehyde is formed through reaction (13), CH3O + (O2) → HCHO + HO2 and 40% through the reaction
sequence (20), (23) and (24), which involve the reaction of CH3OC(CH3)2CH2O2 with NO and O2. Under the model-ing conditions, the secondary reactions of formaldehyde are of minor importance. As observed experimentally 19,23-24, the formed formaldehyde reacts essentially with OH
radicals which are in relatively high concentrations (calcu-lated values about 9 x 10⁷ molecule cm-3). Nevertheless, the rate of this reaction path is 3.6% of the total formation rate and, in comparison with OH radical reaction (11) (HCHO + OH + (O2) → HO2 + CO + H2O), the photo-chemical decompositions (39) and (40) (HCHO + (2 O2) +
hν → 2 HO2 + CO and HCHO + hν → H2 + CO) are of negligible importance.
According to the calculated results, 22% of formalde-hyde is generated by the following sequence: ethyl nitrite photolysis, CH3CH2O oxidation to acetaldehyde and its decomposition and, finally, oxidation of CH3O, reactions (27), (18), (12), (15), (14) and (13). As previously stated, MTBE reaction with OH radical leads to formaldehyde (40% of total) through the sequence of reactions (20), (23) and (24) which does not involve CH3Ox radicals. The other 60% of formaldehyde can be attributed to the subsequent reactions of ethyl nitrite photolysis products and to the sequence (20), (23), (24), (25), (26), (14) and (13) which leads to methyl acetate and formaldehyde, and by another sequence (20), (23), (24), (25), (26) and (13) which leads to acetone and formaldehyde. All these paths involve CH3Ox radical. Since rate coefficients of many of these reactions are estimated values, these paths are subject to considerable uncertainty.
In the conditions of this simulation, the formation of acetaldehyde (Fig. 4) and peroxyacetyl nitrate (PAN) (Fig. 5) can be attributed to the photooxidation of ethyl nitrite 19-20. The main discrepancy between the experimental results
and the model predictions is the much lower concentrations of calculated peroxyacetyl nitrate. The reasons for this discrepancy are not well established, but may be associated
Vol. 9, No. 6, 1998 Kinetic Analysis of the Gas-Phase Reactions of Methyl Tert-Butyl Ether 547
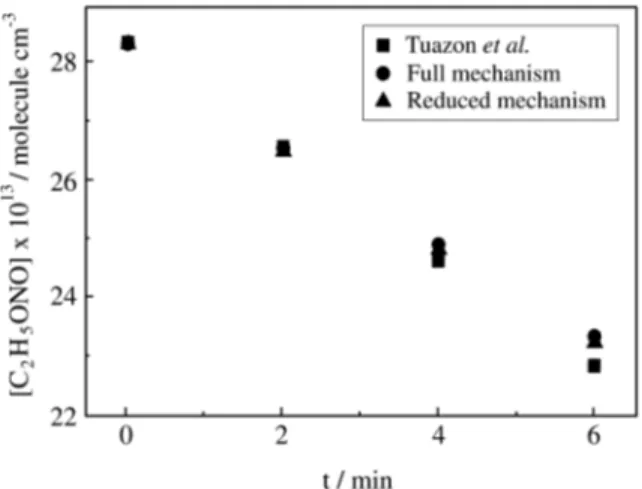
Figure 1. Simulated and experimental data for the ethyl nitrite photode-composition as a function of reaction time.
Figure 2. Simulated and experimental data for the main products of the gas-phase reactions of MTBE with the OH radical in the presence of NOx
as a function of reaction time.
to the large uncertainty in the related kinetic parameters. Also, other reactions which have not been considered in the present work, such as heterogeneous reactions, may be important to describe the whole system. In comparison with OH radical reaction (CH3CHO + OH + (O2) → CH3CO3 + H2O), the acetaldehyde photochemical decompositions (CH3CHO + (2 O2) + hν → CH3O2 +HO2 +CO) are of negligible importance, as shown by the principal compo-nent analysis.
The 1st and 2nd principal components in Table 3 show that ethyl nitrite photodecomposition, reaction (27), oxida-tion of MTBE, reacoxida-tion (20), and OH/NO chemistry, reac-tions (3), (4) and (5), are strongly coupled and are the most influential reaction sequence in the mechanism. Thus a small deviation in k20 or j27 should largely affect the simu-lation results.
According to the magnitude of the eigenvalues and significant entries (≥ 0.20) of the corresponding
eigenvec-tor, the individual reactions may be classified in three groups:
1) Eigenvalues λ1 to λ21 are much larger than the
remaining ones. Note that
∑
i = 1 2lλi ⁄
∑
j = 1 4lλj = 0.9976.
Prin-cipal components ψ1 to ψ21 contain steps (3)-(10), (12)-(16), (18), (20)-(27), (30)-(34), (37) and (38), forming the ‘‘basic’’ part of the mechanism. According to ψ1, the most influential reaction sequence is formed by (27), (20), (3) and (4). This ‘‘reaction kernel’’ emphasizes that the largest effect is brought about by setting the parameters j27 and k20. Also the NO/NO2 ratio (Figs. 6 and 7) largely affects the simulated results. Due to the coupling of the individual reactions, this ratio not only depends on the rate of reactions (20) and (27) but also on all the reactions involving NOx. Since j27 is an estimated parameter, some deviations of the simulated results may be attributed to it. An uncertainty analysis of this parameter shows that a change of 10% in
Figure 4. Simulated and experimental data for the acetaldehyde concen-trations as a function of reaction time.
Figure 5. Simulated and experimental data for the peroxyacetyl nitrate (PAN) concentrations as a function of reaction time.
Figure 6. Simulated and experimental data for the NO concentrations as a function of reaction time.
Figure 7. Simulated and experimental data for the NO2 concentrations as a function of reaction time.
j27 leads to a substantial change of all product concentra-tions (6.8% in TBF and about 7.5% in the minor products). The inclusion of another minor reaction path, such as the formation of alkylnitrates, might affect the NO/NOx ratios in a non-negligible amount.
2) According ψ22 to ψ27, reactions (1), (2), (11) and (35), are of ‘‘transitional’’ importance. As it will be shown, in spite of their small contributions they can not be removed from the mechanism.
3) Reactions (17), (19), (28), (29), (36), (39), (40) and (41) contained in ψ28 to ψ41 with eigenvalues below 1.80 x 10⁻² are unimportant and can be eliminated.
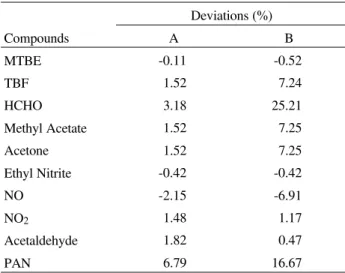
As shown in Table 4, eliminating the last group of reactions causes small changes in concentrations. How-ever, additional elimination of steps (1), (2), (11) and (35) (i.e. reactions of ‘‘transitional’’ importance) leads to large deviations (Table 4). That is, no further reduction of the mechanism is possible since all concentration changes should be small. Table 4 also shows that the importance or contribution of individual reactions changes as the overall reaction proceeds.
The rank of reactions by overall sensitivity (Table 2) suggests that reactions (11) and (35) may be eliminated. However, this elimination leads to large deviations (e.g. at t = 6 min the deviation for HCHO is about 20%). On the other hand, reactions (19) and (28) with larger overall sensitivities can be dropped. The probable reason for this is that reactions (11) and (35) are coupled with other important reactions (see ψ24-ψ27).
The rate reaction rank (Table 2) gives a different rank of reactions and is not an effective way of reducing a mechanism. Individual rates do not consider the interac-tions between reacinterac-tions and may lead to incorrect conclu-sions about the relevance of individual reactions. Anyway,
as previously shown the rate of production analysis is a good method for the exploration of the reaction pathways.
Conclusions
The mechanism of Table 1 is quite successful in repro-ducing chamber data for the oxidation of MTBE by OH radicals. The rate of production analysis gives useful infor-mation in determining the main reaction pathways.
Principal component analysis shows that reactions are strongly coupled and confirms that the most influential reactions paths are the ethyl nitrite photolysis, the MTBE oxidation and the chemistry of NOx and OH radical. On the basis of the calculated eigenvalues, the mechanism can be reduced to 33 reactions. No further reduction is possible since all concentration changes should be small. Certainly, the conclusions taken from the eigenvalue-eigenvector analysis are only valid for the rather narrow range of conditions of the smog chamber experiments. Anyway, the information seems useful to identify a minimal reaction set and to assess the relationships and dependencies among the parameters.
Acknowledgements
The authors gratefully acknowledge CAPES and FAPERJ for partial financial support, NCE/UFRJ for com-puting facilities on the SP2 supercomputer, and Prof. T. Turányi (Central Research Institute for Chemistry, Buda-pest, Hungary) for a free copy of KINAL package.
Note
All calculations were performed using the KINAL package39.
References
1. Dickinson, R.P.; Gelinas, R.J. J. Comp. Phys.1976, 21, 123.
2. Hwang, J.T.; Dougherty, E.P.; Rabitz, S.; Rabitz, H. J. Chem. Phys.1978, 69, 5180.
3. Dougherty, E.P.; Hwang, J.T.; Rabitz, H. J. Chem. Phys.1979, 71, 1794.
4. Edelson, D.; Allara, L. Int. J. Chem. Kinet.1980,12, 605.
5. Turányi, T.; Bérces, T.; Vajda, S. Int. J. Chem. Kinet.
1989, 21, 83.
6. Turányi, T. J. Math. Chem.1990, 5, 203.
7. Vajda, S.; Valko, P.; Turányi, T. Int. J. Chem. Kinet.
1985, 17, 55.
8. Wallington, T.J.; Kurylo, M.J. Int. J. Chem. Kinet.
1987, 19, 1015.
9. Tanner, R.L.; Miguel, A.H.; de Andrade, J.B.; Gaffney, J.S.; Streit, G.E. Environ. Sci. Technol.1988, 22, 1026.
Vol. 9, No. 6, 1998 Kinetic Analysis of the Gas-Phase Reactions of Methyl Tert-Butyl Ether 549
Table 4. Comparison of concentration deviations from full mechanism, eliminating of steps 17, 19, 28, 29, 36, 39, 40 and 41 (column A) and also steps 1, 2, 11 and 35 (column B).
Deviations (%)
Compounds A B
MTBE -0.11 -0.52
TBF 1.52 7.24
HCHO 3.18 25.21
Methyl Acetate 1.52 7.25
Acetone 1.52 7.25
Ethyl Nitrite -0.42 -0.42
NO -2.15 -6.91
NO2 1.48 1.17
Acetaldehyde 1.82 0.47
10. Wallington, T.J.; Andino, J.M.; Skewes, L.M.; Siegl, W.O.; Japar, S.M. Int. Chem. Kinet.1989, 21, 993. 11. Anderson, E. V. Chem. Eng. News1987, 65, 7. 12. Wallington, T.J.; Dagaut, P.; Liu, R.; Kurylo, M.J.
Environ. Sci. Technol.1988, 22, 842.
13. Cox, R.A.; Goldstone, A. In Proceedings of the 2nd European Symposium on the Physical-Chemistry Be-havior of Atmospheric Pollutants, D. Riedel Publish-ing Co., Dordrecht, Holland, 1989, pp. 112-119. 14. Japar, S.M.; Wallington, T.J.; Richert, J.F.O.; Ball
J.C. Int. J. Chem. Kinet.1990, 22,1257.
15. Grosjean, D.; Miguel, A.H.; Tavares, T.M. Atmos. Environ.1990, 24B, 101.
16. Calvert, J.G. In Some Considerations of the Mecha-nism of the Atmospheric Oxidation of MTBE and ETBE, prepared for the Auto Oil Air Quality Improve-ment Research Program, Modeling Committee, March 8, 1990.
17. Chang, T.J.; Rudy, S.J. Atmos. Environ.1990, 24A, 2421.
18. Smith, D.F.; Kleindienst, T.E.; Hudgens, E.E.; McIver, C.D.; Bufalini, J. J. Int. J. Chem. Kinet.1991, 23, 907.
19. Tuazon, E.C.; Carter, W.P.L.; Aschmann, S.M.; At-kinson, R. Int. J. Chem. Kinet.1991, 23, 1003. 20. Carter, W.P.L.; Tuazon, E.C.; Aschmann, S.M. In
Investigation of the Atmospheric Chemistry of Methyl tert-butyl ether (MTBE), prepared for the Auto/Oil Air Quality Improvement Research Program, January, 1991.
21. Langer, S.; Ljungström, E. Int. J. Chem. Kinet.1994, 26, 367.
22. Atkinson, R. J. Phys. Chem. Ref. Data1989, Mono-graph n° 1, 1.
23. Atkinson, R. J. Phys. Chem. Ref. Data1994, Mono-graph n° 2, 1.
24. Atkinson, R. Atmos. Environ.1990, 24A, 1.
25. Pimentel, A.S.; Arbilla, G. Química Nova1997, 20, 252.
26. Harley, R.A.; Russell, A.G.; McRae, G.J.; Cass, G.R.; Seinfeld, J.H. Environ. Sci. Technol.1993, 27, 378. 27. Leone, J.A.; Seinfeld, J.H. Atmos. Environ.1988, 19,
437.
28.Rethinking the Ozone Problem in Urban and Regional Air Pollution, Committee on Tropospheric Ozone Formation and Measurement, National Academic Press, Washington, DC, 1991.
29. Carter, W.P.L. Atmos. Environ.1990, 24A, 481. 30. Atkinson, R.; Baulch, D.L.; Cox, R.A.; Hampson Jr.,
R.F.; Kerr, J.A.; Troe, J. J. Phys. Chem. Ref. Data
1992, 21, 1125.
31. Atkinson, R.; Baulch, D.L.; Cox, R.A.; Hampson Jr., R.F.; Kerr, J.A.; Troe, J. J. Phys. Chem. Ref. Data
1989, 18, 881.
32. Atkinson, R. Int. J. Chem. Kinet.1997, 29, 99. 33. Steinfeld, J.I.; Francisco, J.S.; Hase, W.L. In
Chemi-cal Kinetics and Dynamics, Prentice-Hall, Engle wood Cliffs, NJ, 1989.
34. Pilling, M.J. Modern Gas Kinetics, Pilling, M.J.; Smith, I.W.M., eds., Blackwell, Oxford, 1987. 35. Hirst, D.M. In A Computational Approach to
Chem-istry, Blackwell Scientific Publications, Oxford, 1990.
36. Gelinas, R.J. Science Applications, Inc., Preprint No AI/PL/C279, 1979.
37. Kee, R.J.; Grear, J.F.; Smooke, M.D.; Miller, J.A. Sandia National Labs., SAND 85-8240, 1985. 38. Gardiner, Jr., W.C. J. Phys. Chem.1977, 81, 2367. 39. Turányi, T. Comp. Chem.1990, 14, 253-254.