Design and Characterization of an RF Plasma Cleaner
G.P. Canal‡, H. Luna#, L.F. Ruchko& and R.M.O. Galv˜ao‡.
‡Centro Brasileiro de Pesquisas F´ısicas. Laborat´orio de Plasmas Aplicados. Rua Xavier Sigaud 150, 22.290-180. Rio de Janeiro, Brazil #Instituto de F´ısica, Universidade Federal do Rio de Janeiro,
Cx. Postal 68.528, Rio de Janeiro, RJ 21.941-972, Brazil and
&Instituto de F´ısica, Universidade de S˜ao Paulo,S˜ao Paulo, SP 05.508-090, Brazil (Received on 30 December, 2009)
The design and characterization of an innovative device for plasma cleaning, based upon a non-conventional radio-frequency discharge, is described. The RF fields are produced by an antenna placed inside the metallic vacuum chamber. Theoretical models are described to calculate both the electro-magnetic field structure and the spatial impurity distribution, due to erosion of the antenna. The electron energy distribution function is determined with a standard RF-filtered electrostatic probe; it is found that the plasma is well described by a Druyvesteyn energy distribution function.
Keywords: RF discharge, plasma cleaner, Langmuir probe
1. INTRODUCTION
Low-temperature plasmas are widely employed in techno-logical micro-electronics and nanotechnology processes [1], either in the fabrication scheme or as an auxiliary tool, for pre or post surface treatment [2–4]. In particular, proper prepa-ration of the samples is absolutely essential in electron mi-croscopy, to avoid artifacts or contaminants, usually hydro-carbons originated in their manipulation.
Among the several methods for preparation of samples for SEM (scanning electron microscopy) and TEM (tunnel-ing electron microscopy), one commonly used is the Plasma Cleaner. This is usually a small vacuum chamber in which the plasma is produced by an inductive-coupled RF discharge, with the antenna placed outside the vacuum chamber [5]. This scheme avoids the plasma contamination observed in capaci-tively coupled discharges, widely used in the electronic indus-try, due to erosion of the electrodes inside the vacuum cham-ber [6].
Although the plasma cleaners are commercially available, they are usually assembled as a integrated and compact de-vice, optimized for the cleaning process. This makes it diffi-cult the access for plasma diagnostics. Only external parame-ters, such as RF power, pressure, and type of working gas, are available to the experimentalist to control the process. When there is interest in using the plasma not only as an auxiliary tool, but also as the object of study, to properly investigate the relevant physical mechanisms involved in the plasma-surface interaction, a more flexible assembly is required.
Another feature of the commercially available plasma cleaners is that the antenna is placed outside the vacuum chamber. This imposes the use of a dielectric window, either a quartz cylindrical tube or a plate, so that the vacuum chamber is not entirely metallic. For the vacuum conditions of conven-tional plasma cleaners, the presence of the dielectric window does not spoil the quality of the cleaning process. However, when one is interested in investigating the performance of low pressure discharges, for special applications, or non-standard plasma mechanisms, such as collisionless RF power absorp-tion, a metallic wall is required to guarantee proper vacuum conditions and unambiguous results.
In this work we present the design and characterization of an inductively coupled plasma cleaner with the antenna placed inside the vacuum chamber. The antenna is made of
circular loops concentric with the cylindrical metallic cham-ber. In this configuration, the vacuum electro-magnetic field configuration can be analytically calculated, facilitating the modeling of the discharge. This is discussed in the next sec-tion, together with the model to calculate the spatial distri-bution of the impurities generated by sputtering of the an-tenna. As found in the literature[5], we show that the level of impurities is negligible at the position where the substrate is placed. The experimental set up is presented in Section 3 and the characterization of the discharge in Section 4. One im-portant result obtained in this work is that the electron energy distribution function is not Maxwellian, but better represented by a Druyvesteyn function, within the working pressure range of 3.0×10⁻²to 1.5×10⁻¹mbar.
2. THEORETICAL MODEL
2.1. Electromagnetic Fields
In order to study the electro-magnetic field inside the chamber, we developed a theoretical model in which the re-actor is regarded as a perfectly conducting cylinder of radius band heightH. The antenna used for generation of the RF field is modeled by a current loop of radiusapositioned at a heighthinside the reactor (Fig. 1).
The distribution of the electro-magnetic field inside the vacuum chamber is obtained by solving the wave equation for the vector potential [8, 9],
∇2→ A−1
c2 ∂2→A
∂t2 = −µ0 →
J , (1)
with the current density→J modeled by a loop current given by
→
J (r,z,t) =I0eiωt δ(r−a)δ(z−h)eϕ. (2) whereωis the angular frequency andI0the amplitude of the RF current.
coordi-FIG. 1: Schematic drawing of the theoretical model for the plasma reactor
nates, we obtain 1 r
∂ ∂r
r∂Aϕ
∂r
+ ∂
2A ϕ
∂z2 +
k2 − 1 r2
Aϕ
= −µ0I0δ(r−a)δ(z−h) (3) wherecis the velocity of light andk=ω/cis the wave num-ber.
Solving the associated homogeneous equation by separa-tion of variables and applying the boundary condisepara-tion on the fields at the conducting wall, we obtain the eigenfunctions of the problem
ψm,n(r,z) = J1
j1,n r b
sen mπz
H
(4) with their respective eigenvalues given by
λ2
m,n=
j1,n
b 2
+mπ
H 2
. (5)
wherejν,nis thenth root of the Bessel functionJν(x).
Devel-oping the vector potential on the basis of the eigenfunctions Aϕ(r,z) =
∞
∑
m=1 ∞
∑
n=1
am,nψm,n(r,z) (6)
and substituting it into equation 3, to take into account the source term, theam,ncoefficients are obtained
am,n=
4a µ0I0sen mπh
H
J1
j1,nab
H b2j1,n
b 2
+mπH2−k2 [J2(j1
,n)]2 . (7)
Using the known relation between the vector potential and fields, it is possible to obtain the electric and magnetic fields inside the chamber,
→
E(r,z,t) =
∞
∑
m=1 ∞
∑
n=1
ωam,nJ1
j1,n r b
sinmπz H
sin(ωt) eϕ,
(8)
the radial component of magnetic field, Br(r,z,t) =−
π H
∞
∑
m=1 ∞
∑
n=1
am,nm J1
j1,n r b
cos mπz
H
cos(ωt)
(9) and its z-component
Bz(r,z,t) = ∞
∑
m=1 ∞
∑
n=1 am,n
j1,n b J0
j1,n
r b
sinmπz H
cos(ωt) .
(10) The fields of an antenna with more than one current loop can be obtained simply by linear superposition. The currents induced at the wall of the vacuum chamber can then be ob-tained from the boundary condition for the tangential com-ponent of the magnetic field. In the actual device, we find it more adequate to employ three current loops. The corre-sponding magnetic field lines and profiles of the currents in the wall of the vacuum chamber are shown in figure 2.
Finally, using equations 9 and 10 is possible to find the inductance of the system,
L= 1
µ0I02
B2r+B2zdV (11)
2.2. Diffusion of Impurities
Because the antenna is placed inside the vacuum chamber, contamination of the samples, due to the material eroded from the antenna, might occur. Yamashita [5] has shown experi-mentally that in a similar system the sample contamination could be disregarded. To address this problem, we developed a theoretical model to study the spatial distribution of the im-purity density in the plasma, due to erosion of the antenna. The corresponding diffusion equation
∇2n−1 D
∂n ∂t =−
F
D (12)
is solved inside the vacuum chamber, with the source term F given by the sputtering rate at the antenna. In this equa-tion,nis the impurity density andDthe diffusion coefficient, assumed to be constant.
To proceed, we specify the source term at the antenna, i.e., F(r,z,t) =F0δ(r−a)δ(z−h), (13) whereF0is the particles sputtering rate.
To compare the density of particles eroded from the an-tennan, calculated using this model, with neutral gas density nnit is necessary to know the values of the free diffusion
co-efficientDand the particle sputtering rateF0. For a simple estimate we can assume the diffusion coefficient constant and given by
D= kBTsputt
Msputtνc
, (14)
whereνc,Msputt, andTsputt are the collision frequency,
par-ticle mass, and temperature of eroded parpar-ticles from the an-tenna, respectively, and
F0= →
FIG. 2: a) Magnetic field lines and surface current density b) on the wall, c) on the base and d) on the top of the chamber for three loop antenna
where the flow of sputtered particles from the antenna,→Γsputt,
is integrated over its surface. We also assume that the sput-tered particles from the antenna are in thermal equilibrium with the neutral gas, i.e., at room temperature.
As can be seen in reference [7], for a pressure near 4.0× 10⁻²mbar, we have thatν
c=ω. Therefore,νc=1.36×10⁷
Hz. The mainly particles eroded from the antenna correspond to iron atoms, which hasMsputt= 9.4×10⁻²⁶kg, so that we
find the free diffusion coefficientD≈1.0×10⁻³m2s−1. To determineF0, we assume that the flow of ions to be uni-form on the whole surface of the antenna; using the value of the surface area approximatelyS=1×10⁻⁴m2, we can es-timate the value ofF0using the experimental results obtained in this work.
By considering the ion flow given by,
Γi=nivB, (16)
whereniis the ion density andvBthe Bohm velocity, given
by
vB=
kBTe Mi
, (17)
and assume that the flow of sputtered particles is given by
Γsputt=γΓi, (18)
whereγ is the sputtering yield; its value for iron and to the range of energies reached in the actual experimental condi-tions is around 10−3.
Using the values obtained for the pressure of 4.0×10⁻² mbar near to the antenna, ni =3×10¹⁵ m−3, Te = 4 eV
and argon massMi=Mn=6.68×10⁻²⁶kg, we find thatF0 ≈1,0×10¹²s−1.
The diffusion equation can be solved by introducing sepa-ration of variables and by applying the proper boundary con-ditions. Therefore the eigenfunction of the problem is ob-tained
ϕm,n(r,z) =J0
j0,n r b
sinmπz H
(19) with their eigenvalues being given by
ξ2
m,n=
j0,n
b 2
+mπ
H 2
. (20)
Expandingn(→r,t)andF(→r,t)on the basis of eigenfunc-tions
n(→r,t) =
∞
∑
n=1 ∞
∑
m=1
am,n(t)ϕm,n(
→
r) (21)
and
F(→r,t) =
∞
∑
n=1 ∞
∑
m=1
cm,n(t)ϕm,n(
→
r), (22)
and substituting back into equation 12, the coefficientsam,n(t)
are obtained
am,n(t) =e−Dξm,n t t
0
cm,n(τ)eDξm,n τdτ. (23)
To findam,n(t)we need, therefore, to determine thecm,n
cm,n(t) =
4 Hb2[J
1(j0,n)]2 b
0 H
0 rJ0
j0,n
r b
sin mπz
H
F(r,z,t)dr dz (24)
Finally using the source term, we find the density of impuri-ties inside the reactor, fort>0,
n(r,z,t) =
∞
∑
n=1 ∞
∑
m=1
am,n(t)J0
j0,n r b
sinmπz H
(25) wheream,nare the coefficients given by
am,n(t) =
4a F0
1−e−Dξm,nt
H b2Dξ
m,n[J1(j0,n)]2 J0
j0,n
a b
sin
mπh H
.
(26) Using Fick’s law and taking into account thatΓzis the only
component of the particle flux→Γsputt that contributes to the
flow toward the sample, we find that at the position of the sample,r=0 andz=z0,
Γz=−
π H
∞
∑
n=1 ∞
∑
m=1
m D am,ncos mπz
0 H
. (27)
In the region betweenz0=20 andz0=30 cm, which is the region where the sample is normally placed, we have that the ratio R=nsputt/nn, for pressures of the order of
p = 1,0×10⁻² mbar, is always smaller or of the order of R=1,0×10⁻¹⁰, i.e., the quantity of sputtered particles from the antenna at the sample can be considered negligible. The corresponding flux of sputtered particles on the sample is Γsputt=1,0×10⁸m−2s−1.
To compare this with the flux of the background neutral particle, we take their mean velocity given by
vn=
8kBTn
πMn
. (28)
Substituting the temperature (Tn=300K) and the mass of
the neutral (Mn=6,68×10⁻²⁶kg for Argon) we obtain the
mean velocity asvn= 397.3 m/s. Then, using the equation
Γn=
1
4nnvn (29)
wherenn[m−3] =2,42×10²²p ,pbeing the pressure of the
gas in mbar, we obtain Γn=2,4×10²² m−2s−1, for p =
4,0×10⁻² mbar. Using the equation 29 to estimate the flow of ions and electrons over the sample and using the results obtained in this work, we find thatΓe=4,0×10¹⁷ m−2s−1andΓ
i=1,5×10¹⁷m−2s−1. Therefore, we have that
Γsputt≪Γe≈Γi≪Γn. From this results we conclude that the
contamination of the sample by sputtered material from the antenna is not substantial, confirming the experimental result obtained by Yamashita[5].
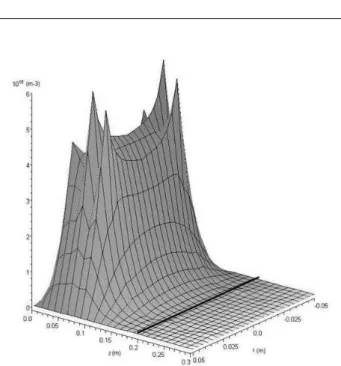
For a steady state condition, we taket→∞and plot the density of impurities as function of position inside the reactor, which is shown in figure 3. We can promptly see that for positions above 18 cm (z-axis) the density of impurities is indeed negligible.
FIG. 3: Density of impurities in the plasma by sputtering on the antenna
3. EXPERIMENTAL SET-UP
3.1. Reactor
The experimental apparatus consists of a plasma produced by a three loop antenna, placed at the position z = 3, 6, and 9 cm, inside the vacuum chamber, a stainless steel (316L) cylinder with four ports to allow access of the main diagnostic systems, Langmuir probe, electrostatic energy analyzer, and optical emission spectroscopy (Figure 4).
Usually, the chamber is pumped to a base pressure of 10−7 mbar and during it operation it is filled with argon to the work-ing pressure, which is kept constant. It has two separated retractile manipulators facing each other, on which the Lang-muir and Faraday cup are attached.
3.2. Oscillator
capac-FIG. 4: Schematic drawing of the plasma reactor
itors in tandem configuration.
FIG. 5: Electric Circuit of the Push-Pull Oscillator. The values of components in the circuit are:C1 =C2 = 56 pF/ 5 kV;C3 =C4 = 500 pF/ 1 kV (tandem);C5 =C6 =C7 = 100 pF/ 400 V;C8 = 10nF/ 3 kV;C9 =C10 = 470 nF/ 1 kV;R1 =R2 = 2.5 kΩ;L1 =L2 = 7µH andL3 = 1 mH
The 304TL tube is a triode of low amplification factor
(µ≈12)with maximum power dissipation on the plate of 300 Watts. The maximum DC voltage on the plate is 3 kV and it can operate at frequencies up to 40 MHz.
3.3. Diagnostic
The Langmuir probe was constructed with a tungsten tip of 0.5 mm diameter and 2 mm length brazed to a glass tube head and connected to a low-pass filter placed inside the tube and close to the probe tip to block the RF fundamental frequency (13.56 MHz) and harmonics. The probe data was obtained
using the Druyvesteyn second derivative method; it gives the energy distribution function of particles in the plasma from the second derivative of the LangmuirI×V curve. The elec-tron energy distribution function, EEDF, is given by
ge(V) =
2m e2A
2eV m
1 2 d2I
dV2 , (30)
whereeandmare the electron charge and mass, respectively, Athe probe area,V =Φp−Vbis the difference between the
plasma potentialΦpand the voltage applied to the Langmuir
probeVb, andIis the current from the Langmuir probe
mea-sured in a shunt resistor.
Once the EEDF is obtained, the densitynecan be promptly
calculated,
ne= ∞
0
ge(V) dV , (31)
and also the effective temperature, given in electron-volts, by Te f f =
2 3ne
∞
0
V ge(V) dV . (32)
4. RESULTS AND DISCUSSION
4.1. Plasma characterization
FIG. 6: Electron Energy Distribution Function in z = 22 cm and r = 0 cm for p = 3.0×10⁻²mbar and P = 120 W
Variations in the density or in the average energy of the species present in the plasma have influence on film deposi-tion, cleaning, and surface treatments. Therefore, knowledge of how external conditions affect intrinsic parameters of the plasma provides a better understanding of the physical mech-anisms involved in the process and, therefore, aids to deter-mine the best experimental plasma cleaning condition.
The EEDF was determined for the conditions used for cleaning the sample. The result is given by the dotted curve in figure 6. From this figure, it is quite clear that the EEDF cannot be described by a Maxwellian
fM(W) =2n
π12
W12
T
3 2
e exp
−W Te
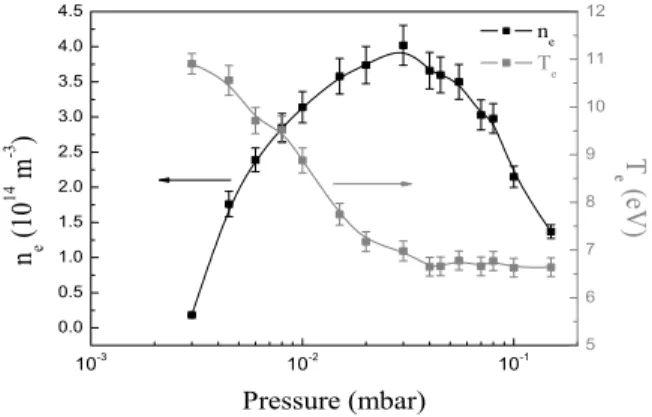
FIG. 7: Electron temperature and density as function of pressure at r = 0 cm and z = 22 cm for P = 120 W
However, using the Druyvesteyn energy distribution func-tion, given by
fD(W) =1,04n W
1 2
W
3 2
av exp
−0,55W 2
W2 av
, (34)
and fitting the experimental data, we obtain a quite good agreement.
FIG. 8: Electron temperature and density as function of the radial position for p = 3.0×10⁻²mbar and P = 120 W
Using equations 31 and 32, we find the electron temper-ature and density for several positions inside of the reactor and for several pressures in order to set the best experimental conditions.
To find the pressure that maximizes the plasma density we vary it from 3.0×10⁻³up to 1.5×10⁻¹mbar. It turns out that the plasma density presents a maximum value around p = 3.0×10⁻²mbar, as shown in the figure 7. All measurements were performed in the position of z = 22 cm, because this is the position in front of the window of observation.
The probe tip is designed so that the radial density and tem-perature profiles can be obtained by rotating it around the axis [9]. The result is shown in figure 8. While the density has the expected behavior, the electron temperature increases with ra-dius, indicating primary electron energy loss due to impact ionization.
We also characterize the behavior of the plasma along the z position. As shown in figure 9, the density increases towards the RF antenna, as expected.
FIG. 9: Electron temperature and density as function of the z posi-tion in r = 0 cm for p = 3.0×10⁻²mbar and P = 120 W
4.2. Cleaning operation
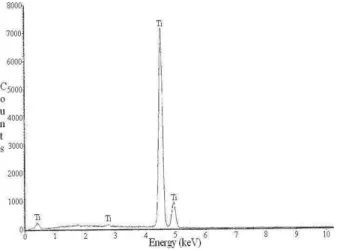
For the characterization of the device as a plasma cleaner, the Energy Dispersive Spectroscopy (EDS) technique was ap-plied to a titanium sample before and after being exposed to the plasma.
FIG. 10: EDS Spectrum of the Dirty Sample
First, we manipulated the sample carelessly in order to add on impurities to its surface. As can be seen in figure 10, the introduced contaminants are mainly hydrocarbons and salts, i.e., chlorine, sodium, potassium. The silicon peak is due to the presence of silicon oxide in the sample.
FIG. 11: EDS Spectrum of the Clean Sample
5. CONCLUSION
We have described in detail the characterization of a RF plasma device that can be useful for plasma cleaning and sur-face treatment, while allowing full access for basic plasma studies. It operates intrinsically in the inductive-coupled mode. For the pressure conditions of this work, the EEDF is Druyvesteyn-like. But the device can be readily used to exploit a broad range of operating conditions.
6. ACKNOWLEDGMENTS
This work was partially supported by the Brazilian Na-tional Council for Research and Development (CNPq). GPC has carried out his work under graduate fellowship from CAPES.
[1] C.O. Jung, K.K. Chu, B.G. Hwang, J.T. Moon, M.Y. Lee e J.G. Lee,Thin Solid Films341(1999) p. 112-119.
[2] T.C. Isabell, P.E. Fischione, C.O’Keefe, M.U. Guruz e V.P. Dravid,Microscopy and Microanalysis5(1999) p. 126-135. [3] M.S. Kabir, R.E. Morjan, O.A. Nerushev, P. Lundren, S.
Bengts-son, P. Erickson e E.E.B. Campbell,Nanotechnology16(2005) p. 458-466.
[4] K. Ostrikov,Reviews of Modern Physics77(2005) p. 489-511. [5] M. Yamashita,The Journal of Vacuum Science and Technology
A7(1989) p. 151-158.
[6] G.P. Canal, H. Luna, R.M.O. Galv˜ao,Journal Physics D: Ap-plied Physics43(2010) 025209.
[7] M.A. Lieberman e A.J. Lichenberg,Principles of Plasma Dis-charges and Materials Processing, Wiley, New York 1994. [8] J.D. Jackson,Classical Electrodynamics - Third Edition, Wiley,
Berkeley 1999.