ISSN 1553-345X
© 2012 Science Publications
Corresponding Author: Meng Gao and Xiyong Hou, Key Laboratory of Coastal Zone Environmental Processes, Yantai Institute of Coastal Zone Research, CAS, No.17 Chunhui Road, Yantai, 264003, China
Trends and Multifractal Analyses of
Precipitation Data from Shandong Peninsula, China
Meng Gao and Xiyong Hou
Key Laboratory of Coastal Zone Environmental Processes,
Yantai Institute of Coastal Zone Research, CAS, No.17 Chunhui Road, Yantai, 264003, China
Abstract: Problem statement: Water shortage is a very serious problem in Shandong Peninsula, which is one of the most rapidly developed zone in China. As the major source of water supply is in this area, precipitation is crucial to sustainable development in Shandong Peninsula. The purpose of the present study is to investigate the trend and characteristics of precipitation during the last 4 decades. Approach: The data, both monthly and annual precipitation, were collected from six gauge stations. Both classical statistical and nonlinear analyses for time series analysis were performed. Results: First, it was found that the trend of precipitation in this area was decreasing. Second, the statistical analyses showed that there were two precipitation regimes and the turning point was around 1980. This time is in line with that about climate change in some recent references. Third, the complexity of precipitation time series was also analyzed by nonlinear (multifractal) approach. Frequency analysis showed that the dominant periods of Fractal oscillations were consistent with that obtained in some previous studies. Conclusion/Recommendations: The decreasing trend would be considered in future water resource management. Moreover, the findings of this study are of interest from the perspective of climate change and deserve more research study in the future.
Key words: Precipitation data series, piecewise regression, fractal dimension, climate change, shandong peninsula, multifractal analyses, intervention analysis, linear regression INTRODUCTION
Currently, there is growing concern around the world about global climate change and its projected continuation. For example, large changes in precipitation patterns have been observed within the last few decades (Onof and Arnbjerg-Nielsen, 2009). As we know that precipitation plays an important role in human activities, such as agricultural production and urban water supply (Parida and Moalafhi, 2008). Changes in precipitation are directly related to human living and production, therefore, trends and characteristics of precipitation have drawn a lot of public concern (Label and Ali, 2009; Pal and Al-Tabbaa, 2009).
Shandong Peninsula (also referred to as a Jiaodong peninsula in literatures), located in Shandong Province, is the biggest peninsula in China. It generates 70% of the total GDP of the province and its export and foreign investment accounts for 80% of that for Shandong province while its population and land area only accounts for 50%. As this area is frequently affected by marine monsoons, the climate is characterized by rain
during the summer and autumn and a dry winter and spring. With the rapid population growth and industrialization, Shandong Peninsula has suffered a very serious problem of water shortage in recent years (Wang et al., 2003). So, several efforts have been taken to mitigate the adverse consequence of water shortage, such as constructing a water reservoir (Zheng et al., 2008). Since precipitation is always the major water supply in Shandong Peninsula, then the change in precipitation regime has a crucial impact on local social and economic development. Analyzing the trends and characteristics is the first step to understanding the available water supply and making reasonable policies for water resource management in the future.
peninsula during the past four decades. MATERIALS AND METHODS
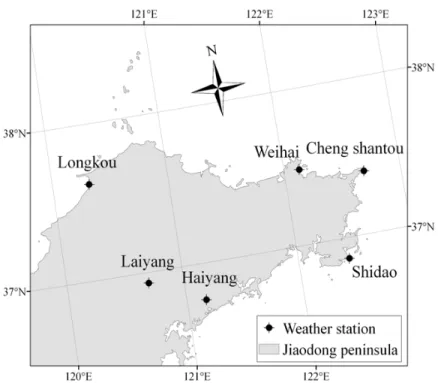
Data: For the present study, the time series of the monthly precipitation from 6 gauge stations will be used. For five stations, the time series span from 1961-2008 and that for the other station is from 1964-1961-2008. Figure 1 presents the locations of the five gauge stations. From Fig. 1, it can be obviously seen that the six gauge stations are broadly distributed in the study area. Particularly, five of them are along the coastline, where the coastal cities are also located. Therefore, the result of the present study can be further used in analyzing the impact of precipitation regime change on local socioeconomic development. Details of the locations and the period of observation have been furnished in Table 1.
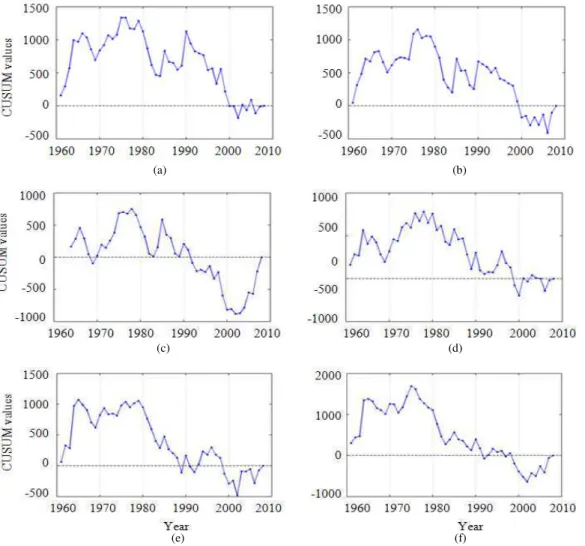
Intervention analysis: In order to analyze the change of precipitation regime, an intervention analysis together with a split sample‘t’-test is needed. Originally, the aim of intervention analysis is to identify and analyze for any sudden changes which might disqualify the time series of precipitation as coming from one population. Here in the present study, it is used to identify the turning point of the precipitation regime. The technique Cumulative Sum (CUSUM) is usually used to detect any possible intervention in specified time series. Assume, x1, x2… xn are the annual precipitation time series over n years, then the CUSUM value (y1) at any time i is given by Eq. 1:
i i i 1 i 2 1 i i
y =(x +x− +x− + +⋯ x )− ⋅n (
∑
x / n) (1) where, ni is the time-scale position of a datum. The suspected point of intervention can be identified graphically in virtue of the plot of computing CUSUM vs. time. Then the precipitation series will be split into two samples by this point and statistical analysis (split sample ‘t’-test) can be done. A split sample ‘t’-test can be easily completed using some statistical software packages such as R-package or Statistical Toolbox in Matlab Environment. The destination of intervention analysis here is to reveal whether there is a significantanalyses of annual precipitation are performed. Once precipitation regime changes, a single linear model may not provide an adequate description of the relationship between average annual precipitation and time. A nonlinear model may not be appropriate either. However, piecewise linear regression is more competitive since it is a form of linear regression that allows multiple linear models to be fit to the data for different ranges of explanatory variables. Piecewise regression models are ‘broken-stick’’ models, where two or more lines of different slopes are joined at unknown points, called ‘‘breakpoints’’ (Toms and Lesperance, 2003). Breakpoints can be used as estimates of thresholds and are used here to determine the turning point of the precipitation regime.
Multifractal analysis: For one-dimensional data series, Fractal Dimension (FD hereafter for simplicity) is frequently calculated to represent the signal complexity. Different numerical methods have been developed to compute FD (Higuchi, 1988; Kalauzi et al., 2005) and the consecutive difference method will be applied in this study. We do not want to describe too much about the consecutive difference method and the rationale and computation details can be found in the following references (Kalauzi et al., 2005; 2009; Millan et al., 2008).
Fig. 1: Location of rain gauge stations in Shandong peninsula Table 1: Details of location of rain gauge stations and precipitation statistics at six stations
Precipitation statistics Precipitation statistics for
Location up to 1980 (annual) the entire period (annual)
--- --- ---
Gauge station Latitude Longitude Period of data Average Std. CV Average Std. CV
Shidao 36°52´N 122°26´E 1961-2008 835 163 0.195 738 191 0.256
Chengshantou 37°24´N 122°41´E 1961-2008 718 146 0.203 642 181 0.282
Weihai 37°29´N 122°19´E 1964-2008 708 155 0.219 680 179 0.263
Longkou 37°37´N 120°19´E 1961-2008 631 128 0.202 567 131 0.231
Laiyang 36°55´N 120°42´E 1961-2008 734 191 0.261 653 186 0.284
Haiyang 36°46´N 121°10´E 1961-2008 783 252 0.322 688 219 0.318
For calculation of Fractal oscillations, due to the low-pass filtering properties of a moving window, it is better to choose short length windows (≤20). Once FDW (t) for a special window length LW is constructed, then the oscillatory behaviors will be revealed by calculating Fast Fourier Transform (FFT) on the FDW (t) data. Before doing FFT, FDW (t) must be filtered in order to eliminate any potential subharmonic. Contrary to the calculation of Fractal oscillations, the calculation of Fractal trends needs long windows in order to attenuate as many oscillatory components as possible. As the resulting trends still depended on window length, it is necessary to determine that particular window length at which FDW (t) becomes more linear. The optimal window length LW is determined by calculating the Pearson’s coefficients of linear correlation between the discrete time position of the window (t) and calculated Fractal dimension (FDW (t) (Kalauzi et al., 2009).
RESULTS AND DISCUSSION
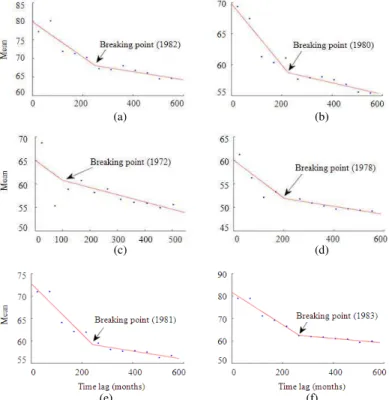
observed. Especially, when the length of the samples was increased to 120, the variances in the six stations decreased sharply. The turning point corresponds to the year 1981, which is consistent with the prediction of the intervention analysis that the precipitation regime changed around 1980. Next, the mean values of the time series using the same sample sizes that were used for the variance. Analogously, there are also obvious decline in the mean values. Piecewise linear regressions were performed with breaking point to illustrate the trends of precipitation explicitly. Figure 4 gives calculated mean precipitation and the corresponding regressed lines for
2
(t 249) [70.77 0.0108 t (months)] (t 249)R 0.94p 0.01
≤ = −
> = <
(2)
2
Chengshantou : Mean [69.8 0.0493 t (months)] (t 225) [60.8 0.0093 t (months)]
(t 225) R 0.92p 0.02
= −
≤ = −
> = <
(3)
2
Weihai : Mean [64.9 0.0425 t (months)] (t 99) [62.3 0.0154 t (months)] (t 99) R 0.76, p 0.01
= −
≤ = −
> = <
(4)
(a) (b)
(c) (d)
(e) (f)
(a) (b)
(b) (d)
(e) (f)
Fig. 3: Relationship between time series variance (monthly precipitation) and sample size. (a)Shidao; (b) Chengshantou; (c) Weihai; (d) Longkou; (e) Laiyang; (f) Haiyang
(a) (b)
(c) (d)
(e) (f)
(a) (b)
(c) (d)
(e) (f)
Fig. 5: Fractal trends, calculated by applying optimal length moving windows (a: 330; b: 350; c: 280; d: 350; e: 300; f: 330) for calculation of (a) Shidao; (b) Chengshantou; (c) Weihai; (d) Longkou; (e) Laiyang; (f) Haiyang
2
Longkou : Mean [60 0.0402 t (months)] (t 203) [53.6 0.0058 t (months)] (t 203), R 0.86, p 0.01
= −
≤ = −
> = <
(5)
2
Laiyang : Mean [72.7 0.056 t (months)]
(t 242) [61.3 0.009 t (months)]
(t 242), R 0.93, p 0.01
= − ≤ = − > = <
(6)
2
Haiyang : Mean [81.6 0.0722 t (months)] (t 266) [65.1 0.0101 t (months)] (t 266), R 0.94, p 0.01
= −
≤ = −
> = <
(7)
From Eq. 2-7 and Fig. 4, it can be seen that the breaking point from piecewise regression are almost around 1980, although the result of piecewise regression from Weihai gauge station does not support this conjecture.
Nonlinear study: Nonlinear approach is more and more widely used to study the complicated dynamics of time series. The consecutive difference method is one newly developed a nonlinear approach that can be used
to measure the complicity of a time series (Higuchi, 1988). In this study, multifractal analysis is based on the Fractal dimension that is computed from consecutive different. The trend and oscillations of the time series of precipitation data were studied respectively.
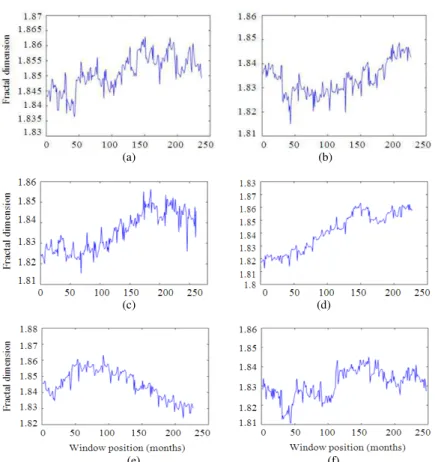
Fractal trend will firstly be investigated. Figure 5 illustrates the FDW (t) with respect to window positions. In order to obtain the most linear FDW (t), the optimal window length is chosen that corresponds to the maximized Pearson’s correlation coefficient. Obviously, the optimal window lengths for the six time series are different. From Fig. 5, we can see that the Fractal dimensions for the six time series ranged from 1.81-1.86, although the Fractal trends are not identical and with oscillations. Actually, except the time series from the Laiyang gauge station, Fractal dimensions of time series from all the other five stations are increasing.
(a) (b)
(c) (d)
(e) (f)
Fig. 6: Fourier amplitude of Fractal dimension rhythms. In each panel, all amplitude spectra obtained by 6 different window lengths (10-20 samples) are illustrated. (a) Shidao (b) Chengshantou (c) Weihai (d) Longkou (e) Laiyang (f) Haiyang
Then FDW (t) for the six window lengths will be calculated and be detrended using low-pass attenuation technique. The corresponding cutoff frequencies were 0.05-0.1 (1/month), therefore only components having Fourier periods larger than 1.67 years could be shown. The Fractal rhythms for monthly precipitation from the six gauge stations are presented in Fig. 6. The detected peaks of the Fractal rhythms for the six stations are similar. For example, the dominant rhythms correspond to 1.9, 2.2-2.3, 2.9, 3.2, 4.4, 5.5 and 7.8-7.9 years. An interesting phenomenon is that the detected 2.2 and 4.4 years Fractal oscillations were consistent with some other Fractal oscillations of precipitation time series in Europe and South America (Kalauzi et al., 2009; Millan et al., 2008).
CONCLUSION
This study focused on identifying the long-term changes in the precipitation over Shandong peninsula, China. The period that the study covers starts from 1961 and extends to 2008 and the precipitation data come from six gauge stations. Both classical statistics and nonlinear analyses have been used to interpret the precipitation change.
precipitation was analyzed. It was found that both the variance and mean decreased against the number of samples (month in this study). The decreasing of variance can be explained by the decreasing of intensity of extreme precipitation in recent years. The decreasing of rainfall extremes has a remarkable impact on water resource recovery, which is also one of the most adverse impacts of climate change on local environment in Shandong.
Second, piecewise regression also revealed the two precipitation regimes and precipitation trends. On the other hand, the breaking points verified again that the precipitation regime changed around 1980. All in all, both intervention analysis and piecewise linear regression showed a clear sign of precipitation decreasing. Change in precipitation regime is becoming an increasingly important component that needs to be considered in managing fresh water resources. Especially, the fresh water resources in Shandong Peninsula are under pressure not only from rapidly growing demands due to population increase and economic development but also from seawater intrusion. The trend analysis of precipitation in the present study implies that the problem of water shortage in Shandong peninsula will be more severe. In order to mitigate and even to solve the water shortage problem, some measures such as water transferring, waste water recycling and sea water desalination should be considered (Wang et al., 2003).
At last, the complexity of the precipitation time series was analyzed by computing the Fractal dimension of the precipitation time series. Both the Fractal trends and rhythms were detected through analyzing the window Fractal dimension. The Fractal dimensions were considerably larger than 1.8, which means that the time series of precipitation time series show short-term variations. Although the distances between the six stations are not too long, there are slight differences between the Fractal trends of precipitation time series of the six gauge stations. It is due to terrain differences since the Shandong peninsula is a hilly peninsula where the terrain is an important factor that affects local precipitation. Moreover, the major periods of Fractal dimension variation were detected by Fourier analysis. Most interestingly, the 4.4 year period is consistent with the periods discriminated in some previous studies. Millan et al. (2008) and Kalauzi et al. (2009) suspected that this 4.4 year period is related to ENSO events. It seems
in other references, such as the precipitation data in Ecuador (Kalauzi et al., 2009. Along with the turning point of precipitation regime, the consistence of the period of Fractal oscillations stimulate us to ask a question that whether the precipitation change is caused by global change? As noted in the introduction, the aim and scope of this study are merely to investigate the trends and complexity of precipitation in Shandong peninsula. However, the results and conclusions obtained here is not enough to answer the above question. Therefore, to fully investigate the trends of climate change, precipitation data must be investigated in association with other climatic variables such as evaporation and temperature.
ACKNOWLEDGEMENT
This study was supported by the National Natural Science Foundation of China (No.31000197) to GM, as well as Knowledge Innovation Project of Chinese Academy of Sciences (No. KZCX2-391 EW-QN209).
REFERENCES
Higuchi, T., 1988. Approach to an irregular time series on the basis of the Fractal theory. Physica D: Nonlinear Phenomena, 31: 277-283. DOI: 10.1016/0167-2789(88)90081-4
Kalauzi, A., M. Cukic, H. Millan, S. Bonafoni and R. Biondi, 2009. Comparison of Fractal dimension oscillations and trends of rainfall data from Pastaza Province, Ecuador and Veneto, Italy. Atmospheric
Res., 93: 673-679. DOI:
10.1016/j.atmosres.2009.02.007
Kalauzi, A., S. Spasic, M. Culic, G. Grbic and L.J. Martac, 2005. Consecutive differences as a method of signal Fractal analysis. Fractal's, 13: 283-292. DOI: 10.1142/S0218348X05002933
Label, T. and A. Ali, 2009. Recent trends in the central and western Sahel rainfall regime (1990-2007). J.
Hydrol., 375: 52-64. DOI:
10.1016/j.jhydrol.2008.11.030
Onof, C. and K. Arnbjerg-Nielsen, 2009. Quantification of anticipated future changes in high resolution design precipitation for urban areas. Atmospheric
Res., 92: 350-363. DOI:
10.1016/j.atmosres.2009.01.014
Pal, I. and A. Al-Tabbaa, 2009. Trends in seasonal precipitation extremes-An indicator of ‘climate change’ in Kerala, India. J. Hydrol., 367: 62-69. DOI: 10.1016/j. jhydrol. 2008.12.025
Parida, B.P. and D.B. Moalafhi, 2008. Regional rainfall frequency analysis for Botswana using L-Moments and radial basis function network. Phys. Chem.
Earth, 33: 614-620. DOI:
10.1016/j.pce.2008.06.011
Toms, J.D. and M.L. Lesperance, 2003. Piecewise regression: A tool for identifying ecological thresholds. Ecology, 84: 2034-2041. DOI: 10.1890/02-0472
Wang, Y., Y. Zhang and W. Zheng, 2003. Water resources and potential of seawater desalination in Shandong peninsula. Desalination, 157: 269-276. DOI: 10.1016/S0011-9164(03)00406-5
Yan, S., S. Zhou and H. Li, 2004. Diagnostic analysis of a rainstorm in Shandong peninsula influenced by a distant tropical depression. J. Tropical Meteorolo., 14: 73-76.
Zheng, B., Q. Guo, Y. Wei, H. Deng and K. Ma et al., 2008. Water source protection and industrial development in the Shandong Peninsula, China from 1995 to 2004: A case study. Resou. Conser.
Recycl., 52: 1065-1076. DOI: