Analysis of Heart Rate Variability by Applying
Nonlinear Methods with Different Approaches for
Graphical Representation of Results
Evgeniya Gospodinova, Mitko Gospodinov
Institute of Systems Engineering and Robotics Bulgarian Academy of Sciences, Sofia, BULGARIANilianjan Dey
Department of Computer Science and Engineering, Bengal College of Engineering and Technology
Durgapur, West Bengal, INDIA
Ivan Domuschiev
II Department of Internal Diseases Multiprofile Hospital for Active Treatment―St.Panteleimon‖, Plovdiv, BULGARIA
Amira S. Ashour
Department of Electronics and Electrical Communications Engineering, Faculty of Engineering, Tanta University,
EGYPT. College of CIT, Taif University, KSA
Dimitra Sifaki-Pistolla
GIS expert in the Clinic of Social and Family Medicine, Faculty of Medicine, University of Crete, GREECE
Abstract—There is an open discussion over nonlinear properties of the Heart Rate Variability (HRV) which takes place in most scientific studies nowadays. The HRV analysis is a non-invasive and effective tool that manages to reflect the autonomic nervous system regulation of the heart. The current study presents the results of HRV analysis based on 24-hour Holter ECG signals of healthy and unhealthy subjects.Analysis of heart intervals is performed with the use of original algorithms and software, developed by the authors, to quantify the irregularity of the heart rate. The main aim is the formation of the parametric estimate of patients’ health status, based on mathematical methods that are applied on cardiac physiology. The obtained results show that the analysis of Holter recordings by nonlinear methods may be appropriate for diagnostic, forecast and prevention of the pathological cardiac statuses. Different approaches of graphical representation and visualization of these results are used in order to verify this.
Keywords—Heart Rate Variability (HRV); ECG signal; Holter signal; nonlinear graphical methods
I. INTRODUCTION
Cardiovascular disease is among the top 10 causes of death worldwide. Ischemic heart disease, stroke and chronic obstructive lung have remained the top major causes of death for the past decade. Latest scientific research has shown that cardiovascular diseases can be mathematically analyzed and predicted by cardiac screening for early detection of possible complications to prevent disease or improve quality of life. The diagnostic parameter defined by the electrocardiograms (ECG) is the heart rate variability (HRV) which is calculated by measuring the time between heartbeats. In 1996, the European Society of Cardiology and North American Society of Pacing and Electrophysiology gave recommendations on the clinical
usage of the HRV method for evaluating cardiology disease risks as: myocardial infarction (heart attacks), sudden cardiac death and essential hypertension. In addition, diabetes mellitus is associated with a reduced vagal tone and elevated sympathetic activity [1]. HRV is reduced in patients with diabetes mellitus, suggesting dysfunction of cardiac autonomic regulation which has been associated with increased risk for pathological cardiac events [2]. The main advantage of HRV signals is that it can be calculated real time in non-invasive manner, while all current biomarkers used in clinical practice are discrete and imply blood sample analysis [3].
24-hour Holter recordings. Each record contains information of around 100,000 heartbeats. The first problem is based on the fact that fluctuation of the physiological signals possesses hidden information in the form of self-similarity, scale structure, monofractality and multifractality, through the application of these methods [8-13]. The fractal, multifractal and wavelet-based multifractal analysis of the fluctuations is useful not only for getting the comprehensive information for physiological signals of patients, but also provide a possibility for foresight, prognosis and prevention of the pathological statuses. The second problem is due to the large volume of research information is extremely important the correct determination the trend of the disease of the patients for relatively large period of time - several years, for instance. Such tests are performed periodically to compare the graphic characteristics of images from clinical studies undertaken as a result of treatment and give an idea of the patient's condition and treatment quality. Nonlinear analysis of cardiology data is a relatively new scientific approach to assess the dynamics of heart activity. The above described problems are solved by setting of the following interesting and important objectives:
Presentation of some interesting results that depict the fractal and multifractal structure of RR intervals time series, extracted from 24-hour Holter ECG records of healthy and unhealthy subjects by applying the following non-linear methods: Detrended Fluctuation Analysis (DFA), Rescaled adjusted the range statistics plot (R/S), Wavelet Transform Modulus Maxima (WTMM) and Poincaré plot.
Demonstration of different approaches of graphical representation of results from clinical studies of HRV and assessment of health status of patients with cardiovascular disease with multiple and periodic 24-hour Holter studies of treatment. Trends in the evolution of patients‘ health status are not possible to ascertain in short, five minute HRV records, described most often in specialized articles.
The key components of the proposed approaches are directed at the analysis of HRV by applying nonlinear methods for graphical representation of results, as new direction of the scientific investigations in parallel with research works with the linear methods.
II. SUBJECT AND METHODS A. Subjects
In this article two groups of signals are analyzed: RR time series of 16 normal subjects and 16 congestive heart failure (CHF) patients. These signals are consisting of around 100 000 data points, corresponding to 24-hour Holter ECG recordings. B. Methods
Detrended Fluctuation Analysis (DFA)
DFA is a technique for detecting correlations in time series [14]. These functions are able to estimate several scaling exponents from the RR time series being analyzed. The scaling exponents characterize short or long-term fluctuations. The main steps of the DFA algorithm [15] are as follows:
Step 1: The RR interval time series is integrated using (1):
. N 1,..., k ), __ RR (RR y(k) k 1 j j
(1) Where:
y(k) is the kth value of the integrated series;
RRj is the jth inter beat interval;
__
RR is the average inter beat interval over the entire series.
Step 2: The integrated time series is divided into boxes of equal length n.
Step 3: In each box of length n, a least square line is fitted to the RR interval data and yn(k) denote these regression lines.
Step 4: The integrated series y(k) is detrended by subtracting the local trend in each box. The root-mean-square fluctuation of this integrated and detrended series is calculated using (2):
.
∑(y(k)-yn(k))
1/N F(n) N 1 k 2
(2)Where: F(n) is a fluctuation function of box size n.
Step 5: The procedure is repeated for different time scales. The relationship on a double-log graph between fluctuations F(n) and the time scales n can be approximately evaluated by a linear model that provides the scaling exponent α given in (3):
.
α n ≈
F(n) (3) The parameter α is depended by the correlation properties of the signal. By changing the parameter n can be studied how to change the fluctuations of the signal. Linear behavior of the dependence F (n) is an indicator of the presence of a scalable behavior of the signal. The slope of the straight line is used to determine the value of the parameter α. For uncorrelated signals, the value of this parameter is within the range (0, 0.5), where α > 0.5-it is an indication for the presence of correlation. When α = 1, the signal is 1 / f –noise, while α = 1.5 – usually Brownian motion.
In the case of RR time series, DFA shows typically two ranges of scale invariance, which are quantified by two separate scaling exponents, α1and α2, reflecting the short-term and long-term correlation[14]. The short-term fluctuation is characterized by the slope α1 obtained from the (log n, log F(n)) graph within range 4≤n≥11 and the slope α2 obtained fromthe range12≤n≥64.
Rescaled adjusted range Statistics plot (R/S)
statistical properties (all moments) of a stochastic process do not change for all aggregation levels. The main properties of self-similar processes include:
Slowly decaying variance – the variance of the sample is decreased more slowly than the reciprocal of the sample size.
Long-range dependence - the process is called a stationary process with longrange dependence if its autocorrelation function is non-summable. The speed of decay of autocorrelations is more hyperbolic than exponential.
Hurst effect – it expresses the degree of self-similarity.
Based on the Hurst exponent value, the following classifications of time series can be realized:
H=0.5 indicates a random series;
0<H<0.5 – the data in the signal are anti-correlated;
0.5<H<1 – the data in the signal are long-range correlated.
The R/S method for the time series X(n) is asymptotically given by a power law:
H n
R(n)/S(n) . (4)
Where:
R(n) is the range which is the difference between the minimum and maximum accumulated values;
S(n) is the standard deviation estimated from the observed data X(n);
H is the Hurst exponent.
To estimate the Hurst exponent is plotted R(n)/S(n) versus n in log-log axes. The slope of the regression line approximates the Hurst exponent [17].
Wavelet Transform Modulus Maxima
One of the most popular tools in wavelet-based multifractal analysis is the Wavelet Transform Modulus Maxima (WTMM) method. This method is based on wavelet analysis that is called ―mathematical microscope‖ due to its ability to maintain good resolution at different scales [18]. The WTMM method is a powerful tool for statistical description of non-stationary signals, because the wavelet functions are localized in time and frequency.
Physiological signals, such as RR time series, can be efficiently represented by decomposition at different frequencies. The conventional method for this approach is a Fourier analysis. This analysis works well for stationary time series, but not for non-stationary signals, when the frequency content changes over time. Scalograms is based on the wavelet transform simultaneously to provide both time and frequency information and is important for investigating the signal. The WTMM method is used for analysis the multifractal scaling properties of fractal signals. This method uses continuous wavelet transform to detect singularities of a signal. WTMM is
based on Wavelet analysis (continuous wavelet transform, skeleton construction) and Multifractal formalism (partition function calculation, scaling exponential function estimation, multifractal spectrum estimation). The method consists in the following basic steps [19, 20].
Step 1: Calculation of the Continuous Wavelet Transform (CWT)
In many previous researches, the wavelet decomposition has been used in the medical domain [21- 27] and in other domains [28- 30]. A wavelet is simply a finite energy function with a zero mean value. The wavelet transform is defined by the continuous time correlation between the time series and the particular wavelet of scaling parameter τ and shift parameter α:
(t)dt f(t)Ψ α)
W(τ( τ,α
. (5)
Where the analyzing wavelet ψτ,α(t)is a zero average function with local support, centered around zero. The family of wavelet vectors is obtained by the translations and dilatations of the ―mother‖ wavelet:
α τ t ψ α 1 (t)
ψτ,α (6)
The wavelet transform has a time frequency resolution which depends on the scale α.
Step 2: Calculation of the local maxima of the modulus of the CWT
The modulus maxima (largest wavelet transform coefficients) are found at each scale α as the supreme of the computed wavelet transforms such that:
. 0 τ α) W(τ( (7)
Step 3: Calculation of the partition function Z(q,α) based on wavelets, where α is the dilatation and q is a scale factor
The originality of the WTMM method is in the calculation of the partition function Z(q,α) from the maxima lines. The space-scale partitioning given by the wavelet tiling or skeleton defines the particular partition function:
q
α
τ, αsupW(τ(α) α)
Z(q, . (8)
Where α is the dilatation and q is a scale factor. This partition function effectively computes the moments of the absolute values of the wavelet resonance coefficients W(τ,α).
Step 4: Calculation of the decay scaling exponent τ(q) The scaling exponent τ(q) is the Legendre Transform of the multifractal spectrum f(α) for self-similar time series and relates the fractal dimensions to the order q of the partition function Z(q,α). The slope of the double-logarithmic plot allows the computation of the decay scaling exponent. This slope can be obtained using linear regression:
)
q C( α τ(q)log α) Z(q,If the scaling exponent is everywhere convex, that indicates multifractal behaviour of the signal. In case of monofractal behaviour, the scaling function is a line.
Step 5: Estimation of the spectrum of singularities
Multifractal formalism uses multifractal spectrum for the detailed fractal analysis of the signal. The Multifractal spectrum function shows the scope of all fractal measures. The Multifractal spectrum function is calculated from scaling function via Legendre transform by formulas:
dq ) q ( d
α(q) and f(α)= α
min(αq-τ(q)). (10)
The spectrum width on multifractality degree is ∆α=αmax– αmin, this quantity is a measure of the range of fractal exponents in the time series, so if ∆α is large, the signal is multifractal.
Poincaré plot
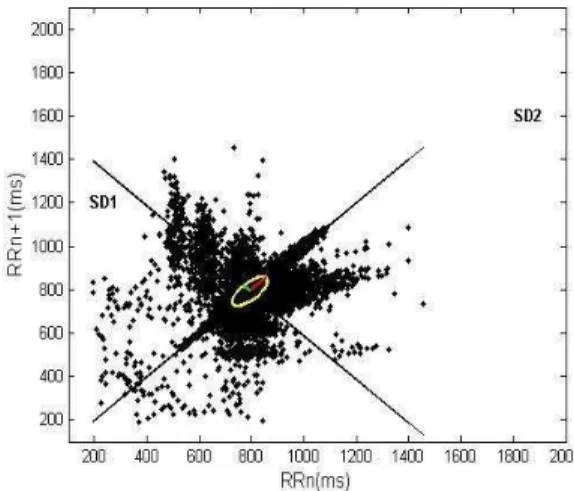
The Poincaré plot analysis is a graphical nonlinear method to assess the dynamic of HRV [31, 32]. The method provides summary information as well as detailed beat-to-beat information on the behaviour of the heart. It is a graphical representation of temporal correlations within the RR intervals derived from ECG signal. The Poincaré plot is known as a return maps or scatter plots, where each RR interval from time series RR = {RR1, RR2, …, RRn, RRn+1} is plotted against next RR interval. The Poincaré plot parameters used in this paper are SD1, SD2 and SD1/SD2 ratio. SD2 is defined as the standard deviation of the projection of the Poincaré plot on the line of identify (y=x) and SD1 is the standard deviation of projection of the Poincaré plot on the line perpendicular to the line of identify. These parameters can be defined by (11), (12) and (13).
x={x1, x2, …, xn}={RR1, RR2, …, RRn} (11) y={y1, y2, …, yn}={RR2, RR3, …, RRn+1} (12)
SD1= var(d1); SD2= var(d2); Ratio= 2 SD
1 SD
. (13) Where:
i = 1, 2, 3, …, n and n is the number of points in the Poincaré plot;
var(d) is the variance of d;
2
y x
d1
; 2
y x
d2
.
Parameter SD1 has been correlated with high frequency power, while SD2 has been correlated with both low and high frequency powers. The ratio SD1/SD2 is associated with the randomness of the HRV signal. It has been suggested that the ratio SD1/SD2, which is a measure of the randomness in HRV time series, has the strongest association with mortality in adults.
III. RESULTS AND DISCUSSION
The analyzed data for describing two types of signals are combined in two groups: records of 16 CHF patients and 16 normal subjects.
Fig. 1(a) and Fig. 1(b) distribute the RR interval signals of normal subject and CHF patient. The graphs of RR time data are highly nonstationary (the mean, variance and other variation in the time statistical parameters). The fluctuations of heart-beat time series are larger in healthy subject compared to CHF patient.
Fig. 2(a) and Fig. 2(b) illustrate the values of scaling exponents and the slope of the line F(n) on double logarithmic plot obtained by using the DFA method for the investigation of signals. The results indicate a significant difference between patients with CHF and healthy controls in short- and long- time scales. Healthy subjects typically show the fractal behavior of heartbeat dynamics while patients with CHF show an alteration in fractal correlation properties.
The results of the R/S method applied to the studied signals to determine the value of the Hurst exponent are shown in Fig.3 (a) and Fig. 3 (b). The obtained results show that RR time series are correlated, i.e. they are fractal time series. For normal subject, the value of Hurst exponent is high due to the variation being chaotic, and for CHF patient this value decreases because the RR variation is low.
The wavelet decomposition of RR sig.nals can be used to provide a visual representation of the fractal structure of the investigated signals (Fig. 4 (a), Fig. 4 (b)). The wavelet coefficients are presented in their absolute values and coloured in accordance with colour bar. Dark colours correspond to lower absolute wavelet coefficient values. Light colours indicate higher absolute wavelet coefficient values corresponding to large heartbeat fluctuations. The wavelet analysis uncovers hierarchical scale invariance and reveals a self-similar fractal structure in the healthy subjects and a loss of this fractal structure in the unhealthy (CHF) patients.
On Fig.5 (a) and Fig. 5 (b) show the variations of scaling exponents τ(q) over all the values of q for the normal subject and CHF patient. The constantly changing curvature of the τ(q) curves for the normal subject suggests multifractal behaviour. In contrast, τ(q) is a straight line for CHF patient, indicating monofractal behaviour.
Fig. 6 (a) illustrates the multifractal spectrum of RR time series of normal subject and Fig. 6 (b) for CHF patient. The curve of normal subject has multifractal behaviour due to the wide range of local values of the Hölder exponent α (∆α=αmax– αmin). The range of values of the Hölder exponent α for RR time series of healthy subject is ∆α=0.79177, and for RR time series of CHF patient is ∆α=0.30351. The interval ∆α, corresponding to the RR signal for CHF patient is more than two times lower than the signal for a normal subject.
the reflection of short term variability of heart rate. The parameter SD2, the length of the semi-major axis, is the measure of long term variability. Since the values of the SD1 and SD2 parameters depend on the RR intervals, the ratio of SD1 to SD2 is used to make comparison among Poincaré plots from different subjects. The values of SD1 and SD2 are higher in normal subjects comparatively to the congestive heart failure subjects.
The modern measuring devices (ECG Holters) and computational methods for data analysis allow the researcher and medical expert derive various summary parameters, analyze recurring patterns, transform the data and much more [33-37].
The values of the investigated parameters (mean ± standard deviation) are reported in Table 1. The described methods are realized by the Matlab software developed in the research project for nonlinear analysis of ECG signals.
There are some limitations in the using of the described analytical system. First, in the study are include restricted number of investigated subjects for analysis of RR time series (16 normal subjects and 16 CHF patients). Secondly, the study
is oriented only at nonlinear methods for analysis of RR time series. These limitations are included because this paper is prepared not for showing the medical treatment results, but for demonstration the conceptual developments of the software environment and database as a new and modern tools to analyze, quantify and display the results of nonlinear analysis of HRV signals.
Concerning the practical application of the above described nonlinear methods of graphical representation, the graphical user interface of the software environment, database and appropriate signal processing algorithms were developed and implemented in MATLAB 6.0. The database includes background parameters, for example subject‘s gender, age and level of physical activity as well as disease history. The variations are presented by measurement the time of day and describing the circadian rhythm of the subject. The graphical representation of the circadian rhythm for every subject is stored in database, which enable evaluation of the results in a relatively long period of time for the post-analysis of the prescribed treatment, for instance. Moreover, the circadian rhythm of the physiological states can be assessed with this database‘s results.
Fig. 1. (a). RR interval series of healthy subject Fig. 1. (b). RR interval series of CHF patient
Fig. 3. (a). R/S analysis of healthy subject
Fig. 3. (b). R/S analysis of CHF patient
Fig. 4. (a). Continuous wavelet transform of healthy subject Fig. 4. (b). Continuous wavelet transform of CHF patient
Fig. 6. (a). Multifractal spectrum for RR series of healthy subject Fig. 6. (b). Multifractal spectrum for RR series of CHF patient
Fig. 7. (a). Poincaré plots for RR series of healthy subject Fig. 7. (b). Poincaré plots for RR series of CHF patient
TABLE I. PARAMETERS FOR HEALTHY SUBJECTS AND CHFPATIENTS
Parameter Healthy subjects CHF patients
alpha 1 (DFA) 1.2942±0.205 0.7424±0.311 alpha 2 (DFA) 0.9942±0.319 0.5731±0.376 alpha (DFA) 1.0578±0.198 0.6192±0.231 Hurst (R/S) 0.9186±0.018 0.5715±0.219 q=0, α (WTMM) 1.1214±0.9 0.55752±0.4 q=10, α (WTMM) 0.7167±0.6 0.48008±0.3 q=-10, α (WTMM) 1.5085±0.8 0.78359±0.5 q=0, f(α) (WTMM) 1.0 1.0
q=10, f(α) (WTMM) 0.12414±0.08 0.59004±0.26 q=-10, f(α) (WTMM) 0.06879±0.07 0.12029±0.16
∆α (WTMM) 0.79177±0.15 0.30351±0.09 SD1 [ms] (Poincare plot) 46.393±22.02 35.123±18.23 SD2 [ms] (Poincare plot) 295.295±35.9 87.5673±29.12 SD1/SD2 (Poincare plot) 0.15711±0.32 0.40121±0.41
IV. CONCLUSION
The paper presents a part of the latest scientific investigations and the results of application of nonlinear mathematical methods, based on the fractal theory for selected group of patients. The used nonlinear graphical methods for HRV analysis are an effective tool to visualize HRV fluctuations. The results of the cardiac data and the selected
methods of analysis managed to give detailed information about the physiological status of the patients and to develop a work towards a framework for prognosis and prevention of pathology status in case of cardiovascular disease. This proves the importance of the proposed study.
The use of graphic-oriented methods for analysis and visualization of cardiac diseases facilitates decision-making by health professionals, especially in case of large amounts of information such as the analysis of diurnal heart rhythms.
Furthermore, analysis of trends of patients with cardiovascular diseases is more easily run by periodically comparing the plots of about 100.000 entries heart rate, rather than to make comparisons of numerical values or ECG data.
Graphic images of the clinical studies for each patient are automatically stored in a database with easy access and the ability to compare the periodic 24-hour recordings. The study of patient data jointly with the application and comparison of graphics obtained from several nonlinear mathematical methods is recommended.
REFERENCES
variability: standards of measurement, physiological interpretation, and clinical use. Circulation, 1996; 93:1043-1065.
[2] M. P. Tarvainen, D.J. Cornforth, P. Kuoppa, J. A. Lipponen, H. F. Jelinek, ―Complexity of Heart Rate Variability in Type 2 Diabetes-Effect of Hyperglycemia”, 35th Annual International Conference of the IEEE EMBS, Osaka, Japan, 3-7 July, 2013.
[3] F. Buccelletti, M. G. Bocci, E. Gilardi, V. Fiore, S. Calcinaro, C. Fragnoly, R. Maviglia and V. Franceschi, ―Linear and Nonlinear HRV
Indexes in Clinical Practice”, Computational and Mathematical
Methods in Medicine, 2012; vol. 2012.
[4] H.Kadat, V. Akkava, A. B. Sozen, S. Salman, S. Demirel, M. Ozcan, D. Atilqan, M. T. Yilmaz, O. Guven, ―Heart rate variability in diabetes
patients”. J Int Med Res., 2006; 34(3): 291-296.
[5] M. Mirza, A. N. K. Lakshmi, ―A comparative study of Heart Rate Variability in diabetic subjects and normal subjects”, International Journal of Biomedical and Advance Research, 2012; 3(8): 640-644. [6] G. Ernst, Heart Rate Variability, Springer-Verlag London, 2014. [7] U. R. Acharya, J. S. Suri, J. A. E. Spaan, S. M. Krishnan, ‖Advances in
Cardiac Signal Processing”, Springer-Verlag Berlin Heidelberg , 2007.
[8] D. M. Kumar, S.C. Prasannakumar, B. G. Sudarshan, D. Jayadevappa, ―Heart Rate Variability Analysis: A Review”. International Journal of Advanced Technology in Engineering and Science, 2013; 1(6): 9-24. [9] P. Ivanov, L. Amaral, A. Goldberger, S. Halvin, M. Rosenblum, H.
Stanley, Z. Struzik, ―Multifractality in human heartbeat dynamics”. Macmillan Magazines Ltd, 1999; 461-465.
[10] P. Ivanov, Z. Chen, K. Hu, H. Stanley, ―Multiscale aspects of cardiac control”. Physica A 344 (3–4), 2004; 685–704.
[11] P. Ivanov, L. Amaral, A. Goldberger, S. Halvin, M. Rosenblum, H. Stanley, Z. Struzik, ―From 1/f noise to multifractal cascades in
heartbeat dynamics”. Chaos, 2001; 11( 3): 641-652.
[12] H. E. Stanley, L. A. N. Amaral, A. L. Goldberger, S. Havlin, P. Ch. Ivanov, C. -K. Peng, ―Statistical physics and physiology: Monofractal
and multifractal approaches”. Elsevier, Physica A 270, 1999; 309-324.
[13] J. Wang, Y. Ning, Y. Chen, ―Multifractal analysis of electronic cardiogram taken from healthy and unhealthy adult subjects‖. Physica A 323, 2003; 561-568.
[14] C.K. Peng, S. Halvin, H. E. Stanley, A. L. Goldberger, ―Quantification of scaling exponents and crossover phenomena in nonstationary heartbeat time series‖. Chaos, 1995; 5: 82-87.
[15] K. Rawal and I. Sain, “Comparative Analysis of Measuring Heart Rate Variability during Different Phases of Menstrual Cycle in Young Healthy Women”, International Journal of Information and Electronics Engineering, 2014; 4(1): 62-66.
[16] H. E. Hurst, Black and Y. M. Sinaika, “Long-term Storage in
Reservoirs: An experimental Stud”, Constable, London, 1965.
[17] M. Gospodinov, E. Gospodinova, “The graphical methods for estimating Hurst parameter of self-similar network traffic”. International Conference on Computer Systems and Technologies, 2005; IIIB.19-1—IIIB.19-6.
[18] A. Puckovs, A. Matvejevs, ―Wavelet Transform Modulus Maxima
Approach for World Stock Index Multifractal Analysis”. University,
Information Technology and Management Science, 2012; 76-86. [19] C. Los, R. Yalamova, ―Multifractal Spectral Analysis of the 1987 Stock
Market Crash”. Social Science Research Network, 2004; 1-21.
[20] C. TAŞ, Dr. G. Ünal, ―Multifractal Behavior in Natural Gas Prices by using Mf-DFA and WTMM Methods”. Global Journal of Management and Business Research Finance, USA, 2013; 13(11: 1-5.
[21] N. Dey, A. Das, S. S. Chaudhuri " Wavelet Based Normal and Abnormal Heart Sound Identification Using Spectrogram Analysis‖, International Journal of Computer Science & Engineering Technology (IJCSET), 2012; 3(6).
[22] N. Dey, P. Das, A. Das, S.i S. Chaudhuri, “DWT-DCT-SVD Based Intravascular Ultrasound Video Watermarking‖, Second World
Congress on Information and Communication Technologies (WICT 2012), Trivandrum, India, 2012.
[23] N. Dey, P. Das, A. Das, S. S. Chaudhuri, ―Nilanjan Dey, Poulami Das, Achintya Das, Sheli Sinha Chaudhuri, “DWT-DCT-SVD Based Blind Watermarking Technique of Gray Scale Image in Electrooculogram Signal“, International Conference on Intelligent Systems Design and Applications (ISDA-2012), Kochi, 2012 .
[24] N. Dey, S. Biswas , A. Roy, A. Das, S. S. Chaudhuri, “Analysis Of Photoplethysmographic Signals Modified by Reversible Watermarking Technique using Prediction-Error in Wireless Telecardiology”, International Conference of Intelligent Infrastructure, 47th Annual National Convention of CSI –Kol, 2012.
[25] N. Dey, S. Biswas , P. Das, A. Das, S. S. Chaudhuri, “Lifting Wavelet Transformation Based Blind Watermarking Technique of
Photoplethysmographic Signals in Wireless Telecardiology”, Second
World Congress on Information and Communication Technologies (WICT 2012), Trivandrum, India, 2012.
[26] N. Dey, G. Mishra, B. Nandi , M. Pal, A. Das, S. S. Chaudhuri,”Wavelet Based Watermarked Normal and Abnormal Heart Sound Identification
using Spectrogram Analysis”, 2012 IEEE International Conference on
Computational Intelligence and Computing Research (ICCIC),Tamilnadu College of Engineering,Coimbatore,India, 2012. [27] N. Dey, P. Maji , P. Das, A. Das, S. S. Chaudhuri, “An Edge Based
Watermarking Technique of Medical Images without Devalorizing
Diagnostic Parameters”, International Conference on Advances in
technology and Engineering, NMIMS University, Mumbai, India, 2013. [28] T. Bhattacharya, N. Dey, S. R. B. Chaudhuri, ―A Novel Session Based
Dual Image Encoding and Hiding Technique Using DWT and Spread
Spectrum”, International Journal on Computer Science and Engineering,
2012; 3(11):3510-3517.
[29] N. Dey, A. Roy, S. Dey,”A Novel Approach of Color Image Hiding using RGB Color planes and DWT‖, International Journal of Computer Applications, 2011; 36(5).
[30] T. Bhattacharya, N. Dey, S. R. B. Chaudhuri, ―A Session based Multiple Image Hiding Technique using DWT and DCT‖, International Journal of Computer Applications, 2012; 38(5).
[31] R. L. Smith, E. R. Wathen, P. C. Abaci, N. H. V. Bergen, I. H. Law, M. D. Dick II, C. Connor, E. L. Dove, ―Analyzing Heart Rate Variability in Infants Using Non-Linear Poincare Techniques‖. Computer in Cardiology, 2009; 36:673-876.
[32] Md. Rhaman, A. H. M. Karim, M. Hasan, J. Sultana, ‖Successive RR Interval Analysis of PVC with Sinus Rhythm Using Fractal Dimension, Poincaré plot and Sample Entropy Method‖. I.J.Image, Graphics and Signal Processing, 2013; 2:17-24.
[33] N. Dey, S. Samanta, XS. Yang, SS Chaudhri , A Das, "Optimisation of Scaling Factors in Electrocardiogram Signal Watermarking using Cuckoo Search", International Journal of Bio-Inspired Computation (IJBIC), 2013; 5(5):315-326.
[34] N. Dey, S Mukhopadhyay, A Das, SS Chaudhuri, ―Analysis of P-QRS-T Components Modified by Blind Watermarking Technique Within the Electrocardiogram Signal for Authentication in Wireless Telecardiology using DWT‖, I.J. Image, Graphics and Signal Processing (IJIGSP), ISSN:2074-9074, 2012; 7:33-46.
[35] N. Dey, AB. Roy, A. Das, SS. Chaudhuri,‖Stationary Wavelet Transformation Based Self-Recovery of Blind-Watermark from Electrocardiogram Signal in the Wireless Telecardiology‖, International Workshop on Intelligence and Security Informatics for International Security (IIS'12) , Trivandrum, India, 2012.