www.nat-hazards-earth-syst-sci.net/16/2713/2016/ doi:10.5194/nhess-16-2713-2016
© Author(s) 2016. CC Attribution 3.0 License.
A new search-and-rescue service in the Mediterranean Sea:
a demonstration of the operational capability and an evaluation
of its performance using real case scenarios
Giovanni Coppini1, Eric Jansen1, Giuseppe Turrisi1, Sergio Creti1, Elena Yurievna Shchekinova1,2, Nadia Pinardi1,3, Rita Lecci1, Ivano Carluccio1, Yogesh Vittal Kumkar1, Alessandro D’Anca1, Gianandrea Mannarini1,
Sara Martinelli1, Palmalisa Marra4, Tommaso Capodiferro5, and Tommaso Gismondi5 1CMCC, Fondazione Centro Euro-Mediterraneo sui Cambiamenti Climatici, 73100 Lecce, Italy 2SRCSB, Stuttgart Research Center Systems Biology, Stuttgart, Germany
3UNIBO, University of Bologna, viale Berti Pichat, 6/2, 40127 Bologna, Italy
4LINKS S.p.a., Links Management and Technology, via R. Scotellaro, 73100 Lecce, Italy 5ITCG, Italian Coast Guard, Direzione Marittima di Bari, Bari, Italy
Correspondence to:Giovanni Coppini ([email protected])
Received: 15 May 2016 – Published in Nat. Hazards Earth Syst. Sci. Discuss.: 1 June 2016 Revised: 17 October 2016 – Accepted: 26 October 2016 – Published: 15 December 2016
Abstract. A new web-based and mobile decision support system (DSS) for search-and-rescue (SAR) at sea is pre-sented, and its performance is evaluated using real case sce-narios. The system, named OCEAN-SAR, is accessible via the website http://www.ocean-sar.com. In addition to the website, dedicated applications for iOS and Android have been created to optimise the user experience on mobile de-vices. OCEAN-SAR simulates drifting objects at sea, using as input ocean currents and wind data provided, respectively, by the CMEMS and ECMWF. The modelling of the drift-ing objects is based on the leeway model, which parame-terises the wind drag of an object using a series of coeffi-cients. These coefficients have been measured in field exper-iments for different types of objects, ranging from a person in the water to a coastal freighter adrift. OCEAN-SAR provides the user with an intuitive interface to run simulations and to visualise their results using Google Maps. The performance of the service is evaluated by comparing simulations to data from the Italian Coast Guard pertaining to actual incidents in the Mediterranean Sea.
1 Introduction
The Mediterranean Sea faces thousands of accidents and consequent search-and-rescue (SAR) operations. Accidents are related to tourism and recreational activities along the Mediterranean coastlines, maritime commercial, trans-port and fishery operations and to the immigrations from Africa and south-eastern Mediterranean countries. The Ital-ian Coast Guards and ItalItal-ian Navy intervened in thousands of SAR operations in national Italian and international wa-ters (e.g. 2649 standard SAR operations which led to the res-cue of 5885 persons and 938 SAR operations related to im-migrants fluxes which led to the rescue of 154 018 persons in 20151).
The aim of OCEAN-SAR is to provide support to mar-itime authorities and operational centres (i.e. the Coast Guards) to optimise the strategy of search by reducing the extent of search area extension and increasing the probabil-ity of success of a rescue operation in case of a sea accident. In addition to maritime authorities, private users are also in-terested in getting support from SAR activities.
1Source of information: “Annual report of the operational
Two main categories of users can be identified: (1) the public authorities responsible at different levels for SAR emergency management, such as the Coast Guard; (2) pri-vate users (i.e. maritime transport companies, yachters) that would like to start the search and rescue of an object or per-son lost at sea from their boat. Private users might even be interested in searching for objects that the public authorities would not be responsible to find.
The SAR modelling tools are based on Lagrangian mod-elling (Breivik and Allen, 2008) forced by wind and currents environmental fields.
Advances in high-resolution ocean operational forecasts (Pinardi et al., 2003; Oddo et al., 2009; Tonani et al. 2008) for the Mediterranean Sea, nowadays delivered by the Coper-nicus Marine Environmental Monitoring Service (CMEMS) Mediterranean Monitoring and Forecasting Centre (MED-MFC), are available to provide accurate hourly frequency forecasts each day for the next 5 days and every week an analysis of the last week. Analyses are produced thanks to the data assimilation system (Dobricic et al., 2007; Dobri-cic and Pinardi, 2008), which corrects the model results with observations (e.g. sea level anomaly, temperature and salin-ity profiles). The MED-MFC analysis and forecasts can be used to force SAR models.
2 The leeway model description
The leeway model (Breivik and Allen, 2008) uses an ensem-ble of drifting particles to model the movement of an object due to surface currents and wind. The motion of a particlen in this ensemble is described by the following model equa-tion:
dx= [C(x, t )+L(x, t )]dt, (1)
whereC(x, t )is the surface current velocity andL(xt )is the wind-induced velocity or leeway. The latter is separated in a downwind component (Ld) and crosswind component (Lc) as
L(x, t )=
cosθW −sinθW sinθW cosθW
nLc(x, t ) Ld(x, t )
. (2)
Heren= ±1 is the intrinsic orientation of the particle and
θWthe direction of the wind defined in an anti-clockwise di-rection with respect to the north. The components of the lee-wayLi (i=c,d are parameterised as
Li(x, t )=
ai+
ǫi,n
20
|W (x, t )| +bi+
ǫi,n
2 , (3)
withW (xt )the wind at 10 m height,ai andbi the so-called
leeway coefficients andǫi,na per-particle perturbation. This
perturbation is a random number drawn from a normal distri-bution with standard deviationσiand it represents the
uncer-tainty on theai andbi parameters. The result of this
param-eterisation is that the drift characteristics of an object can be
described by the six object class parameters2ad,bd,σd,ac, bcandσc.
The values of the object class parameters have been de-termined experimentally (Allen and Plourde, 1999; Allen, 2005) for various types of objects, ranging from persons in various conditions to life rafts and medium-sized ships. The current implementation of the model defines a total of 64 classes and sub-classes.
Uncertainties on the wind and the ocean currents can be incorporated into the simulation by introducing an additional perturbation to the forcing fields. The uncertainty on the cur-rent forcing field is considered to be negligible compared to the uncertainty on the wind forcing. This is warranted by the fact that the ocean data have a higher spatial and tempo-ral resolution. Moreover, the uncertainty on the effect of the wind forcing is further amplified by the uncertainty on the leeway itself. Therefore only the perturbation for the wind is taken into account:
W (x, t )→W (x, t )+ǫW,n. (4)
The components of the perturbationǫW,n are random
vari-ables drawn from a normal distribution, with standard de-viation equal to the wind field uncertainty σW. At present
no spatial or temporal correlations are taken into account for σW. New values forǫW,n are calculated for every
par-ticlenat every model timestep.
The model is initialised by creating an ensemble of N=500 particles of a given object class. Their initial po-sitions are distributed according to a two-dimensional nor-mal distribution centred at the last known position (LKP) and with a standard deviation corresponding to the radius of un-certainty. This radius is typically of the order of a few kilo-metres. The initial orientation of the particles,n, is chosen
randomly.
To obtain the particle trajectories and the final distribu-tion, Eq. (1) is integrated from the initial to the final time us-ing the midpoint method with a fixed-size timestep of 360 s. The possibility of particles changing their orientation, the so-called jibing, is taken into account by randomly changing the sign ofn after every timestep. The probability of a
parti-cle changing orientation is set to 4 % per hour (Allen, 2005); i.e. a particle has a 4/1000 chance of changing orientation at a given timestep.
3 Environmental forcing
The leeway model in OCEAN-SAR system is forced by ocean currents data CMEMS MED-MFC and atmospheric 2For a small number of classes the crosswind coefficients
have an additional dependency on the left/right of downwind orientation n. In that case the crosswind coefficients become (ac, bc, σc)=
(al, bl, cl) , = −1
wind data from ECMWF: these datasets are used for the cal-culation of the particles trajectories.
3.1 CMEMS MED-MFC products
The OCEAN-SAR uses the ocean currents analysis and fore-cast from the CMEMS MED-MFC operational implementa-tion of the NEMO model in the Mediterranean Sea (Tonani et al., 2008, 2009; Oddo et al., 2009). The fields used are currents in meridional and zonal direction at multiple depth level. The name of the CMEMS MED-MFC product used is MEDSEA_ANALYSIS_FORECAST_PHY_006_001. Cur-rents are provided with hourly resolution on a 1/16◦(i.e. 6 km in the meridional direction) mesh on 72 vertical levels. Three type of products are used by OCEAN-SAR:
1. the 10-day forecasts produced every day originating from the 12:00 UTC analysis/simulation;
2. the 1-week analysis produced every Tuesday from the 12:00 UTC analysis, including data assimilation (Dobri-cic and Pinardi, 2008; Dobri(Dobri-cic et al., 2007);
3. the 1-day simulations produced every day (except Tues-day) from the 12:00 UTC analysis/simulation, which do not include data assimilation.
3.2 ECMWF products
The wind forcing at 10 m height is provided by the IFS model operated by the ECMWF. The model outputs are available with 3-hourly resolution for the first 3 days after the analysis, the horizontal resolution is 1/8◦(12.5 km), and the forecasts refer to the 12:00 UTC analysis.
4 The OCEAN-SAR operational system
The core of OCEAN-SAR runs on the CMCC super-computer. The OCEAN-SAR system is running in opera-tional mode since June 2014. The system is available as a web and mobile application and has been configured so that registered users can submit the jobs. The service is freely available on the web and free of charge.
The OCEAN-SAR logical architecture is shown in Fig. 1 and consists of the following components:
– user interfaces (UIs) for the web and mobile client de-vices;
– sea situational awareness (SSA) platform (web portal, map service and message broker);
– the Complex Data Analysis Module (CDAM) in the computing centre.
Only the relevant components of the system will be described in this paper; for a comprehensive description of the SSA
platform, CDAM and their components, see Mannarini et al. (2016b).
All the relevant information provided by the users through the UIs (e.g. LKN, duration of the simulation) is transferred through a stream of data using the JavaScript Object Nota-tion (JSON). This stream of data is first passed to the SSA platform through the message broker and then to the CDAM again through the message broker.
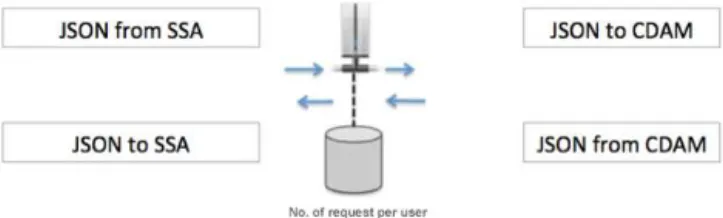
All the messages are exchanged by the components us-ing the JSON format. Communication and data exchange be-tween the client devices and the SSA platform via the Rep-resentational State Transfer (REST) web services are estab-lished by means of the message broker component that re-ceives and forwards the requests to the CDAM hosted on the computational cluster at CMCC (Fig. 2). The message broker is capable of storing, in a database (grey cylinder in Fig. 2), the number of requests per user in order to avoid simultane-ous submissions by the same user.
The OCEAN-SAR pre-processing shell script parses the input JSON string in order to obtain the values of parameters required by the model to run the simulation. The parameters names and default values are listed in Table A1. The CDAM, before running the simulation, checks the data availability for the defined domain and simulation period. The wind data are used only if the “depth” argument is 1; for the sub-surface simulations no wind is used. According to the “simulation time” argument the current and wind data are selected. The NetCDF files are extracted into a specific location of the file system where a folder is created for each simulation. The depth slab at a required depth is made by using NetCDF Op-erators (NCO) utilities. The data concatenation is performed across the time variable. The wind and current data at sea are extrapolated the ocean data towards the coast using a procedure called SeaOverLand (De Dominicis et al., 2013; Mannarini et al., 2016a), which performs an extrapolation of the original data considering for each cell grid point an average of the eight nearest values and then doing different iterations. This procedure optimally fills, for the currents, the gaps that remain between the ocean model domain and the high-resolution coastline. Moreover also the wind data over the ocean model domain are extrapolated over the land point to ensure that the simulation is performed with data of wind over the ocean and is not affected by wind over land. Then a high-resolution mask is applied to remove the part of the extrapolated ocean data on land.
Figure 1. OCEAN-SAR high-level architecture describing the main components of OCEAN-SAR (UIs on client devices, SSA platform, CDAM, leeway model).
Figure 2.Message broker main functionalities are presented con-sisting of the exchange of messages between the SSA platform and the CDAM.
checks for the size of the output data and subsequently, if it is not empty, stores the output in JSON format as a new file. The communication via REST web services is established through the message broker, a component of the SSA plat-form that receives the requests and forwards them to the CDAM hosted on the computational cluster. The model is executed on the server and returns the results to the user via the message broker.
The message broker is a unique component hosted by the SSA platform. As illustrated in Fig. 1 it is responsible for the communication both among client devices and the SSA plat-form and between CDAM and the SSA platplat-form. The CDAM receives input data from the SSA platform through the
mes-Figure 3.SSA component responsible for data persistence and for the exchange of information between the UI and the message bro-ker.
sage broker and sends back the results produced by the model to the SSA platform through the message broker.
All the user requests as well as the results of the simula-tions are stored in a database by a component of the SSA platform, which ensure data persistency (Fig. 3). This com-ponent is used by the OCEAN-SAR, for instance, to store and retrieve previously done simulations.
Thanks to this component, each user can visualise at any time the results of previously performed simulations and view the parameters used to run the simulation.
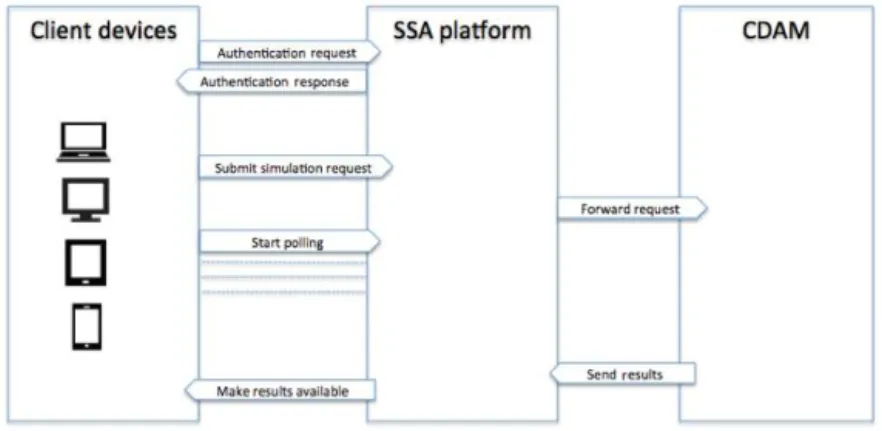
Figure 4.Data flow among OCEAN-SAR components.
Figure 5.The parameters of simulation displayed on the UI are available on the left side of the UI. The boxes on the left side of the figure describe the different parameters.
On the server the model is executed using Simple Linux Utility for Resource Management (SLURM) and the output are produced in ASCII format. The CDAM (output prepara-tion component) converts the ASCII output data into JSON format in order to send them back to the SSA platform (see Fig. 2). The CDAM then sends the output to the message bro-ker. In the meantime, client applications retrieve the results by polling for their availability, checking the content and ex-tracting the information required for the visualisation. After completion of the loop the results are provided to the user via graphically displayed fields; in particular, the particles and their trajectory are presented on the map, respectively, as
yellow and black circles, making use of Google shapes3, and the currents are presented as overlaying tiles provided by a WMS service.
Web and mobile applications
The web and mobile applications (iOS and Android) pro-vide the access for the user through their user interfaces. The web application has been adapted for use on mobile devices 3https://developers.google.com/maps/documentation/javascript/
Figure 6. Each parameter simulation in the UI show a question mark which consists of the help option of that parameter. By click-ing on the question mark the user will obtain a pop-up box (yellow box) with explanation on the meaning of the selected parameter.
(tablet and mobile phone) and apps are available on the Ap-ple and Android stores for free.
The UI allows setting the parameters of the simulation, submitting requests and displaying the results of simulations on a map. The version of the UI presented in this paper is ref-erenced as OCEAN-SAR version 1.1 and dated May 2016. The configurable parameters are shown in Fig. 5. The pa-rameters can be grouped as follows:
– general parameters (simulation name, object category); – last known position (start position and start date); – simulation duration;
– forecasting system (wind and currents models); – display settings (environmental fields on/–off).
The meaning of each set of parameters is explained (see Fig. 6) through a yellow box that appears on the UI after a click of the mouse.
The results of a simulation can be displayed in the UI in two ways: with or without the magnitude of environmental fields (Fig. 7).
Figure 7.Display of the simulation results with environmental fields (left panel) and without environmental fields (right panel).
Figure 8.Detailed visualisation of the output of the model.
The UI (Fig. 8) visualises the following output and results of the model:
– drifters final positions (yellow or red markers); – mean trajectory drift (black curve);
– drifters stranded along the coast line (red markers); – red contour line around the drifters, a convex hull that
identified the search area.
5 Real case scenarios
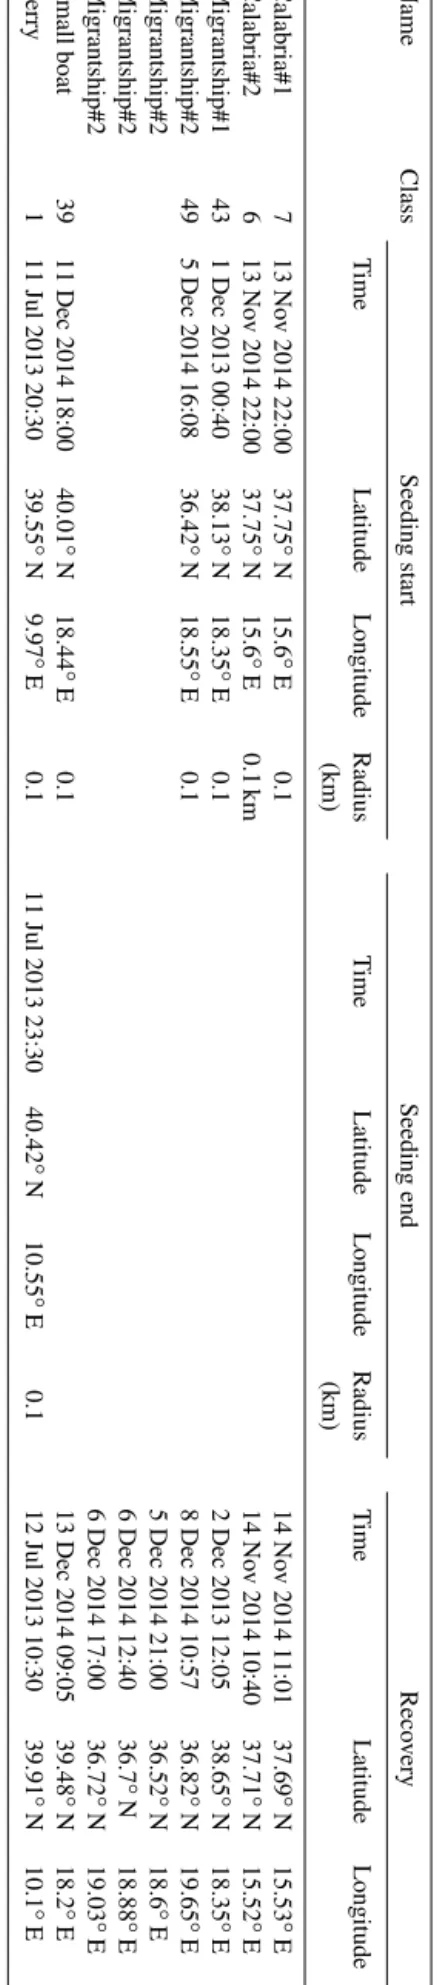
OCEAN-SAR has been validated by reconstructing real case scenarios (accidents and field exercises) using information provided by the Italian Coast Guard. A selection of these real case scenarios is presented in this section. Environmen-tal fields used in the validations exercises have been the sur-face currents analysis provided by CMEMS MED-MFC and the wind analysis provided by ECMWF, both described in Sect. 3.1.
The Italian Coast Guard provided the information of five past events (Table 1) with different characteristics pre-sented in the next subsections (Sects. 5.1 to 5.5). Section 5.6 provides a discussion on each validation case.
5.1 Field exercise in Reggio Calabria waters
The field exercise in Reggio Calabria waters involved two different types of objects:
– raft (here called Calabria#1)
– search-and-rescue dummy (here called Calabria#2). The raft and the dummy used in the exercise are presented in Fig. 9.
Figure 9.Photos of the dummy (Calabria#1) and raft (Calabria#2) used by Italian Coast Guard in the Calabria exercise.
Figure 10. Results of the “Calabria1” simulation done using OCEAN-SAR showing the positions (yellow points) of the particles at the end of the simulation 11:00 UTC of 14 November 2014. The red place marker indicates the position in which the raft was col-lected. The green place marker represent the position in which the raft was launched at sea and started drifting. The black line shows the mean trajectory of the simulated particles. During the exercise the wind speed ranged from approximately 3 to 10 m s−1,
predom-inantly in the south-south-west direction.
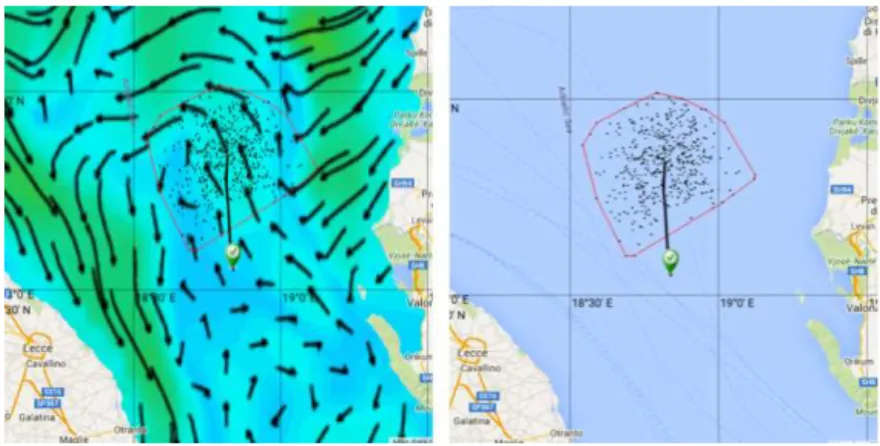
Figure 12. (a)Results of the “migrantship1” simulation done using OCEAN-SAR showing the positions (yellow points) of the particles at the end of the simulation 12:05 UTC of 2 December 2013. The red place marker indicates the position in which the ship was found. The green place marker represent the position in which the ship was found and start drifting. The black line shows the mean trajectory of the launched particles.(b)For each position of the drifters (yellow points) little black arrows indicates the direction and speed of their movement. Green streamlines indicate current direction and coloured background shows their magnitude (white is low, blue is high). The wind field is shown by the red vectors.
Figure 14. Results of the “small boat” simulation done using OCEAN-SAR showing the positions (yellow points) of the parti-cles at the end of the simulation 09:05 UTC on 13 December 2014. The red place marker indicates the position at which the boat was rescued. The green place marker represents the last known position. The black line shows the mean trajectory of the simulated particles.
reported in Table 1 (Calabria#1 for the raft and Calabria#2 for the dummy).
5.2 Commercial fishing vessel used as a migrant ship In this case the commercial fishing vessel with many mi-grants on board was simulated using the “commercial fish-ing vessel (14–30 m) troller”, which was the correspondent object in the IAMSAR manual. The boat was found by the Italian Coast Guard at 00:40 UTC on 1 December 2013 (Ta-ble 1). The sea state was rough (more than 6 m of waves height) and the boat was drifting with failed engine; there was no possibility of immediate rescue and the ship was reached 1 day later when the sea state was better and allowed the transhipping of the migrants. The transshipment started at 12:05 UTC on 2 December 2013 at after 36 h of drift in the new position where the vessel was found (Table 1). The time and positions recorded for the ship are reported in Table 1 (Migrantship#1).
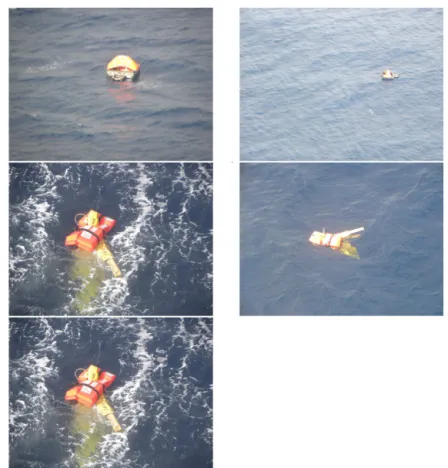
5.3 Sixty-metre-long ship used as migrant ship
A 60 m long ship was transporting immigrants, who were res-cued and transhipped. After the immigrant transshipment it was not possible to tow the ship; therefore it was left drifting. The position was recorded through successive sightings and these data are used for the validation of OCEAN-SAR. There is no specific corresponding type of object in the IAMSAR manual. The most similar ship type is the coastal freighter, which is used in the simulation of this paper. The time and positions recorded for the ship are reported in Table 1 (Mi-grantship#2).
Figure 15.Results of the “ferry” simulation done using OCEAN-SAR showing the positions (yellow points) of the particles at the end of the simulation 10:30 UTC on 7 December 2012. The red place marker indicates the position at which the person was found at sea after 14 h from the last time he was seen on board of the ferry. The green segments represent the route of the ferry along which the particles have been simulated.
5.4 Small boat
On 11 December 2014 at 18:00 UTC a person on board a small boat started drifting along the Italian coast of Apulia region (position given in Table 1). The location and time have been reconstructed based on the information provided by the person on board and are expected to be quite accurate (error estimated to be less than 1 nm and less than 2 h). After 2 days, at 09:05 UTC on 13 December 2014, the person was found alive on his boat in the position reported in Table 1. The type of object in the IAMSAR manual that best fit the real boat is “skiff V” with a hull smaller than 6 m. The time and positions recorded for the boat are reported in Table 1 (small boat). 5.5 Person at sea lost from a ferry
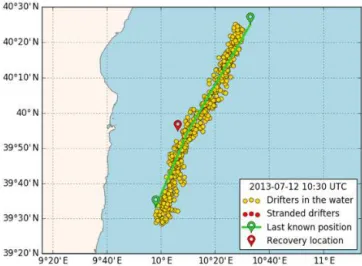
A person fell overboard from a ferry between 20:30 UTC on the 11 July 2013 and the 23:30 UTC. The body of the person was found at 10:30 UTC of 12 July 2013 at the position re-ported in Table 1. In this case the last known position used in the simulation performed with OCEAN-SAR follows the au-tomatic identification system (AIS) path corresponding to the positions of the ship at the time the person might have fallen overboard. The time and positions recorded for the ferry are reported in Table 1 (ferry).
5.6 Discussion on each validation case
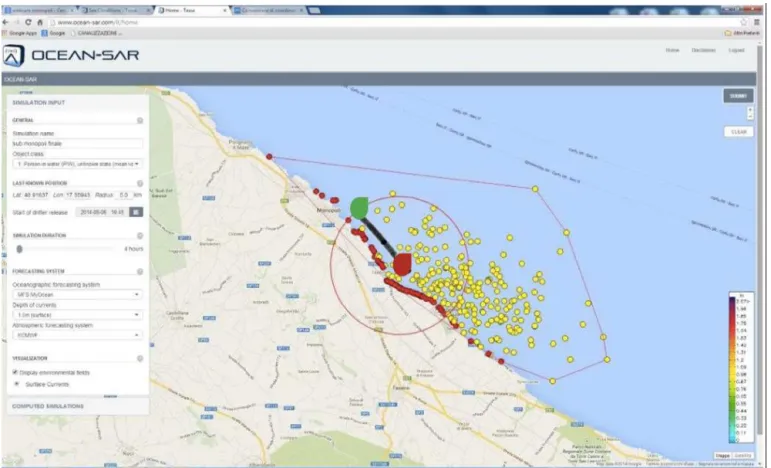
Figure 16.Results of the real case scenario called MONOPOLI; the simulation was done using OCEAN-SAR showing the positions (yellow points and red points on the coast) of the particles at the end of the simulation 14:45 UTC on 6 August 2014. The large red place marker indicates the position in which the person was found at sea after 4 h. The green point represents the last known position at which the diver was lost at 10:45 UTC of 6 August 2014.
the OCEAN-SAR system, but the simulation shows an area more shifted eastward.
In the reconstruction of the Calabria2 (Fig. 11) case the final position of the simulated drifters shows a partial agree-ment with the observation: the dummy drifted westward and its final position after 13 h at sea is just outside the area iden-tified by OCEAN-SAR system, while the simulation shows an area shifted more eastward. OCEAN-SAR system does not show appreciable differences between the SAR raft sim-ulated in Calabria1 and the dummy simsim-ulated in Calabria2. In reality the dummy moved westward faster than the raft.
In the reconstruction of the migrantship1 case (Fig. 12a and b) the final position of the simulated drifters is in good agreement with the observations: the ship drifted northward and its final position after approximately 12 h is inside the area identified by the OCEAN-SAR system. Figure 12b presents the fields of wind and currents and the mean velocity of for each of the particles.
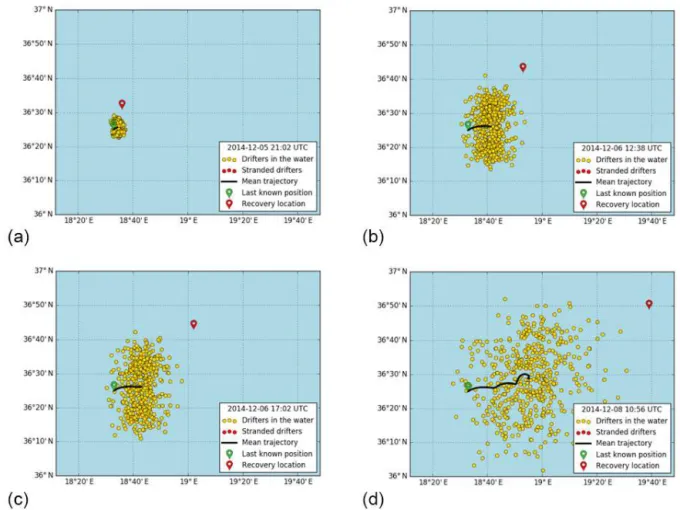
In the reconstruction of the migrantship2 (Fig. 13) case the area identified by the simulated drifters does not include the final position of the ship, which drifted for almost 3 days (66 h). The simulated drifters are moving towards the east, while the ship is faster and moves further north-westward.
In the reconstruction of the small boat case (Fig. 14) the final position of the simulated drifters is not in agreement with the observation: the small boat drifted more south-west and its final position after 15 h at sea is outside the area iden-tified by OCEAN-SAR system. OCEAN-SAR system pdicted correctly a southward movement of the boat, but in re-ality the boat moved faster further westward. The westward position of the boat can also be explained by the fact that the person on the boat was paddling towards land; the coast guard explained that this resulted in a westward movement of the boat.
In the reconstruction of the “ferry” case (Fig. 15) the final position of the simulated drifters is in partial agreement with the observed location of the body found at sea after 13 h of drifting. The real position is few hundred metres westward of the OCEAN-SAR area.
6 Conclusions
OCEAN-SAR is an operational decision support system (DSS), based on the leeway model and implemented as a complete system for on-demand simulation of drifting ob-jects at sea. It uses as input ocean currents and wind data forecasts from third-party providers that are dynamically pre-pared. The DSS is freely available on the web and for mobile devices.
The interaction with the users and the participation of au-thors from the Italian Coast Guard to the co-design and test-ing of the OCEAN-SAR allowed the customisation of the service towards the users’ needs and requirements.
The experience of OCEAN-SAR highlights that research and development activities, in the our case ocean and La-grangian modelling, should as much as possible aim to con-verge towards operational applications so that their results and finding are tested in operational mode and in real case scenarios by the users, often situations in which weak com-ponents of the systems and bugs are highlighted. The opera-tional testing also helps to demonstrate the effectiveness and importance of research results for supporting societal chal-lenges and in our case the benefit for maritime safety and for saving lives at sea.
As possible future improvements to OCEAN-SAR we foresee the use of the high-resolution sub-regional and coastal operational models for currents and wind forecasts, especially in coastal areas, and the implementation of an application program interface (API) layer which will allow users to interface their own software tools with OCEAN-SAR, the further testing by users and the integration with users’ software already existing and in use for the manag-ing of SAR emergency at sea. Validation of SAR trajectory model using actual SAR cases as done in this paper is impor-tant, especially from the user’s point of view, but has some limitations: (1) in some cases there is large uncertainty on the LKP; (2) in some cases we cannot be sure that the cor-rect or most appropriate search object are selected and used; (3) since there would not be any measurement of currents and wind at the time and location of the event, modelers need to consider that there might be large uncertainties in the winds and currents estimated by the model.
7 Data availability
Appendix A: Description of user-defined parameters for the SAR DSS
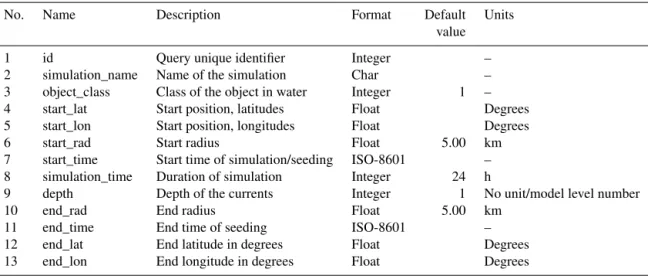
Table A1.Description of user-defined parameters. The data are sorted according to name of parameter as written in the input string, descrip-tion, value type and units.
No. Name Description Format Default Units value 1 id Query unique identifier Integer – 2 simulation_name Name of the simulation Char – 3 object_class Class of the object in water Integer 1 – 4 start_lat Start position, latitudes Float Degrees 5 start_lon Start position, longitudes Float Degrees 6 start_rad Start radius Float 5.00 km 7 start_time Start time of simulation/seeding ISO-8601 – 8 simulation_time Duration of simulation Integer 24 h
9 depth Depth of the currents Integer 1 No unit/model level number 10 end_rad End radius Float 5.00 km
Acknowledgements. This work was performed in the frame-work of the TESSA Project PON01_02823 supported by PON Ricerca & Competitività 2007–2013 cofunded by UE (Fondo Europeo di sviluppo regionale), MIUR (Ministero Italiano dell’Università e della Ricerca) and MSE (Ministero dello Sviluppo Economico). We thank Copernicus Marine Environment Mon-itoring Service – CMEMS MED-MFC for the provision of the ocean forecasting products, Servizio Meteorologico Aeronautica Militare Italiano for the provision of the wind products and Italian Coast Guard, in particular C. F. Sirio Faè, for the kind cooperation, important suggestions and providing the data related to the real case scenarios used for testing OCEAN-SAR in this paper. Edited by: A. Olita
Reviewed by: K.-F. Dagestad and A. Allen
References
Allen, A. A.: Leeway divergence, Tech. Rep. CG-D-05-05, US Coast Guard Research and Development Center, Berlin, Ger-many, 2005.
Allen, A. A. and Plourde, J. V.: Review of leeway: Field experi-ments and implementation, Tech. Rep. CG-D-08-99, US Coast Guard Research and Development Center, https://ntrl.ntis.gov/ NTRL/ (last access: December 2016), 1999.
Breivik, Ø. and Allen, A. A.: An operational search and rescue model for the Norwegian sea and the North sea, J. Mar. Syst., 69, 99–113, 2008.
De Dominicis, M., Pinardi, N., Zodiatis, G., and Lardner, R.: MEDSLIK-II, a Lagrangian marine surface oil spill model for short-term forecasting – Part 1: Theory, Geosci. Model Dev., 6, 1851–1869, doi:10.5194/gmd-6-1851-2013, 2013.
Dobricic, S. and Pinardi, N.: An oceanographic three-dimensional variational data assimilation scheme, Ocean Model., 22, 89–105, 2008.
Dobricic, S., Pinardi, N., Adani, M., Tonani, M., Fratianni, C., Bonazzi, A., and Fernandez, V.: Daily oceanographic analyses by Mediterranean Forecasting System at the basin scale, Ocean Sci., 3, 149–157, doi:10.5194/os-3-149-2007, 2007.
IMO: IAMSAR Manual 2016 Edition, Vol. I–III, London, UK, 2016.
Mannarini, G., Pinardi, N., Coppini, G., Oddo, P., and Iafrati, A.: VISIR-I: small vessels – least-time nautical routes using wave forecasts, Geosci. Model Dev., 9, 1597–1625, doi:10.5194/gmd-9-1597-2016, 2016a.
Mannarini, G., Turrisi, G., D’Anca, A., Scalas, M., Pinardi, N., Coppini, G., Palermo, F., Carluccio, I., Scuro, M., Cretì, S., Lecci, R., Nassisi, P., and Tedesco, L.: VISIR: technological in-frastructure of an operational service for safe and efficient nav-igation in the Mediterranean Sea, Nat. Hazards Earth Syst. Sci., 16, 1791–1806, doi:10.5194/nhess-16-1791-2016, 2016b. Oddo, P., Adani, M., Pinardi, N., Fratianni, C., Tonani, M., and
Pet-tenuzzo, D.: A nested Atlantic-Mediterranean Sea general circu-lation model for operational forecasting, Ocean Sci., 5, 461–473, doi:10.5194/os-5-461-2009, 2009.
Pinardi, N., Allen, I., Demirov, E., De Mey, P., Korres, G., Las-caratos, A., Le Traon, P.-Y., Maillard, C., Manzella, G., and Tziavos, C.: The Mediterranean ocean forecasting system: first phase of implementation (1998–2001), Ann. Geophys., 21, 3–20, doi:10.5194/angeo-21-3-2003, 2003.
Tonani, M., Pinardi, N., Dobricic, S., Pujol, I., and Fratianni, C.: A high-resolution free-surface model of the Mediterranean Sea, Ocean Sci., 4, 1–14, doi:10.5194/os-4-1-2008, 2008.