Modulation in Gene Expression between Species and in
Different Host Genetic Backgrounds
Daniel P. Depledge1, Krystal J. Evans1, Alasdair C. Ivens2, Naveed Aziz3, Asher Maroof1, Paul M. Kaye1, Deborah F. Smith1*
1Centre for Immunology and Infection, Department of Biology/Hull York Medical School, University of York, York, United Kingdom,2Fios Genomics, ETTC, King’s Buildings, Edinburgh, United Kingdom,3Technology Facility, Department of Biology, University of York, York, United Kingdom
Abstract
Background:Genome sequencing ofLeishmania species that give rise to a range of disease phenotypes in the host has revealed highly conserved gene content and synteny across the genus. Only a small number of genes are differentially distributed between the three species sequenced to date,L. major,L. infantumandL. braziliensis. It is not yet known how many of these genes are expressed in the disease-promoting intracellular amastigotes of these species or whether genes conserved between the species are differentially expressed in the host.
Methods/Principal Findings:We have used customised oligonucleotide microarrays to confirm that all of the differentially distributed genes identified by genome comparisons are expressed in intracellular amastigotes, with only a few of these subject to regulation at the RNA level. In the first large-scale study of gene expression inL. braziliensis, we show that only ,9% of the genes analysed are regulated in their RNA expression during theL. braziliensislife cycle, a figure consistent with that observed in otherLeishmaniaspecies. Comparing amastigote gene expression profiles between species confirms the proposal thatLeishmaniatranscriptomes undergo little regulation but also identifies conserved genes that are regulated differently between species in the host. We have also investigated whether host immune competence influences parasite gene expression, by comparing RNA expression profiles inL. majoramastigotes derived from either wild-type (BALB/c) or immunologically compromised (Rag22/2c
c2/2) mice. While parasite dissemination from the site of infection is enhanced in
the Rag22/2c
c2/2genetic background, parasite RNA expression profiles are unperturbed.
Conclusion/Significance: These findings support the hypothesis that Leishmania amastigotes are pre-adapted for intracellular survival and undergo little dynamic modulation of gene expression at the RNA level. Species-specific parasite factors contributing to virulence and pathogenicity in the host may be limited to the products of a small number of differentially distributed genes or the differential regulation of conserved genes, either of which are subject to translational and/or post-translational controls.
Citation:Depledge DP, Evans KJ, Ivens AC, Aziz N, Maroof A, et al. (2009) Comparative Expression Profiling ofLeishmania: Modulation in Gene Expression between Species and in Different Host Genetic Backgrounds. PLoS Negl Trop Dis 3(7): e476. doi:10.1371/journal.pntd.0000476
Editor:Ben L. Kelly, Louisiana State University, United States of America
ReceivedFebruary 25, 2009;AcceptedJune 2, 2009;PublishedJuly 7, 2009
Copyright:ß2009 Depledge et al. This is an open-access article distributed under the terms of the Creative Commons Attribution License, which permits unrestricted use, distribution, and reproduction in any medium, provided the original author and source are credited.
Funding:DD was supported by a pre-doctoral award from the UK BBSRC (www.bbsrc.ac.uk); KJE is funded by a C.J. Martin Postdoctoral Fellowship from the Australian NH&MRC (443030) (www.nhmrc.gov.au); comparative Leishmania genomics research in the Centre for Immunology and Infection is funded by the Wellcome Trust (grant 076355 to DFS/J. Mottram/PMK)(www.wellcome.ac.uk). The funders had no role in study design, data collection and analysis, decision to publish, or preparation of the manuscript.
Competing Interests:The authors have declared that no competing interests exist. * E-mail: [email protected]
Introduction
Infection with species of the kinetoplastid parasite,Leishmania, results in a spectrum of diseases in man, termed the leishmaniases [1,2]. These range from the non-fatal chronic cutaneous lesions arising from L. major infection to mucocutaneous leishmaniasis usually associated withL. braziliensis(classified within the sub-genus
L. Viannia) and the often fatal visceralising disease, most commonly associated withL. donovaniinfection in the Indian sub-continent,L. chagasiin Brazil andL. infantumin the Mediterranean basin. (The last two species are generally considered to be genetically identical [3]). While the species of infecting parasite can play a defining role in disease type, the genetic background and immune response of
the host are also major factors in determining clinical outcome [4,5,6,7,8,9]. Understanding the relative contribution of these different components may enhance our understanding of patho-genicity in the leishmaniases.
L. donovani complex-specific A2 gene coding for an amastigote protein of as yet unknown function which, when expressed inL. major, leads to increased parasite dissemination to the viscera [11]. Recent expression profiling has identified 3–9% of genes that are modulated at the RNA level between life cycle stages of several
Leishmania species [12,13,14,15]. Moreover, comparisons of L. mexicanaamastigote parasites grown axenically with those main-tained within macrophages, either in vitroorin vivo, have shown that axenic (extracellular) amastigotes are more similar to extracellular promastigotes than to macrophage-derived (intracel-lular) amastigotes in their RNA profiles [12]. These observations emphasise the importance of using parasites isolated ex vivo to investigate the mechanisms of intracellular survival. To date, no comparative expression profiling has been performed onL. Viannia spp., despite the relative divergence of the genome ofL. braziliensis
from that ofL. majororL. infantum[1].
A complicating factor in the analysis ofLeishmaniagene expression is the almost complete absence of defined RNA polymerase II promotors in kinetoplastid species, coupled with the characteristic bidirectional polycistronic transcription units found on individual chromosomes [16,17,18]. In these organisms, polycistronic precur-sor RNAs (which may be expressed constitutively) are processed by coupledtrans-splicing and polyadenylation [19] to generate mature mRNA transcripts for translation. Expression of individual genes is regulated post-transcriptionally, a process largely dependent on RNA stabilisation mechanisms [17,18]. This post-transcriptional regulation, coupled with an as yet unknown extent of regulation at the level of translation, results in variable correlations between gene and protein expression levels [20,21]. Such factors place greater emphasis on identifying those genes which undergo regulation during the life cycle while also looking for differences in the relative levels of expression of conserved genes.
Given the importance of intracellularLeishmaniastages to disease in man, this study has focused on amastigote gene expression, comparing RNA expression profiles between the three sequenced
Leishmaniaspecies to identify any significant differences that may be functionally relevant in these infective parasite stages. To
achieve this end, an oligonucleotide array was designed represen-tative of 4 functional classes of genes, together comprising,10%
of the genome. These targets included (i) all genes identified as differentially-distributed between the 3 sequenced Leishmania
species [1]; (ii) all genes containing amino acid repeats within their open reading frames [22]; (iii) all genes encoding proteins predicted (with high probability) to be co-translationally modified byN-myristoylation [23]; (iv) a range of control genes of known RNA expression profiles.
The rationale for this choice of target genes is that their expressed products provide a subset for analysis as putative targets for therapeutic intervention. 2–4% of the 3 sequenced Leishmania
genomes, including 30% of the differentially-distributed genes, contain amino acid repeats within their protein-coding regions, as identified by the RepSeq web utility [22]. Repeat domains are associated with a range of functions relevant to host survival in other protozoan parasites, including antigenic variation, host-cell receptor binding and intracellular protein-protein interactions inPlasmodium
species [24,25,26]. Amino acid repeat-containing proteins encoded within the Leishmania genomes include several kinases, cysteine peptidases, putative surface antigen proteins and the infective stage-specific HASPB (formerly named GBP), expressed in amastigotes of all L. Leishmania species analysed but absent from L.(Viannia.) braziliensis[1,27,28,29,30]. HASPB is also a target forN -myristoyla-tion, a co-translational protein modification catalysed by the enzymeN-myristoyltransferase (NMT) that is a genetically-validated target forLeishmaniadrug development [31,32].
Hybridisation of these customised oligonucleotide arrays with amastigote RNA derived from footpad lesions (L. major), spleens (L. infantum) and RAW 264.7 macrophages (L. braziliensis) revealed that only a small number of the target genes are differentially expressed at the mRNA level between species and that fewer still are regulated during the parasite life cycle. In addition, comparison of expression profiles derived from L. major amasti-gotes isolated from hosts of differing immune competence (BALB/ c vs. Rag22/2cc2
/2mice [33]) demonstrated that host immune
pressure has little effect on parasite gene expression at the RNA level. Taken as a whole, the data presented here suggest that parasites do not respond dynamically to host immune pressure and that any influence of varying transcript levels on virulence and pathogenicity of differentLeishmaniaspecies is likely to result from the differential expression of conserved genes between species and/or the expression of a small number of genes that are differentially distributed between species.
Materials and Methods
In silico analyses
The three representative Leishmania proteomes (L .major, L. braziliensisandL. infantum) were analysed for the presence of amino acid repeats using default settings at the RepSeq web utility (www. repseq.org; [22]); 256 proteins were identified. A further 62 proteins were predicted to beN-terminally myristoylated with high confidence using the NMT Predictor and Myristoylator programs as described [23]. The genes identified as differentially distributed between the threeLeishmaniaspecies [1] were reanalysed using BLAST and the latest assemblies of the three genomes available at the time on GeneDB (L. major published assembly [10], L. infantum v2 and L. braziliensisv1). 242 of these genes were included in this study (Table S1); the remainder have been removed during annotation revision.
Leishmania culture, differentiation and in vivo infections The three sequenced genome reference strains used wereL. major
MHOM/IL/80/Friedlin;L. infantum clone JPCM5 MCAN/ES/
Author Summary
98/LLM-877;L. braziliensisclone M2904 MHOM/BR/75M2904. Procyclic and metacyclic parasites were maintained at 26uC in pH 7.0 and pH 5.5 media respectively; for L. major and L. braziliensis, 16M199 medium was supplemented with 10% Gibco
fetal bovine serum (FBS, Invitrogen) and penicillin-streptomycin (Invitrogen) and, in the case ofL. braziliensis, 2% human male urine.
L. infantumwas cultured in Gibco HOMEM (Invitrogen) supple-mented with 10% FBS (Biosera) and penicillin-streptomycin. The pH of all media was adjusted using orthophosphoric acid. Metacyclic RNAs were validated by RT-qPCR profiling of the metacyclic specific markers SHERP [34] inL. majorandL. infantum
and Meta1 [35] inL. braziliensis. ForL. major in vivopassage, BALB/c and Rag22/2cc2
/2mice [33,36] were infected sub-cutaneously in
the rear footpad with 46106late stageL. majormetacyclics purified
by Percoll gradient fractionation [37]. Footpad thickness was measured weekly using digital calipers, taking an average of three readings. At four weeks post-infection, mice were euthanized and tissues were sampled for analysis. ForL. infantum in vivopassage, infection was initiated in hamsters by intraperitoneal inoculation of 107stationary phase metacyclics as described [38], with euthanasia and spleen removal 9–12 months later.
BALB/c mice (Charles River Laboratories) and Rag22/2cc2/2
mice (bred in the Centre for Immunology and Infection) were housed in pathogen-free conditions at the University of York. All animal work was conducted under UK Home Office Licence requirements and after institutional ethical review. Attempts to purify amastigotes from the footpads of BALB/c, C57BL/6 and Rag22/2cc2/2mice infected with theL. braziliensisgenome strain
were unsuccessful (despite establishment of lymph nodes infections with the same parasites), so Percoll-purified metacyclics were used to infect RAW 264.7 macrophages maintained in DMEM medium supplemented with 10% FBS, l-glutamine and sodium pyruvate (1 mM final concentrations). Amastigotes were obtained from infected macrophages after 3 days culture at 34uC. For all species, infections were initiated with parasites that had been recently passagedin vivoto reduce any impact of long termin vitro
culture on parasite gene expression and virulence.
Amastigote isolation and protein analysis
Infected tissues were homogenised and fractionated (centrifu-gation at 100 g, 4uC) to remove larger debris. Host cells in the resulting supernatant were pelleted (2000 g, 4uC) and treated with 0.05% w/v saponin (Sigma Aldrich) for lysis and release of amastigotes. Host cell debris was removed by layering parasites over Percoll (1.037 g/ml) and centrifugation at 2000 g, 4uC for 1 hr. Amastigote yields were assessed using a haemocytometer and Beckman Z Series Coulter Counter. Parasite species was verified by restriction fragment length polymorphism analysis of amasti-gote DNA [39].
For immunoblotting, 56106 host-derived amastigotes were pelleted, washed in PBS and resuspended in an SDS load mix supplemented with Pepstatin A (50 ug/ml). Treatment with 3%b -mercaptoethanol was followed by a 10 min incubation at 95uC prior to 12% SDS-PAGE, electroblotting on immobilon-P membrane (Millipore) and probing with anti-HASPB [40,41] at 1:1250 dilution and anti-NMT [31] at 1:1000, as previously described. ECL Western Blotting Detection Reagents (GE Healthcare Lifesciences) were used in conjunction with a G:BOX Chemi Imaging System and GeneSnap V.7.0 software (Syngene) to determine relative expression of detected proteins.
Analysis of parasite burdens
L. major parasite burdens in mouse footpad lesions were determined by purification and manual counting while those in
the liver and spleen tissues were assessed from duplicate samples using quantitative PCR, adapted from the method of [42]. DNA was extracted from tissues using a DNeasy Blood and Tissue kit (Qiagen) following overnight digestion with Proteinase K at 55uC. Quantitation of L. major DNA was performed using primers specific for a 116-bp fragment of the kinetoplastid minicircle DNA: forward, 59-CCTATTTTACACCAACCCCCAGT-39(JW11) and reverse, 59-GGGTAGGGGCGTTCTGCGAAA-39 (JW12) [43]. DNA standards were created for each tissue sampled, by spiking naı¨ve tissue with known numbers ofL. majorpromastigotes and extracting the DNA as described above. For RT-qPCR reactions, samples were analysed using Power SYBR Green PCR Master Mix and an ABI 7300 sequence analyzer (Applied Biosystems). Samples were subjected to an initial holding step at 95uC for 10 min, followed by an amplification step (40 cycles of 95uC for 15 sec and 60uC for 1 min) and a single dissociation step of 95uC for 15 sec, 60uC for 20 sec and 95uC for 15 sec. The total parasite burden per organ was calculated by determining the total number of parasites per g of tissue sampled and multiplying by total organ mass.
RNA isolation, cDNA synthesis and labelling
Amastigote pellets were resuspended in TRIzol Reagent (Invitrogen) at a concentration of 1 ml/108cells and total RNA extracted using the protocol provided. Extracted RNA was purified using a MEGAclear kit (Ambion) and the quantity and quality verified using a NanoDrop ND-1000 Spectrophotometer and Agilent 2100 Bioanalyzer, respectively, prior to storage at 280uC. cDNA synthesis and subsequent labelling was performed using the Amino Allyl cDNA labeling kit (Ambion) and Alexa Flour 555 and 647 dyes (Invitrogen).
DNA oligonucleotide array design, slide printing, washing and pre-hybridisation
70-mer oligonucleotides were designed and synthesised by Operon Biotechnologies using parameters such that a single oligo had .90% identity with the gene target in each of the three species but,70% identity with any other gene on the array. All oligos (Table S2) were BLAST-searched against the NCBI databases for the mouse and hamster genomes, to minimise potential cross hybridisation. The microarrays were printed on Nexterion Slides E (Schott) using a QArrayMini (Genetix) as follows: 5 replicates were printed for each probe in a random pattern totalling 5376 probes per slide (including buffer and negative controls). cDNA from procyclic RNA from each of the three species was hybridised against the arrays for quality control, revealing that all probes were hybridised (data not shown). Prior to hybridisation, each slide was washed at room temperature as follows: 165 min in 0.1% Triton X-100, 262 min in 1 mM HCL, 1610 min in 100 mM KCL. Slides were subsequently blocked by
incubation in 16Nexterion Blocking E (Schott) for 15 min and
then dried by centrifugation.
Microarray hybridisation and signal detection
Labelled cDNA pellets were resuspended in Nexterion Hyb and hybridised on the slides in Corning hybridisation chambers (Fisher) for 16 hrs at 45uC. The slides were then washed in 26Sodium Chloride Citrate (SSC)/0.1% sodium dodecyl sulphate
(SDS) for 5 min, 26SSC for a further 5 min, 0.26SSC for 5 min
Data processing and statistical analysis
For each slide, flags were automatically assigned to each probe and manually evaluated, based on the quality of hybridisation, to assist in normalisation within and between arrays. All raw data extracted from GenePix were imported into R 2.2.1 for normalization and statistical analysis using the Bioconductor packages (www.bioconductor.org), predominantly Limma. Briefly, gpr files were read and background correction performed using the Kooperberg model. QC analysis, entailing density distribution analysis coupled with correlation distance heatmap plotting, was used to identify substandard arrays, which were removed from further analysis. Array data were normalised within arrays using printtiploess, followed by normalisa-tion between arrays using the ‘‘Aquantile’’ method, which normalises intensity distribution across all slides. Subsequently, the mean intensity was determined for the 5 replicate spots on each array prior to single channel linear modelling and contrast fitting of non-control array features, with eBayes methods to generate moderated t-statistics. Four contrasts were performed:L. braziliensisprocyclics vs. metacyclics vs. amastigotes, L. major amastigotes vs. procyclics,L. infantum amastigotes vs. procyclics and L. major amastigotes from BALB/c mice vs.L. majoramastigotes from Rag22/2cc2/2mice.
Gene lists were generated, with accompanying statistics, from the eBayes fit data. The decideTests method was applied, with an adjust p value threshold of 0.01, to classify genes as to their significance in one of more contrasts. A fold change of 1.7 was then used as threshold for determining differentially expressed genes, similar to other recent studies [13,14,20]. In accordance with MIAME (Minimum Information About a Microarray Experiments) regulations [44], all data were deposited into ArrayExpress database [45] at www.ebi.ac.uk under the accession number E-MEXP-2063.
For host-derived amastigote analysis, a minimum of 3 biological replicates (each comprising 2–3 technical replicates) per species were used. 2–3 technical replicates were also used for each of the following analyses: culture-derived amastigotes, metacyclics and procyclics
Quantitative real-time PCR (RT-qPCR)
RT-qPCR was performed on selected genes to validate the microarray data, using 1–2 biological replicates (independent of those used on the arrays). cDNA was synthesised using the Omniscript RT Kit (Qiagen) . Cross-species primers were designed by aligning gene sequences using CLUSTALW (http://align. genome.jp/) and then selecting primers based on the output of Primaclade [46]. Each biological sample was run with 4–5 technical replicates. Data generated were analysed [47] and normalised using a range of suitable targets (including published controls; [14,35,48]). All primers used are shown in Table S3.
Results/Discussion
Previous expression profiling studies, using arrays of varying size and composition, have revealed that the transcriptomes of fourL. Leishmaniaspecies (L. major, L. infantum, L. donovani and L mexicana; [12,13,14,15,49,50,51]) are largely expressed at constitutive levels during the parasite life cycle, with only a limited number of genes (,10% of the genome) showing significant evidence of regulation (fold change.1.7, p,0.05) at the mRNA level. No data have yet been presented on global expression profiles of anyL. Viannia spp, nor has there been an investigation into the potential influence of immune pressure on parasite gene expression in the host.
The custom microarrays used in this study targeted 785 genes representing ,10% of the genome of the 3 target Leishmania
species, L. major, L. infantum and L. braziliensis. Following
hybridisation, a total of 46 genes were selected from the arrays for validation of their RNA expression profiles by RT-qPCR. These included a number of previously-characterised stage-regulated and constitutively-expressed genes across all three species. In total, 74% (17/23) of the L. braziliensis genes tested for their expression across the parasite life cycle showed good correlation between RNA levels detected by RT-qPCR and microarray analysis (Table 1). A further 8 out of 9 targets from the cross-species comparison and 12 out of 14 targets selected from the study of host immune pressure onL. majorgene expression were also validated by comparison of RT-qPCR and microarray data (Table 1). In most cases, the observed fold changes were comparable between the microarray and RT-qPCR data although in some instances, larger differences between the two methods of analysis were measured. This trend has been reported in similar studies [12,14] and is likely to be due to the increased sensitivity and specificity of RT-qPCR against single gene targets.
Only a small number of the genes analysed are regulated in their expression during theL. braziliensislifecycle
Expression profiles were generated for eachL. braziliensislife cycle stage using mRNA from culture-derived procyclics and metacyclics and RAW 264.7 macrophage-derived amastigotes. The profiles were analysed using scatter plots (Figure 1A–C), revealing that,9%
(60/678) of the genes probed were significantly regulated (fold change.1.7, p-value,0.05) in their expression between life cycle stages. Thus, although the arrays used for this analysis of L. braziliensisgene expression represent only 10% of the genome (and are biased towards specific gene subsets), the proportion of stage-regulated genes (,9%) is of the same order of magnitude as that
observed in whole genome analysis ofL. major (7%), L. mexicana
(3.5%) andL. infantum(9.3%) [12,14].
Of the 60 regulated genes inL. braziliensis(Table 2, Figure 2), 5 were preferentially expressed in amastigotes (LbrM05_V2.0380 -microtubule-associated protein, LbrM07_V2.0360 - ATP-depen-dent DEAD/H RNA helicase, LbrM09_V2.0960 - calmodulin, LbrM11_V2.0560 - 40S ribosomal protein S21 and LbrM31_ V2.2570 - 39 nucleotidase/nuclease) with a further 35 preferen-tially expressed in metacyclics and 11 in procyclics. Analysis of the specific gene subsets identified none of the NMT targets as upregulated in amastigotes while 5 of these genes showed preferential expression in either procyclics and/or metacyclics. 9.8% (25/256) of the genes coding for proteins containing amino acid repeats showed stage specific regulation, with 3 of these encoding proteins of unknown function that are preferentially expressed in the procyclic and metacyclic stages (as compared with amastigotes). Interestingly, all of the genes preferentially expressed inL. braziliensisamastigotes in this analysis, with the exception of the calmodulin array, contain repeat motifs. If these RNA differences correlate with protein levels, this result could indicate that repeat-containing proteins are functionally important in the intracellular stage of the life cycle and provide a useful sub-set of biomarkers with diagnostic and vaccination potential.
Cross species comparison of amastigote RNA expression Pair-wise comparisons of amastigote RNA profiles for each of the three species identified only a small number of conserved genes showing differential expression. Varying numbers of probes were directly comparable between the species (as some genes are present in two rather than three species) including 608 betweenL. braziliensis
These analyses were used to identify genes showing significantly increased amastigote expression in one species compared with the other two (Table 3). Five genes were identified as showing significantly increased expression in L. braziliensis amastigotes: 2 genes with predicted functions (LbrM08_V2.0810 - cathepsin L-like protease, LbrM25_V2.1020 and LbrM35_V2.3370 - ADP-ribosy-lation factor) and 3 genes of unknown function (LbrM06_V2.0730, LbrM20_V2.0550 and LbrM21_V2.0910). A further 5 genes showed significantly increased expression in L. major amastigotes, 4 of which code for proteins of predicted functions (LmjF06.0400 -Fructose biphosphate aldolase, LmjF24.1730 - protein kinase, LmjF31.0830 - Triacyglycerol lipase, LmjF36.5370- tyrosine specific protein phosphatase) while the last codes for an unknown protein (LmjF31.1400). A total of 15 genes showed significantly increased expression inL. infantumamastigotes alone, including 10 coding for proteins of unknown function (LinJ05_V3.0670, LinJ07_V3.0270, LinJ07_V3.0950, LinJ10_V3.1230, LinJ13_V3.0770, LinJ14_V3.0470, LinJ18_V3.1160, LinJ24_V3.1530, LinJ29_V3.0110 and LinJ31_V3.1470). and 5 for proteins of predicted function (LinJ12_v4.0671 – surface antigen protein, LinJ04_V3.0320 - mitochondrial exoribonuclease DSS-1, LinJ11_V3.0400 - tubulin-tyrosine ligase-like protein, LinJ31_V3.1490 - surface membrane protein gp46-like protein
and the proteophosphoglycan ppg3 array on chromosome 35 (chromosome 34 in L. braziliensis). Interestingly, gp46 has also been identified as an upregulated gene inL. donovaniamastigotes derived from patients with PKDL (post-kala azar dermal leishmaniasis; [52]).
The ppg3 gene is located within an array of related sequences (still undergoing refinement of annotation due to their repetitive structure) on chromosome 35 ofLeishmania species and codes for one of the glycoprotein constituents of filamentous proteophosphoglycan (fPPG), a major component of promastigote secretory gel (PSG). PSG is produced by parasites within the gut of the sandfly vector, where it contributes to a physical blockage that promotes host blood-feeding and subsequent parasite transmission [53,54]. TheLeishmania
PPGs belong to a novel class of serine- and threonine-rich proteins possessing large conserved Ala-Pro-Ser repeats that represent major antigenic determinants in all Leishmania species examined to date [53,55,56]. These repeats are extensively modified by phosphodie-ster-linked oligosaccharides and terminal manno-oligosaccharides, while the modified PPGs are either water soluble and secreted or membrane-bound. PPGs are expressed in both promastigotes and amastigotes, localising to the flagellar pocket, endosomes, lysosomes and the external surface of the parasite [57,58,59]. Surface PPGs are important in parasite-macrophage interactions: they apparently bind
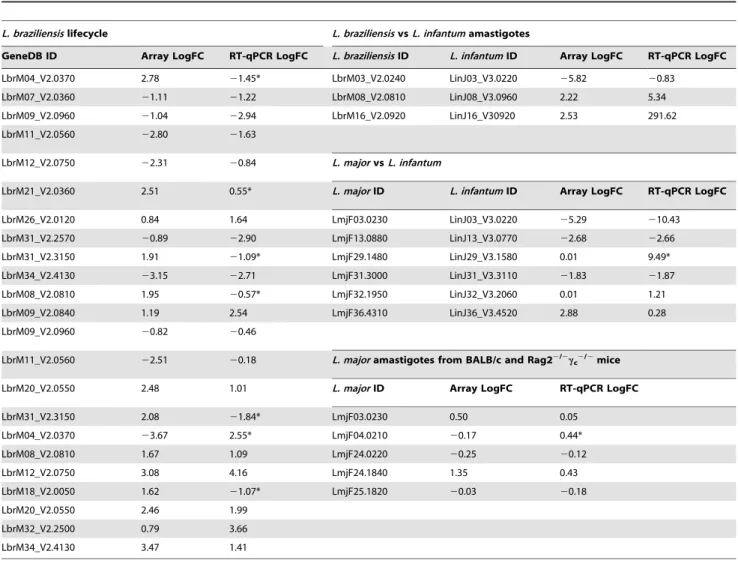
Table 1.Validation of microarray data by quantitative RT-PCR (RT-qPCR).
L. braziliensislifecycle L. braziliensisvsL. infantumamastigotes
GeneDB ID Array LogFC RT-qPCR LogFC L. braziliensisID L. infantumID Array LogFC RT-qPCR LogFC
LbrM04_V2.0370 2.78 21.45* LbrM03_V2.0240 LinJ03_V3.0220 25.82 20.83
LbrM07_V2.0360 21.11 21.22 LbrM08_V2.0810 LinJ08_V3.0960 2.22 5.34
LbrM09_V2.0960 21.04 22.94 LbrM16_V2.0920 LinJ16_V30920 2.53 291.62
LbrM11_V2.0560 22.80 21.63
LbrM12_V2.0750 22.31 20.84 L. majorvsL. infantum
LbrM21_V2.0360 2.51 0.55* L. majorID L. infantumID Array LogFC RT-qPCR LogFC
LbrM26_V2.0120 0.84 1.64 LmjF03.0230 LinJ03_V3.0220 25.29 210.43
LbrM31_V2.2570 20.89 22.90 LmjF13.0880 LinJ13_V3.0770 22.68 22.66
LbrM31_V2.3150 1.91 21.09* LmjF29.1480 LinJ29_V3.1580 0.01 9.49*
LbrM34_V2.4130 23.15 22.71 LmjF31.3000 LinJ31_V3.3110 21.83 21.87
LbrM08_V2.0810 1.95 20.57* LmjF32.1950 LinJ32_V3.2060 0.01 1.21
LbrM09_V2.0840 1.19 2.54 LmjF36.4310 LinJ36_V3.4520 2.88 0.28
LbrM09_V2.0960 20.82 20.46
LbrM11_V2.0560 22.51 20.18 L. majoramastigotes from BALB/c and Rag22/2
cc2/2mice
LbrM20_V2.0550 2.48 1.01 L. majorID Array LogFC RT-qPCR LogFC
LbrM31_V2.3150 2.08 21.84* LmjF03.0230 0.50 0.05
LbrM04_V2.0370 23.67 2.55* LmjF04.0210 20.17 0.44*
LbrM08_V2.0810 1.67 1.09 LmjF24.0220 20.25 20.12
LbrM12_V2.0750 3.08 4.16 LmjF24.1840 1.35 0.43
LbrM18_V2.0050 1.62 21.07* LmjF25.1820 20.03 20.18
LbrM20_V2.0550 2.46 1.99
LbrM32_V2.2500 0.79 3.66
LbrM34_V2.4130 3.47 1.41
*
RT-qPCR data does not validate microarray data; LogFC represents2log2(fold change); ID, each ID refers to the GeneDB gene entry.
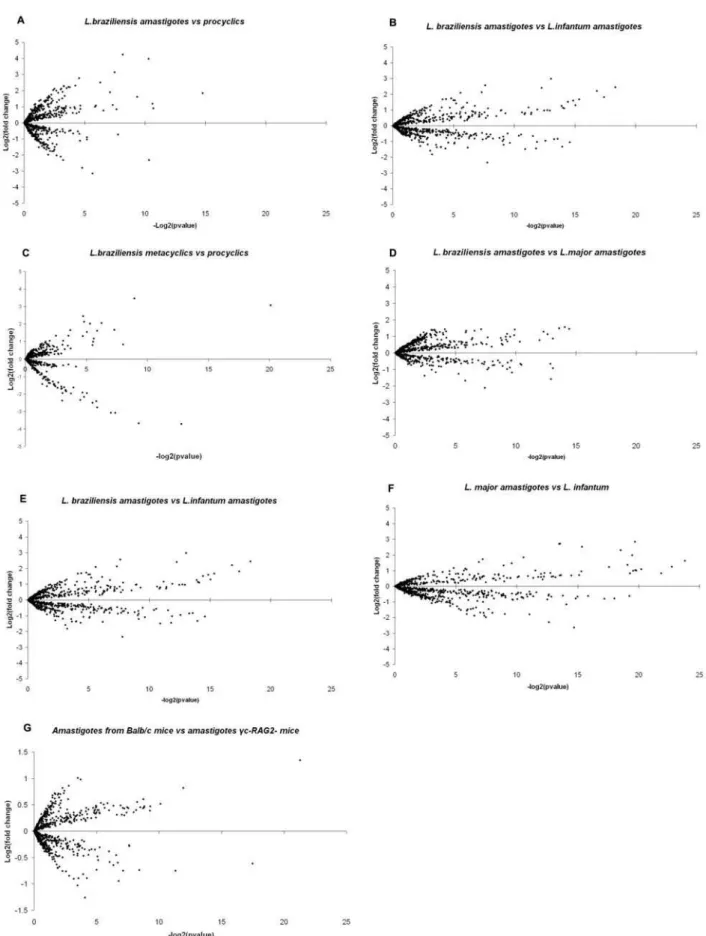
Figure 1. Expression profiling of gene subsets from threeLeishmaniagenomes.Scatter plots (generated using Microsoft Excel) show the distribution of log2fold changes in RNA expression levels against their statistical significance (2log2p-value) for up to 785 genes per genome. Fold
change of.1.7 between data points (dashed horizontal lines); significant p-value,0.05 (dashed vertical lines). (A)L. braziliensisamastigotes vs. procyclics; (B)L. braziliensisamastigotes vs. metacyclics; (C)L. braziliensismetacyclics vs. procyclics; amastigotes of (D)L. braziliensisvs.L. major, (E)L. braziliensisvs.L. infantum, (F)L. majorvs.L. infantum; (G)L. majoramastigotes from BALB/c vs. Rag22/2c
c2/2mice.
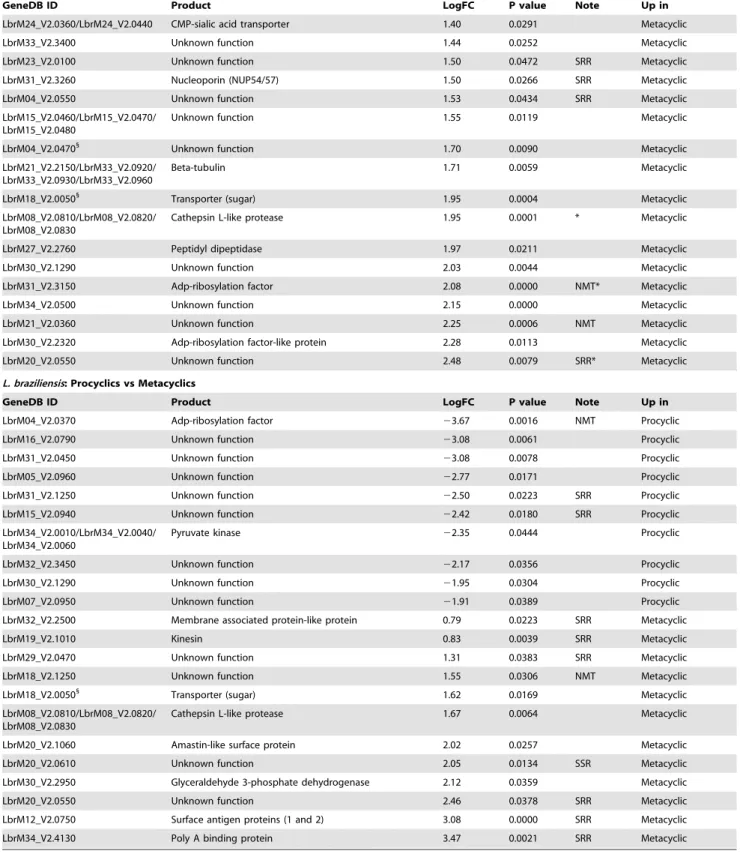
Table 2.Genes differentially expressed during theL. braziliensislifecycle.
L. braziliensis: Amastigotes vs. Procyclics
GeneDB ID Product LogFC P value Note Up in
LbrM34_V2.4130 Poly A binding protein 23.15 0.0197 SRR* Amastigote
40S ribosomal protein S21 22.80 0.0359 SRR* Amastigote
LbrM12_V2.0750 Surface antigen proteins (1 and 2) 22.31 0.0008 SRR* Amastigote
LbrM07_V2.0360 ATP-dependent DEAD/H RNA helicase 21.11 0.0405 SRR* Amastigote
LbrM09_V2.0960/LbrM09_V2.0970/ LbrM09_V2.0980
Calmodulin 21.04 0.0274 * Amastigote
LbrM31_V2.25701
39nucleotidase/nuclease 20.89 0.0272 * Amastigote
LbrM26_V2.0120 Adenine phosphoribosyltransferase 0.84 0.0050 * Procyclic
LbrM22_V2.14101
Unknown function 0.86 0.0398 Procyclic
LbrM27_V2.13501
Carboxypeptidase 0.99 0.0172 Procyclic
LbrM33_V2.0190 Unknown function 1.08 0.0397 Procyclic
LbrM11_V2.0160 Unknown function 1.08 0.0163 Procyclic
LbrM20_V2.4280 Unknown function 1.11 0.0062 Procyclic
LbrM12_V2.0750 Surface antigen proteins (1 and 2) 1.20 0.0006 SRR Procyclic
LbrM34_V2.0500 Unknown function 1.84 0.0000 Procyclic
LbrM31_V2.3150 Adp-ribosylation factor 1.91 0.0073 NMT* Procyclic
LbrM21_V2.0360 Unknown function 2.51 0.0126 NMT* Procyclic
LbrM04_V2.0370 Adp-ribosylation factor 2.78 0.0425 NMT* Procyclic
LbrM30_V2.1290 Unknown function 3.98 0.0008 Procyclic
LbrM31_V2.0450 Unknown function 4.25 0.0035 Procyclic
L. braziliensis: Amastigotes vs. Metacyclics
GeneDB ID Product LogFC P value Note Up in
LbrM11_V2.0560 40S ribosomal protein S21 22.51 0.0034 SRR* Amastigote
LbrM12_V2.075011
Surface antigen proteins (1 and 2) 22.08 0.0215 SRR Amastigote
LbrM05_V2.0380 Microtubule-associated protein 21.11 0.0454 Amastigote
LbrM09_V2.0960/LbrM09_V2.0970/ LbrM09_V2.0980
Calmodulin 20.82 0.0063 * Amastigote
LbrM34_V2.0360 Serine palmitoyltransferase 0.82 0.0184 Metacyclic
LbrM04_V2.1260 Surface antigen-like protein 0.86 0.0252 SRR Metacyclic
LbrM27_V2.13501
Carboxypeptidase 0.86 0.0014 Metacyclic
LbrM33_V2.0190 Unknown function 0.90 0.0071 Metacyclic
LbrM19_V2.1010 Kinesin 0.91 0.0001 SRR Metacyclic
LbrM35_V2.5860 G-actin binding protein 0.91 0.0269 Metacyclic
LbrM11_V2.0160 Unknown function 0.96 0.0010 Metacyclic
LbrM08_V2.1090/LbrM08_V2.1080/ LbrM08_V2.1100
Amastin-like protein 0.98 0.0033 Metacyclic
LbrM34_V2.5330 Unknown function 0.99 0.0107 Metacyclic
LbrM07_V2.0890 Unknown function 1.11 0.0253 Metacyclic
LbrM20_V2.4280 Unknown function 1.11 0.0000 Metacyclic
LbrM33_V2.1190 Unknown function 1.17 0.0037 Metacyclic
LbrM24_V2.1790 Protein kinase 1.18 0.0068 NMT Metacyclic
LbrM04_V2.0590 Unknown function 1.18 0.0075 Metacyclic
LbrM09_V2.0840 Unknown function 1.19 0.0005 SRR* Metacyclic
LbrM06_V2.0760 RNA-binding protein-like pr 1.20 0.0016 SRR Metacyclic
LbrM25_V2.0950 Unknown function 1.28 0.0035 SRR Metacyclic
LbrM22_V2.14101
Unknown function 1.30 0.0000 Metacyclic
LbrM07_V2.0550 Unknown function 1.30 0.0006 Metacyclic
LbrM28_V2.31801
Unknown function 1.32 0.0224 Metacyclic
L. braziliensis: Amastigotes vs. Metacyclics
GeneDB ID Product LogFC P value Note Up in
LbrM24_V2.0360/LbrM24_V2.0440 CMP-sialic acid transporter 1.40 0.0291 Metacyclic
LbrM33_V2.3400 Unknown function 1.44 0.0252 Metacyclic
LbrM23_V2.0100 Unknown function 1.50 0.0472 SRR Metacyclic
LbrM31_V2.3260 Nucleoporin (NUP54/57) 1.50 0.0266 SRR Metacyclic
LbrM04_V2.0550 Unknown function 1.53 0.0434 SRR Metacyclic
LbrM15_V2.0460/LbrM15_V2.0470/ LbrM15_V2.0480
Unknown function 1.55 0.0119 Metacyclic
LbrM04_V2.04701
Unknown function 1.70 0.0090 Metacyclic
LbrM21_V2.2150/LbrM33_V2.0920/ LbrM33_V2.0930/LbrM33_V2.0960
Beta-tubulin 1.71 0.0059 Metacyclic
LbrM18_V2.00501
Transporter (sugar) 1.95 0.0004 Metacyclic
LbrM08_V2.0810/LbrM08_V2.0820/ LbrM08_V2.0830
Cathepsin L-like protease 1.95 0.0001 * Metacyclic
LbrM27_V2.2760 Peptidyl dipeptidase 1.97 0.0211 Metacyclic
LbrM30_V2.1290 Unknown function 2.03 0.0044 Metacyclic
LbrM31_V2.3150 Adp-ribosylation factor 2.08 0.0000 NMT* Metacyclic
LbrM34_V2.0500 Unknown function 2.15 0.0000 Metacyclic
LbrM21_V2.0360 Unknown function 2.25 0.0006 NMT Metacyclic
LbrM30_V2.2320 Adp-ribosylation factor-like protein 2.28 0.0113 Metacyclic
LbrM20_V2.0550 Unknown function 2.48 0.0079 SRR* Metacyclic
L. braziliensis: Procyclics vs Metacyclics
GeneDB ID Product LogFC P value Note Up in
LbrM04_V2.0370 Adp-ribosylation factor 23.67 0.0016 NMT Procyclic
LbrM16_V2.0790 Unknown function 23.08 0.0061 Procyclic
LbrM31_V2.0450 Unknown function 23.08 0.0078 Procyclic
LbrM05_V2.0960 Unknown function 22.77 0.0171 Procyclic
LbrM31_V2.1250 Unknown function 22.50 0.0223 SRR Procyclic
LbrM15_V2.0940 Unknown function 22.42 0.0180 SRR Procyclic
LbrM34_V2.0010/LbrM34_V2.0040/ LbrM34_V2.0060
Pyruvate kinase 22.35 0.0444 Procyclic
LbrM32_V2.3450 Unknown function 22.17 0.0356 Procyclic
LbrM30_V2.1290 Unknown function 21.95 0.0304 Procyclic
LbrM07_V2.0950 Unknown function 21.91 0.0389 Procyclic
LbrM32_V2.2500 Membrane associated protein-like protein 0.79 0.0223 SRR Metacyclic
LbrM19_V2.1010 Kinesin 0.83 0.0039 SRR Metacyclic
LbrM29_V2.0470 Unknown function 1.31 0.0383 SRR Metacyclic
LbrM18_V2.1250 Unknown function 1.55 0.0306 NMT Metacyclic
LbrM18_V2.00501
Transporter (sugar) 1.62 0.0169 Metacyclic
LbrM08_V2.0810/LbrM08_V2.0820/ LbrM08_V2.0830
Cathepsin L-like protease 1.67 0.0064 Metacyclic
LbrM20_V2.1060 Amastin-like surface protein 2.02 0.0257 Metacyclic
LbrM20_V2.0610 Unknown function 2.05 0.0134 SSR Metacyclic
LbrM30_V2.2950 Glyceraldehyde 3-phosphate dehydrogenase 2.12 0.0359 Metacyclic
LbrM20_V2.0550 Unknown function 2.46 0.0378 SRR Metacyclic
LbrM12_V2.0750 Surface antigen proteins (1 and 2) 3.08 0.0000 SRR Metacyclic
LbrM34_V2.4130 Poly A binding protein 3.47 0.0021 SRR Metacyclic
GeneDB ID, gene accession number on GeneDB (http://www.genedb.org/);Product, predicted gene function (annotation from GeneDB);LogFC, log2fold change
observed between compared RNAs in array studies;P value, measure of statistical significance (p,0.05 is statistically significant);Note, indicates whether gene is from a specific subset (SSR – amino acid repeat containing gene, NMT – target forN-myristoylation); * indicates where array data are validated by qPCR (see Table 4);Up in, indicates species or lifecycle stage with increased expression of target gene.1
annotated as a pseudogene in GeneDB. doi:10.1371/journal.pntd.0000476.t002
to host cells to modulate macrophage function during early infection, both by inhibiting tumor necrosis factor-aproduction and synergiz-ing with interferon-cto stimulate the production of nitric oxide [60]. The significance of increased RNA expression from the PPG gene array inL. infantumamastigotes (as compared withL. majorandL. braziliensisamastigotes) is unknown; no studies have yet investigated theL. infantum PPGs or addressed whether one or more of these molecules might perform a species-specific role in establishing and maintaining amastigotes within host macrophages.
Calmodulin, the ubiquitous eukaryotic intracellular calcium receptor, plays a role in the regulation of many cellular proteins and transmembrane ion transporters with wide-ranging down-stream physiological consequences. Calmodulin is encoded by a 3-gene array on chromosome 9 inLeishmania but has not yet been widely studied in this organism, despite linkage to the modulation of a plasma membrane Ca2+-ATPase inL. donovani[61]. In this present
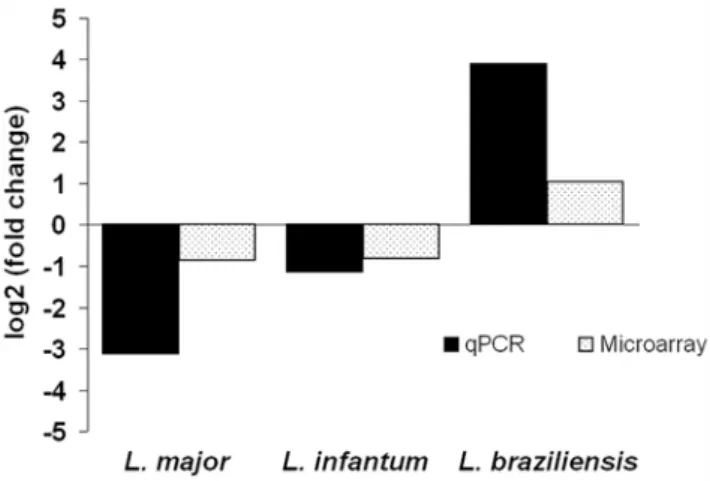
study, both the array analyses and subsequent RT-qPCRs show decreased abundance of calmodulin transcripts in amastigotes ofL. majorand L. infantumas compared with procyclic and metacyclic parasites. This correlates with the observed changes in calmodulin protein duringin vitrodifferentiation ofL. donovani[62]. By contrast, calmodulin transcript levels are upregulated in L. braziliensis
amastigotes (Figure 4). To date, it is unclear whether these RNA differences reflect mRNAs derived from one or several of the gene copies, nor how this distribution might vary between the species. It is also unknown whether the varying RNA levels correlate with protein expression in L. braziliensis and how this might influence calmodulin function in different amastigote populations.
Genes differentially distributed between the three representativeLeishmania species are usually constitutively expressed
The small number of differentially distributed genes identified by comparative genomic analysis of L. major, L. infantum and L. braziliensis [1] include several well-characterised stage specific genes that are implicated in vector transmission and virulence in
the host (e.g. A2, HASPB, SHERP [11,34,63]. The expression profiles for the ,200 differentially distributed genes were
determined from the L. braziliensis life cycle analysis generated here and supplemented with published microarray data generated from life cycle studies ofL. majorandL. infantum[12,14] (Table S1). These cumulative results have confirmed that all genes differen-tially distributed between the three species are expressed in all life cycle stages. Only 34 of these sequences are regulated between stages, however: 19 in L. major, 9 in L. infantum and 6 in L. braziliensis. The majority of these genes encode proteins of unknown function while the remainder are the HASPA, HASPB and SHERP genes fromL. Leishmaniaspecies as well as an adenine phosphoribosyltransferase (LbrM26_V2.0120) and a unique gene family inL. braziliensis(LbrM23_V2.1110 and LbrM23_V2.1120) and theL. infantumspecific LinJ22_V3.0670.
Leishmaniatranscriptomes undergo little regulation but the conserved genes that are regulated vary between species Previous comparisons of the life cycle expression profiles ofL. major,L. infantumandL. mexicanahave revealed similar numbers of
Figure 3. Differential expression of amastigote genes between
Leishmaniaspecies.Venn diagrams showing pairwise comparisons of amastigote RNA expression from the three targetLeishmaniaspecies; the number of genes with increased expression (.1.7-fold, p,0.05) in each species is indicated. *Genes that show no significant difference in expression between species.
doi:10.1371/journal.pntd.0000476.g003 Figure 2. Distribution of genes preferentially expressed in one
or more stages ofL. braziliensis.Venn diagram showing distribution of upregulated genes (.1.7 fold, p,0.05) in stages of theL. braziliensis
life cycle. 8.8% (60/678) of the genes probed are regulated in their expression by these criteria, with 58% of these showing increased expression during the metacyclic stage. *Genes that are not differen-tially expressed between these stages.
genes that are regulated during the life cycle [12,13,14]. The most interesting observation associated with these data is that, while these regulated genes are conserved between all three species, whether they are regulated or not appears to be a species-specific property. As an example of this, only 114/1228 of the conserved regulated genes ofL. majorandL. infantumundergo modulation in both species [14]. A similar effect has been observed in comparisons betweenL. majorandL. mexicanapromastigote RNA expression profiles [12]. In this current study, of the 21 genes identified as being stage regulated inL. braziliensis(Table S5), 14 are only regulated in this species while 6 share regulation with eitherL. majororL. infantumand one, a 39-nucleotidase/nuclease, is regulated in all three species and shows upregulation in
amastigotes [12,14]. Leishmania parasites are purine auxotrophs and require mechanisms to salvage these essential nutrients from the sandfly gut and the host [64,65,66]. The 39-nucleotidase/nuclease [67] degrades and dephosphorylates exogenous purine sources to nucleosides that can be transported across the plasma membrane [67]. Independent studies inL. donovani[68] andL. mexicana[69] have shown that 39-nucleotidase/nuclease mRNA transcripts are upregulated in promastigotes when parasites are starved of purines but not in amastigotes. One interpretation of these conflicting observations could be that there are additional gene copies expressing nucleotidase/nuclease activity during the parasite life cycle. The complete list of all regulated genes identified in L. braziliensis,L. majorandL. infantumis presented in Table S5.
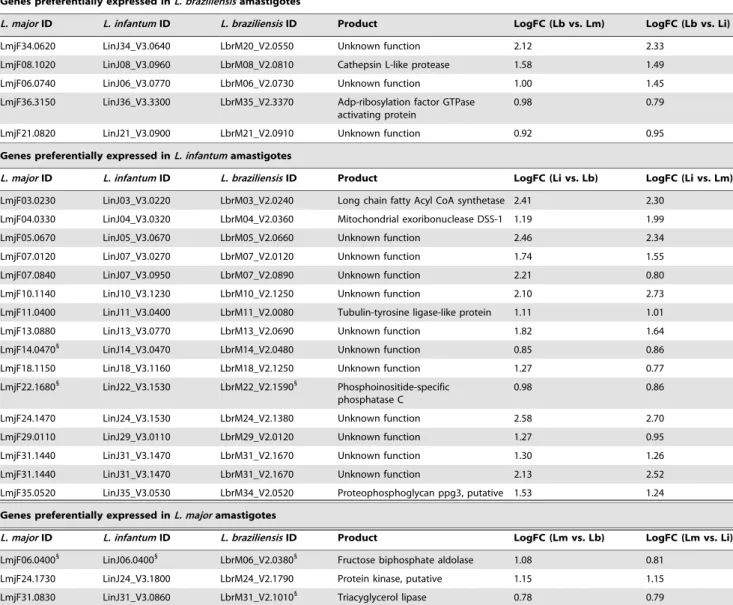
Table 3.Conserved genes preferentially expressed in amastigotes.
Genes preferentially expressed inL. braziliensisamastigotes
L. majorID L. infantumID L. braziliensisID Product LogFC (Lb vs. Lm) LogFC (Lb vs. Li)
LmjF34.0620 LinJ34_V3.0640 LbrM20_V2.0550 Unknown function 2.12 2.33
LmjF08.1020 LinJ08_V3.0960 LbrM08_V2.0810 Cathepsin L-like protease 1.58 1.49
LmjF06.0740 LinJ06_V3.0770 LbrM06_V2.0730 Unknown function 1.00 1.45
LmjF36.3150 LinJ36_V3.3300 LbrM35_V2.3370 Adp-ribosylation factor GTPase activating protein
0.98 0.79
LmjF21.0820 LinJ21_V3.0900 LbrM21_V2.0910 Unknown function 0.92 0.95
Genes preferentially expressed inL. infantumamastigotes
L. majorID L. infantumID L. braziliensisID Product LogFC (Li vs. Lb) LogFC (Li vs. Lm)
LmjF03.0230 LinJ03_V3.0220 LbrM03_V2.0240 Long chain fatty Acyl CoA synthetase 2.41 2.30 LmjF04.0330 LinJ04_V3.0320 LbrM04_V2.0360 Mitochondrial exoribonuclease DSS-1 1.19 1.99
LmjF05.0670 LinJ05_V3.0670 LbrM05_V2.0660 Unknown function 2.46 2.34
LmjF07.0120 LinJ07_V3.0270 LbrM07_V2.0120 Unknown function 1.74 1.55
LmjF07.0840 LinJ07_V3.0950 LbrM07_V2.0890 Unknown function 2.21 0.80
LmjF10.1140 LinJ10_V3.1230 LbrM10_V2.1250 Unknown function 2.10 2.73
LmjF11.0400 LinJ11_V3.0400 LbrM11_V2.0080 Tubulin-tyrosine ligase-like protein 1.11 1.01
LmjF13.0880 LinJ13_V3.0770 LbrM13_V2.0690 Unknown function 1.82 1.64
LmjF14.04701
LinJ14_V3.0470 LbrM14_V2.0480 Unknown function 0.85 0.86
LmjF18.1150 LinJ18_V3.1160 LbrM18_V2.1250 Unknown function 1.27 0.77
LmjF22.16801
LinJ22_V3.1530 LbrM22_V2.15901
Phosphoinositide-specific phosphatase C
0.98 0.86
LmjF24.1470 LinJ24_V3.1530 LbrM24_V2.1380 Unknown function 2.58 2.70
LmjF29.0110 LinJ29_V3.0110 LbrM29_V2.0120 Unknown function 1.27 0.95
LmjF31.1440 LinJ31_V3.1470 LbrM31_V2.1670 Unknown function 1.30 1.26
LmjF31.1440 LinJ31_V3.1470 LbrM31_V2.1670 Unknown function 2.13 2.52
LmjF35.0520 LinJ35_V3.0530 LbrM34_V2.0520 Proteophosphoglycan ppg3, putative 1.53 1.24
Genes preferentially expressed inL. majoramastigotes
L. majorID L. infantumID L. braziliensisID Product LogFC (Lm vs. Lb) LogFC (Lm vs. Li)
LmjF06.04001
LinJ06.04001
LbrM06_V2.03801
Fructose biphosphate aldolase 1.08 0.81
LmjF24.1730 LinJ24_V3.1800 LbrM24_V2.1790 Protein kinase, putative 1.15 1.15
LmjF31.0830 LinJ31_V3.0860 LbrM31_V2.10101
Triacyglycerol lipase 0.78 0.79
LmjF31.1400 LinJ31_V3.1430 LbrM31_V2.1560 Unknown function 1.44 0.80
LmjF36.5370 LinJ36_V3.5610 LbrM35_V2.5630 Tyrosine specific protein phosphatase 1.50 0.77
ID, gene accession number on GeneDB (http://www.genedb.org/);Product, predicted gene function (GeneDB annotation);LogFC, log2fold change observed
between compared RNAs in array studies. Lb,L. braziliensis; Lm,L. major; Li,L. infantum.1
Host immune pressure reduces parasite dissemination and survival in the viscera but does not influence parasite RNA expression profiles
The influence of host immune pressure on gene expression in
Leishmania has not been studiedin vivoto our knowledge. In this study, parasite burdens, lesion development, and parasite gene expression profiles were examined in immunocompetent BALB/c and immunocompromised Rag22/2cc2/2 mice which have a
mixed genetic background of 129 Ola, BALB/c and C57BL/6 [33]. These latter mice possess a mutation in the common c-chain receptor (a component of the receptors for IL-2, -4, -7, -9 and -15) and in the recombination activating gene 2 (Rag2; required for V(J)D rearrangement) and are characterised by a complete absence of mature T lymphocytes, B lymphocytes and NK cells [33].
Footpad infections were established by inoculation with 46106
metacyclicL. major parasites and resultant lesion formation was measured at weekly intervals. The Rag22/2cc2
/2mice displayed
no signs of inflammation in the footpad and did not develop cutaneous lesions. In contrast, vigorous lesion development was seen in BALB/c mice with a greater than 2-fold increase in footpad thickness at one month post-infection (Figure 5A). Parasite burdens in the footpads of Rag22/2cc2
/2mice were significantly
Figure 4. Calmodulin RNA expression is upregulated in amastigotes ofL. braziliensis.Comparison of amastigote RNA levels by both microarray and RT-qPCR analysis demonstrates increased expression from the chromosome 9 calmodulin gene array in L. braziliensis but decreased expression inL. major and L. infantum. 2 independent biological replicates were used to generate data from each species.
doi:10.1371/journal.pntd.0000476.g004
Figure 5. Comparison ofL. majorinfections in BALB/c and Rag22/2
cc2/2mice.Groups of 5 mice of each strain were inoculated withL. major purified metacyclics and infections monitored over a 4 week period as described (Materials and Methods). (A) Lesion development (footpad thickness); (B) parasite burdens in footpad lesions after 4 weeks; (C) parasite burdens in spleen after 4 weeks; (D) parasite burdens in liver after 4 weeks. The data presented are representative of two independent studies; error bars represent the standard error of the mean and the * indicates a significant difference (p,0.05) as determined by Students t-test (unpaired).
lower than in the BALB/c mice; however these immunocompro-mised mice showed 2.5-fold higher parasite burdens in the liver and spleen (Figure 5B–D). Enhanced parasite burdens in visceral organs may arise from accelerated dissemination of parasites through the lymphatic system from the site of infection, as Rag22/
2c
c2/2 mice lack peripheral lymph nodes. In addition, survival
and proliferation of parasites may be increased in these tissues due to the inability of Rag22/2cc2/2mice to mount protective T and
B cell dependant responses required for parasite clearance. Expression profiling of the amastigotes taken from the footpads of these mouse strains revealed only 3 genes that showed a significant difference in expression (out of 700 genes on the array). Only one of these genes (LmjF06.0720, coding for a protein of unknown function) was preferentially expressed in amastigotes from BALB/c mice. The other 2 genes showed increased expression in the Rag22/2cc2/2mice: LmjF24.1840, a
lysopho-spholipase and LmjF35.4730, another ‘‘unknown’’ gene (Table 4). Independent analysis of HASPB transcript and protein abundance in these amastigotes (by RT-qPCR and immunoblotting respec-tively) revealed no significant differences in expression (Figure 6). This lack of amastigote RNA modulation, assuming that it correlates with protein expression levels, confirms thatLeishmania
parasites are pre-adapted toward intracellular survival, regardless of the state of the host immune system. These data are of relevance
to our interpretation of the cross-species amastigote expression results (Table 3) given that the amastigotes were sourced from rodents of different genetic backgrounds.
Concluding remarks
Small microarrays, targeted towards 9% of the genes conserved between the three representative Leishmania species and an additional ,250 genes differentially distributed between these
species, were designed and hybridised with host-derived amasti-gote RNA isolated from cutaneous lesions (L. major), spleens (L. infantum) and RAW 264.7 macrophages (L. braziliensis).,9% of the
probed genes were identified as being regulated during the L. braziliensislife cycle, a figure comparable to that observed using whole genome arrays for L. major, L. mexicana and L. infantum
[12,14]. It is interesting to note however, that while most regulated genes are conserved between all three representative species, the majority of genes regulated in one species are not regulated in the others. Moreover, comparative expression profiles generated forL. major, L. infantum and L. braziliensis amastigotes revealed that species-specific differential regulation of conserved genes was common and this may impact on parasite survival in the host. These species-specific differences require further study that should focus on determining whether relative protein abundances are affected by increased transcript abundances. Attempts to correlate
Table 4.Genes differentially expressed inL. majoramastigotes from different host genetic backgrounds.
GeneDB ID Product LogFC P.Value Note Up in
LmjF06.0720 Unknown function 20.95 0.0091 SRR* Balb/c amastigotes
LmjF24.1840 Lysophospholipase 1.35 0.0000 * Rag22/2c
c2/2amastigotes
LmjF35.47301
Unknown function 0.82 0.0003 * Rag22/2
cc2/2amastigotes
GeneDB ID, gene accession number on GeneDB (http://www.genedb.org/);Product, predicted gene function (annotation from GeneDB);LogFC, log2fold change
observed between compared RNAs in array studies;P value, measure of statistical significance;Note, indicates whether gene is from a specific subset (SSR – amino acid repeat containing gene, NMT – target forN-myristoylation); *indicates where array data are validated by qPCR (see Table 4);Up in, indicates host with increased expression of target gene.1
annotated as a pseudogene in GeneDB. doi:10.1371/journal.pntd.0000476.t004
Figure 6. HASPB RNA and protein abundance inL. majoramastigotes isolated from BALB/c and Rag22/2
cc2/2mice.Amastigotes isolated from the livers of two mice of each strain (BALB/c and Rag22/2cc2/2mice), 4 weeks post-infection withL. major(see Figure 5), were used for
RNA and protein extraction, as described. HASPB expression was analysed by (A) RT-qPCR for RNA and (B) immunoblotting with anti-HASPB for protein (L. majorHASPB migrates at 38.5 kDa (black arrow); NMT, at 50 kDa (white arrow)). NMT was used as a constitutive control for both RNA and protein expression levels.
the relative abundance of mRNA and protein for individual genes in L. infantum amastigotes resulted in only modest agreement (,53% [21]), with these differences attributed to the extensive
post-transcriptional, translational and post-translational regulation operating in Leishmania parasites [13,21]. Finally, the lack of modulation of gene expression profiles in L. major parasites responding to different immune pressures is consistent with the hypothesis that Leishmania parasites are constitutively adapted toward survival in a range of hosts [20].
Supporting Information
Table S1 List of genes differentially distributed between three
Leishmaniaspecies with microarray analysis derived from this study or ref [14].
Found at: doi:10.1371/journal.pntd.0000476.s001 (0.06 MB XLS)
Table S2 All 70-mer oligonucleotides used in the microarray
studies reported in Depledge et al., 2009.
Found at: doi:10.1371/journal.pntd.0000476.s002 (0.13 MB XLS)
Table S3 List of primers used in qPCR validation of microarray data.
Found at: doi:10.1371/journal.pntd.0000476.s003 (0.10 MB PDF)
Table S4 Genes differentially expressed between amastigotes of
threeLeishmaniaspecies.
Found at: doi:10.1371/journal.pntd.0000476.s004 (0.14 MB PDF)
Table S5 Leishmaniagenes demonstrating stage regulation in one or more species.
Found at: doi:10.1371/journal.pntd.0000476.s005 (0.14 MB PDF)
Acknowledgments
We thank the following: Angela Cruz for discussion ofL. braziliensisRNA extraction methods; Jim Hilley and Jeremy Mottram for provision ofL. infantum amastigotes; Mark Coles for supply of Rag22/2c
c2/2 mice; University of York BSF staff for breeding and technical support; Rachel Curwen and other members of the Smith lab for technical help and discussion.
Author Contributions
Conceived and designed the experiments: DPD NA PMK DFS. Performed the experiments: DPD KJE AM. Analyzed the data: DPD KJE ACI DFS. Contributed reagents/materials/analysis tools: NA AM. Wrote the paper: DPD KJE ACI DFS.
References
1. Murray HW, Berman JD, Davies CR, Saravia NG (2005) Advances in leishmaniasis. Lancet 366: 1561–1577.
2. Peacock CS, Seeger K, Harris D, Murphy L, Ruiz JC, et al. (2007) Comparative genomic analysis of three Leishmania species that cause diverse human disease. Nat Genet 39: 839–847.
3. Mauricio IL, Stothard JR, Miles MA (2000) The strange case of Leishmania chagasi. Parasitol Today 16: 188–189.
4. Guerbouj S, Guizani I, Speybroeck N, Le Ray D, Dujardin JC (2001) Genomic polymorphism of Leishmania infantum: a relationship with clinical pleomor-phism? Infect Genet Evol 1: 49–59.
5. McMahon-Pratt D, Alexander J (2004) Does the Leishmania major paradigm of pathogenesis and protection hold for New World cutaneous leishmaniases or the visceral disease? Immunol Rev 201: 206–224.
6. Wilson ME, Jeronimo SM, Pearson RD (2005) Immunopathogenesis of infection with the visceralizing Leishmania species. Microb Pathog 38: 147–160. 7. BenSaid M, Guerbouj S, Saghrouni F, Fathallah-Mili A, Guizani I (2006)
Occurrence of Leishmania infantum cutaneous leishmaniasis in central Tunisia. Trans R Soc Trop Med Hyg 100: 521–526. Epub 2005 Dec 2013. 8. Lipoldova M, Demant P (2006) Genetic susceptibility to infectious disease:
lessons from mouse models of leishmaniasis. Nat Rev Genet 7: 294–305. 9. Smith DF, Peacock CS, Cruz AK (2007) Comparative genomics: From genotype
to disease phenotype in the leishmaniases. Int J Parasitol 37: 1173–1186. Epub 2007 Jun 1123.
10. Ivens AC, Peacock CS, Worthey EA, Murphy L, Aggarwal G, et al. (2005) The genome of the kinetoplastid parasite, Leishmania major. Science 309: 436–442. 11. Zhang WW, Mendez S, Ghosh A, Myler P, Ivens A, et al. (2003) Comparison of the A2 gene locus in Leishmania donovani and Leishmania major and its control over cutaneous infection. J Biol Chem 278: 35508–35515.
12. Holzer TR, McMaster WR, Forney JD (2006) Expression profiling by whole-genome interspecies microarray hybridization reveals differential gene expres-sion in procyclic promastigotes, leexpres-sion-derived amastigotes, and axenic amastigotes in Leishmania mexicana. Mol Biochem Parasitol 146: 198–218. 13. Leifso K, Cohen-Freue G, Dogra N, Murray A, McMaster WR (2007) Genomic
and proteomic expression analysis of Leishmania promastigote and amastigote life stages: the Leishmania genome is constitutively expressed. Mol Biochem Parasitol 152: 35–46.
14. Rochette A, Raymond F, Ubeda JM, Smith M, Messier N, et al. (2008) Genome-wide gene expression profiling analysis of Leishmania major and Leishmania infantum developmental stages reveals substantial differences between the two species. BMC Genomics 9: 255.
15. Saxena A, Lahav T, Holland N, Aggarwal G, Anupama A, et al. (2007) Analysis of the Leishmania donovani transcriptome reveals an ordered progression of transient and permanent changes in gene expression during differentiation. Mol Biochem Parasitol 152: 53–65.
16. El-Sayed NM, Myler PJ, Blandin G, Berriman M, Crabtree J, et al. (2005) Comparative genomics of trypanosomatid parasitic protozoa. Science 309: 404–409.
17. Clayton C, Shapira M (2007) Post-transcriptional regulation of gene expression in trypanosomes and leishmanias. Mol Biochem Parasitol 156: 93–101. 18. Haile S, Papadopoulou B (2007) Developmental regulation of gene expression in
trypanosomatid parasitic protozoa. Curr Opin Microbiol 10: 569–577.
19. Liang XH, Haritan A, Uliel S, Michaeli S (2003) trans and cis splicing in trypanosomatids: mechanism, factors, and regulation. Eukaryot Cell 2: 830–840. 20. Cohen-Freue G, Holzer TR, Forney JD, McMaster WR (2007) Global gene
expression in Leishmania. Int J Parasitol 37: 1077–1086.
21. McNicoll F, Drummelsmith J, Muller M, Madore E, Boilard N, et al. (2006) A combined proteomic and transcriptomic approach to the study of stage differentiation in Leishmania infantum. Proteomics 6: 3567–3581.
22. Depledge DP, Lower RP, Smith DF (2007) RepSeq–a database of amino acid repeats present in lower eukaryotic pathogens. BMC Bioinformatics 8: 122. 23. Mills E, Price HP, Johner A, Emerson JE, Smith DF (2007) Kinetoplastid PPEF
phosphatases: dual acylated proteins expressed in the endomembrane system of Leishmania. Mol Biochem Parasitol 152: 22–34.
24. Rosenthal PJ (2004) Cysteine proteases of malaria parasites. Int J Parasitol 34: 1489–1499.
25. Tetteh KK, Cavanagh DR, Corran P, Musonda R, McBride JS, et al. (2005) Extensive antigenic polymorphism within the repeat sequence of the Plasmodium falciparum merozoite surface protein 1 block 2 is incorporated in a minimal polyvalent immunogen. Infect Immun 73: 5928–5935.
26. Scherf A, Lopez-Rubio JJ, Riviere L (2008) Antigenic variation in Plasmodium falciparum. Annu Rev Microbiol 62: 445–470.
27. Alce TM, Gokool S, McGhie D, Stager S, Smith DF (1999) Expression of hydrophilic surface proteins in infective stages of Leishmania donovani. Mol Biochem Parasitol 102: 191–196.
28. McKean PG, Trenholme KR, Rangarajan D, Keen JK, Smith DF (1997) Diversity in repeat-containing surface proteins of Leishmania major. Mol Biochem Parasitol 86: 225–235.
29. Nugent PG, Karsani SA, Wait R, Tempero J, Smith DF (2004) Proteomic analysis of Leishmania mexicana differentiation. Mol Biochem Parasitol 136: 51–62.
30. Rangarajan D, Gokool S, McCrossan MV, Smith DF (1995) The gene B protein localises to the surface of Leishmania major parasites in the absence of metacyclic stage lipophosphoglycan. J Cell Sci 108(Pt 11): 3359–3366. 31. Price HP, Menon MR, Panethymitaki C, Goulding D, McKean PG, et al. (2003)
Myristoyl-CoA:Protein N-Myristoyltransferase, an Essential Enzyme and Potential Drug Target in Kinetoplastid Parasites. J Biol Chem 278: 7206–7214. 32. Gelb MH, Van Voorhis WC, Buckner FS, Yokoyama K, Eastman R, et al. (2003) Protein farnesyl and N-myristoyl transferases: piggy-back medicinal chemistry targets for the development of antitrypanosomatid and antimalarial therapeutics. Molecular and Biochemical Parasitology 126: 155–163. 33. Goldman JP, Blundell MP, Lopes L, Kinnon C, Di Santo JP, et al. (1998)
Enhanced human cell engraftment in mice deficient in RAG2 and the common cytokine receptor gamma chain. Br J Haematol 103: 335–342.
34. Knuepfer E, Stierhof YD, McKean PG, Smith DF (2001) Characterization of a differentially expressed protein that shows an unusual localization to intracellular membranes in Leishmania major. Biochem J 356: 335–344.
35. Gamboa D, Van Eys G, Victoir K, Torres K, Adaui V, et al. (2007) Putative markers of infective life stages in Leishmania (Viannia) braziliensis. Parasitology 134: 1689–1698.
chain double mutants–requiring exogenous cytokine administration for human hematopoietic stem cell engraftment. J Interferon Cytokine Res 19: 533–541. 37. Ahmed S, Colmenares M, Soong L, Goldsmith-Pestana K, Munstermann L, et
al. (2003) Intradermal infection model for pathogenesis and vaccine studies of murine visceral leishmaniasis. Infect Immun 71: 401–410.
38. Denise H, Poot J, Jimenez M, Ambit A, Herrmann DC, et al. (2006) Studies on the CPA cysteine peptidase in the Leishmania infantum genome strain JPCM5. BMC Mol Biol 7: 42.
39. Schonian G, Nasereddin A, Dinse N, Schweynoch C, Schallig HD, et al. (2003) PCR diagnosis and characterization of Leishmania in local and imported clinical samples. Diagn Microbiol Infect Dis 47: 349–358.
40. Flinn HM, Rangarajan D, Smith DF (1994) Expression of a hydrophilic surface protein in infective stages of Leishmania major. Mol Biochem Parasitol 65: 259–270.
41. Denny PW, Gokool S, Russell DG, Field MC, Smith DF (2000) Acylation-dependent protein export in Leishmania. J Biol Chem 275: 11017–11025. 42. Nicolas L, Prina E, Lang T, Milon G (2002) Real-time PCR for detection and
quantitation of leishmania in mouse tissues. J Clin Microbiol 40: 1666–1669. 43. Nicolas L, Sidjanski S, Colle JH, Milon G (2000) Leishmania major reaches
distant cutaneous sites where it persists transiently while persisting durably in the primary dermal site and its draining lymph node: a study with laboratory mice. Infect Immun 68: 6561–6566.
44. Brazma A, Hingamp P, Quackenbush J, Sherlock G, Spellman P, et al. (2001) Minimum information about a microarray experiment (MIAME)-toward standards for microarray data. Nat Genet 29: 365–371.
45. Parkinson H, Kapushesky M, Shojatalab M, Abeygunawardena N, Coulson R, et al. (2007) ArrayExpress–a public database of microarray experiments and gene expression profiles. Nucleic Acids Res 35: D747–750.
46. Gadberry MD, Malcomber ST, Doust AN, Kellogg EA (2005) Primaclade–a flexible tool to find conserved PCR primers across multiple species. Bioinfor-matics 21: 1263–1264.
47. Pfaffl MW (2001) A new mathematical model for relative quantification in real-time RT-PCR. Nucleic Acids Res 29: e45.
48. Ouakad M, Bahi-Jaber N, Chenik M, Dellagi K, Louzir H (2007) Selection of endogenous reference genes for gene expression analysis in Leishmania major developmental stages. Parasitol Res 101: 473–477.
49. Akopyants NS, Matlib RS, Bukanova EN, Smeds MR, Brownstein BH, et al. (2004) Expression profiling using random genomic DNA microarrays identifies differentially expressed genes associated with three major developmental stages of the protozoan parasite Leishmania major. Mol Biochem Parasitol 136: 71–86. 50. Almeida R, Gilmartin BJ, McCann SH, Norrish A, Ivens AC, et al. (2004) Expression profiling of the Leishmania life cycle: cDNA arrays identify developmentally regulated genes present but not annotated in the genome. Mol Biochem Parasitol 136: 87–100.
51. Saxena A, Worthey EA, Yan S, Leland A, Stuart KD, et al. (2003) Evaluation of differential gene expression in Leishmania major Friedlin procyclics and metacyclics using DNA microarray analysis. Mol Biochem Parasitol 129: 103–114.
52. Salotra P, Duncan RC, Singh R, Subba Raju BV, Sreenivas G, et al. (2006) Upregulation of surface proteins in Leishmania donovani isolated from patients of post kala-azar dermal leishmaniasis. Microbes Infect 8: 637–644. Epub 2006 Jan 2011.
53. Rogers ME, Ilg T, Nikolaev AV, Ferguson MA, Bates PA (2004) Transmission of cutaneous leishmaniasis by sand flies is enhanced by regurgitation of fPPG. Nature 430: 463–467.
54. Bates PA (2008) Leishmania sand fly interaction: progress and challenges. Curr Opin Microbiol 11: 340–344. Epub 2008 Jul 2025.
55. Montgomery J, Ilg T, Thompson JK, Kobe B, Handman E (2000) Identification and predicted structure of a leucine-rich repeat motif shared by Leishmania major proteophosphoglycan and Parasite Surface Antigen 2. Mol Biochem Parasitol 107: 289–295.
56. Samant M, Sahasrabuddhe AA, Singh N, Gupta SK, Sundar S, et al. (2007) Proteophosphoglycan is differentially expressed in sodium stibogluconate-sensitive and resistant Indian clinical isolates of Leishmania donovani. Parasitology 134: 1175–1184.
57. Ilg T, Craik D, Currie G, Multhaup G, Bacic A (1998) Stage-specific proteophosphoglycan from Leishmania mexicana amastigotes. Structural characterization of novel mono-, di-, and triphosphorylated phosphodiester-linked oligosaccharides. J Biol Chem 273: 13509–13523.
58. Ilg T, Montgomery J, Stierhof YD, Handman E (1999) Molecular cloning and characterization of a novel repeat-containing Leishmania major gene, ppg1, that encodes a membrane-associated form of proteophosphoglycan with a putative glycosylphosphatidylinositol anchor. J Biol Chem 274: 31410–31420. 59. Foth B, Piani A, Curtis JM, Ilg T, McConville M, et al. (2002) Leishmania major
proteophosphoglycans exist as membrane-bound and soluble forms and localise to the cell membrane, the flagellar pocket and the lysosome. Int J Parasitol 32: 1701–1708.
60. Piani A, Ilg T, Elefanty AG, Curtis J, Handman E (1999) Leishmania major proteophosphoglycan is expressed by amastigotes and has an immunomodula-tory effect on macrophage function. Microbes Infect 1: 589–599.
61. Mazumder S, Mukherjee T, Ghosh J, Ray M, Bhaduri A (1992) Allosteric modulation of Leishmania donovani plasma membrane Ca(2+)-ATPase by endogenous calmodulin. J Biol Chem 267: 18440–18446.
62. Rosenzwieg D, Smith D, Oppordoes F, Stern S, Olafson RW, Zilberstein D (2008) Retooling Leishmania metabolism: from sand fly gut to human macrophage. FASEB J 22(2): 590–602.
63. McKean PG, Denny PW, Knuepfer E, Keen JK, Smith DF (2001) Phenotypic changes associated with deletion and overexpression of a stage-regulated gene family in Leishmania. Cell Microbiol 3: 511–523.
64. Hammond DJ, Gutteridge WE (1984) Purine and pyrimidine metabolism in the Trypanosomatidae. Mol Biochem Parasitol 13: 243–261.
65. Hassan HF, Coombs GH (1986) A comparative study of the purine- and pyrimidine-metabolising enzymes of a range of trypanosomatids. Comp Biochem Physiol B 84: 219–223.
66. Steiger RF, Steiger E (1977) Cultivation of Leishmania donovani and Leishmania braziliensis in defined media: nutritional requirements. J Protozool 24: 437–441.
67. Gottlieb M (1989) The surface membrane 39-nucleotidase/nuclease of trypanosomatid protozoa. Parasitol Today 5: 257–260.
68. Debrabant A, Gottlieb M, Dwyer DM (1995) Isolation and characterization of the gene encoding the surface membrane 39-nucleotidase/nuclease of Leish-mania donovani. Mol Biochem Parasitol 71: 51–63.