RESEARCH ARTICLE
The
Arabidopsis
SWI2/SNF2 Chromatin
Remodeler BRAHMA Regulates Polycomb
Function during Vegetative Development and
Directly Activates the Flowering Repressor
Gene
SVP
Chenlong Li1,2, Chen Chen1,2, Lei Gao3, Songguang Yang4, Vi Nguyen1, Xuejiang Shi5, Katherine Siminovitch5, Susanne E. Kohalmi2, Shangzhi Huang6, Keqiang Wu7, Xuemei Chen3,8, Yuhai Cui1,2*
1Agriculture and Agri-Food Canada, Southern Crop Protection and Food Research Centre, London, Ontario, Canada,2Department of Biology, Western University, London, Ontario, Canada,3Department of Botany and Plant Sciences, Institute of Integrative Genome Biology, University of California Riverside, Riverside, California, United States of America,4Key Laboratory of Plant Resources Conservation and Sustainable Utilization, South ChinaBotanical Garden, Chinese Academy of Sciences, Guangzhou,
Guangdong, China,5Clinical Genomics Centre, The UHN/MSH Gene Profiling Facility Mount Sinai Hospital, Toronto, Ontario, Canada,6School of Life Sciences, Guangdong Provincial Key Laboratory of Plant Resource, Sun Yat-sen University, Guangzhou, Guangdong, China,7Institute of Plant Biology, College of Life Science, National Taiwan University, Taipei, Taiwan,8Howard Hughes Medical Institute, University of California Riverside, Riverside, California, United States of America
*yuhai.cui@agr.gc.ca
Abstract
The chromatin remodeler BRAHMA (BRM) is a Trithorax Group (TrxG) protein that antago-nizes the functions of Polycomb Group (PcG) proteins in fly and mammals. Recent studies also implicate such a role forArabidopsis(Arabidopsis thaliana) BRM but the molecular mechanisms underlying the antagonism are unclear. To understand the interplay between BRM and PcG during plant development, we performed a genome-wide analysis of tri-methylated histone H3 lysine 27 (H3K27me3) in brm mutant seedlings by chromatin immu-noprecipitation followed by next generation sequencing (ChIP-seq). Increased H3K27me3 deposition at several hundred genes was observed in brm mutants and this increase was partially supressed by removal of the H3K27 methyltransferase CURLY LEAF (CLF) or SWINGER (SWN). ChIP experiments demonstrated that BRM directly binds to a subset of the genes and prevents the inappropriate association and/or activity of PcG proteins at these loci. Together, these results indicate a crucial role of BRM in restricting the inappropri-ate activity of PcG during plant development. The key flowering repressor geneSHORT VEGETATIVE PHASE(SVP) is such a BRM target. In brm mutants, elevated PcG occupancy atSVPaccompanies a dramatic increase in H3K27me3 levels at this locus and a concomi-tant reduction ofSVPexpression. Further, our gain- and loss-of-function genetic evidence establishes that BRM controls flowering time by directly activatingSVPexpression. This
OPEN ACCESS
Citation:Li C, Chen C, Gao L, Yang S, Nguyen V, Shi X, et al. (2015) TheArabidopsisSWI2/SNF2 Chromatin Remodeler BRAHMA Regulates Polycomb Function during Vegetative Development and Directly Activates the Flowering Repressor Gene
SVP. PLoS Genet 11(1): e1004944. doi:10.1371/ journal.pgen.1004944
Editor:Daniel Schubert, Heinrich Heine University, UNITED STATES
Received:February 24, 2014
Accepted:December 10, 2014
Published:January 23, 2015
Copyright:© 2015 Li et al. This is an open access article distributed under the terms of theCreative Commons Attribution License, which permits unrestricted use, distribution, and reproduction in any medium, provided the original author and source are credited.
work reveals a genome-wide functional interplay between BRM and PcG and provides new insights into the impacts of these proteins in plant growth and development.
Author Summary
In flowering plants, the proper transition from vegetative growth to flowering is critical for their reproductive success and must be controlled precisely. Multiple genes have been shown to regulate the floral transition in response to environmental and endogenous cues. Among them isSHORT VEGETATIVE PHASE(SVP), a key flowering repressor gene in
Arabidopsis. SVPis highly expressed during the vegetative phase to promote growth, but
the mechanism by which the high expression level ofSVPis maintained remains un-known. Here, we report a genome-wide study to examine the functional interplay between the BRM chromatin remodeler and the PcG proteins that catalyze trimethylation of lysine 27 on histone H3 (H3K27me3), a histone mark normally associated with transcriptionally repressed genes. We identify BRM as a direct upstream activator ofSVP. BRM acts to keep the levels of H3K27me3 low at theSVPlocus by inhibiting the binding and activities of the PcG proteins. Thus, our work identifies a previously unknown mechanism in regulation of flowering time and demonstrates the power of genome-wide approaches in dissecting reg-ulatory networks controlling plant development.
Introduction
Plant development takes place in distinct phases, each of which is characterized by the activa-tion of a particular set of genes and the repression of others. Precise control of gene expression in each phase is crucial for proper growth and development. The transition from the vegetative to the reproductive phase is controlled precisely by multiple genetic pathways in response to environmental and endogenous signals [1–4]. InArabidopsis, a repressor complex that consists of two MADS box transcription factors, FLOWERING LOCUS C (FLC) and SVP, serves as a negative regulator of flowering time by directly repressing the expression of the floral pathway
integratorsFLOWERING LOCUS T(FT) andSUPPRESSOR OF OVEREXPRESSION OF CO 1
(SOC1) [1,5,6].SVPis highly expressed during the vegetative phase [5,7], but is down-regulated during the floral transition by the autonomous and gibberellin (GA) pathways [5], which re-sults in the de-repression ofFTandSOC1to promote flowering. Despite its key role in control-ling flowering time, the mechanisms by whichSVPexpression is regulated are still unknown. Particularly, no positive regulator(s) ofSVPexpression in the vegetative phase have
been identified.
Polycomb Group (PcG) proteins are epigenetic repressors that maintain the repressed state of genes in cells where the genes should be inactive [8–11]. PcG proteins repress genes through combined activities of at least two multi-protein complexes known as Polycomb Repressive Complex 1 (PRC1) and PRC2 [8]. PRC2 is involved in the establishment and maintenance of the repressed chromatin state, by introducing the H3K27me3 mark. Subsequently, PRC1 binds to the H3K27me3 mark and compacts the chromatin, resulting in the repressed state of PcG target genes. InArabidopsis, at least three forms of PRC2 complexes exist and each of them acts at specific developmental phases [12–15]. CLF and SWINGER (SWN) are two putative H3K27 methyltransferases and act redundantly during the vegetative and reproductive stages [16]. Several thousands ofArabidopsisgenes were reported to carry the H3K27me3 mark in
young seedlings [17–19]. A fraction of PcG target genes was found to carry the H3K27me3 mark specifically in either the shoot apical meristem or leaf cells [18], suggesting dynamic regu-lation of H3K27me3 deposition. Studies have been carried out to address how PcG proteins de-posit H3K27me3 to target genes [12,13,20]. It is less known, however, about the mechanisms by which PcG activities are prevented from targeting certain genes to keep these genes on at particular developmental phases.
SWI/SNF-type chromatin-remodeling protein complexes are thought to utilize energy from ATP hydrolysis to mobilize, disrupt or change nucleosomes to create an open chromatin struc-ture for the access of transcriptional factors or other regulators [21,22]. The SWI2/SNF2 ATPase inDrosophila, BRM, was initially classified as a Trithorax group (TrxG) protein since it activates the transcription of homeotic genes and thus antagonizes the function of PcG dur-ing fly development [23,24]. However, recent studies indicate that it can either activate or re-press target gene exre-pression, through increasing or decreasing the accessibility of the target DNA [24–26], yet its role in the regulation of gene expression is not well understood. Although the biochemical activities of plant SWI/SNF complexes have not been examined, progress has been made to identify the plant SWI/SNF complexes through genetic and molecular analysis [27–30]. InArabidopsis, four SWI2/SNF2 ATPases including BRM and SPLAYED (SYD), four SWI3 proteins (SWI3A to SWI3D), two SWI/SNF ASSOCIATED PROTEINS 73 (SWP73A and SWP73B), two ACTIN RELATED PROTEINS (ARP4 and ARP7), and a single SNF5 sub-unit termed BUSHY (BSH) were predicted subsub-units of SWI/SNF complexes [27]. Previousin
vitroprotein-protein interaction data [28,31] and a recent effort in protein complex
purifica-tion followed by peptide sequencing [32] suggest that these proteins could form several SWI/ SNF complexes. Subunits ofArabidopsisSWI/SNF complex(es) play crucial roles in many as-pects of plant development [26,27,33–36]. The SWP73B (also called BAF60) subunit has been shown to participate in the control of flowering time [37]. The SWI3C protein is involved in gibberellin (GA) responses [38].brmmutants show pleiotropic phenotypes, such as reduced plant size [28,39], downward curling of leaves [28,33], mild floral homeotic defects [28,34], hypersensitivity to abscisic acid [26] and early flowering [33,39,40]. Efforts have been made to understand the reason whybrmmutants show an early flowering phenotype [40], but the pre-cise role of BRM in flowering time control is still not clear.
Although the roles of PcG proteins and BRM during plant development have been investi-gated individually, how their activities are coordinated is poorly understood. Interestingly, a re-cent report inArabidopsisshowed that loss of BRM activity led to the increased H3K27me3 at two floral homeotic genes [34], suggesting the antagonistic relationship between BRM and PcG. However, the current model is solely based on the characterization of a few identified tar-gets of BRM, and it remains unknown to what extent BRM is required for antagonizing PcG function in plant. Also the precise mechanism by which BRM antagonizes PcG activity during plant development remains unclear. Finally, whether or not plant BRM might work synergisti-cally with PcG proteins is completely unknown. To address these questions, we have performed a genome-wide analysis of H3K27me3 inbrmmutant seedlings by chromatin immunoprecipi-tation followed by next generation sequencing (ChIP-seq). We identify several hundred genes that show increased levels of H3K27me3 upon loss of BRM activity, demonstrating the critical role of BRM in preventing genes from H3K27me3-mediated repression in plant cells. We fur-ther show that fur-there is inappropriate invasion of PcG proteins. Finally, by taking advantage of our genome-wide data, we uncover a role for BRM in repressing flowering by activating direct-ly the expression ofSVP, thus providing an explanation for the early flowering phenotype of brmmutants. Together, our results demonstrate that BRM is essential for proper H3K27me3 distribution in the genome and thus plant development.
Results
Loss of BRM Activity Leads to the Gain of H3K27me3 at Hundreds of
Genes
To examine whether BRM affects the patterns of H3K27me3 deposition and distribution in a genome-wide scale, we performed ChIP-seq with anti-H3K27me3 antibodies in wild-type Col andbrm-1, a null allele with a T-DNA insertion [28]. Two independent biological DNA samples were generated and used for sequencing. We mapped the reads to theArabidopsis genome and identified H3K27me3-enriched regions in both wild-type andbrmmutants. Only H3K27me3-enriched regions identified in both biological replicates were chosen for further data analysis. In 14-day-old wild-type Col seedlings, we identified 5,591 regions, corresponding to 7,230 genes, which were marked by H3K27me3 (S1 Dataset). H3K27me3 target genes identified in our study cover more than 95% (6,322 out of 6634) of those re-ported in a previous ChIP-seq analysis [19]. Furthermore, in both Col and thebrm-1mutant, the patterns of H3K27me3 at several well-characterized H3K27me3 target genes, such as
AGAMOUS(AG),APETALA3(AP3),FLCandFT, are very similar to those reported by
Lu et al [19] (Fig. 1A). In contrast, no H3K27me3 signals at two highly expressed genes,
ACTIN2/7andTUB2, were observed (Fig. 1B), demonstrating the quality and reliability of
our ChIP-seq data.
Compared to wild-type, we identified 276 genes at which H3K27me3 levels changed more than twofold in thebrm-1mutant (see theMaterials and Methodssection for details). Out of the 276 genes, 258 (93.5%) genes showed more than a twofold increase in H3K27me3 in
brm-1, while only 18 (6.5%) genes showed more than a twofold reduction in H3K27me3 inbrm-1
(S2 Dataset). Our genome-wide data show that BRM mainly acts to antagonize PRC2 activity during vegetative development, which is consistent with its expected role as a TrxG protein. However, the decreased H3K27me3 at a smaller set of genes inbrmmutant suggests that BRM could also promote PcG activity at certain loci.
We performed a Gene Ontology (GO) analysis for the genes showing increased
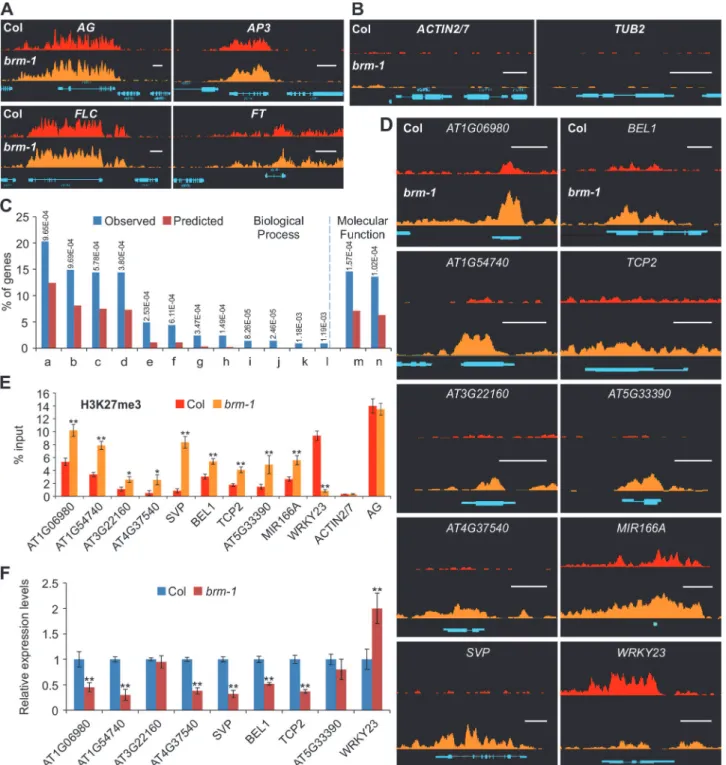
H3K27me3 deposition using the BINGO software [41]. In the classification of biological pro-cesses, these genes were highly enriched in“regulation of metabolic process”(P = 9.69E-4) and“regulation of gene expression”(P = 3.8E-4;Fig. 1C), and in terms of molecular func-tion, the most enriched category observed was“transcription regulator activity”(P = 1.57E-4). Thus, BRM is involved in a wide spectrum of cellular processes such as gene expression regulation and metabolism through preventing PcG proteins from H3K27me3 deposition. To validate our ChIP-seq data, we randomly chose a subset of genes and performed ChIP followed by quantitative PCR (ChIP-qPCR) using independent chromatin samples. We con-firmed the changes in H3K27me3 levels at all 10 selected genes inbrm-1(Fig. 1D and 1E). We did not detect any marked changes at the PcG non-targetsACTIN2/7or the PcG target AG(Fig. 1E).
Figure 1. Loss-of-function ofBRMresults in changes of H3K27me3 distribution over several hundred endogenous genes.(A) ChIP-seq data for the well-known H3K27me3 target genesAG, AP3, FLCandFTfrom wild type Col (red; top) andbrm-1(orange; bottom). Gene structures are shown underneath each panel. Scale bars, 1Kb. The plants used were 14-day-old seedlings. (B) ChIP-seq data showing no H3K27me3 signal at two constitutively expressed genesACTIN2/7andTUB2in wild-type Col (red; top) andbrm-1(orange; bottom). Gene structures are shown underneath each panel. Scale bars, 1Kb. (C) Gene Ontology (GO) analysis of the genes showing increased H3K27me3 levels inbrm-1. Numbers on the top are P values (hypergeometric test) for GO category enrichment generated by comparing the percentage of the corresponding categories in the genes that showed increased H3K27me3 levels with those in the whole genome. (a) Regulation of biological process;(b) Regulation of metabolic process; (c) Regulation of macromolecule metabolic process;(d) Regulation of gene expression; (e) Response to auxin stimulus; (f) Tissue development; (g) Gene silencing by miRNA; (h) Meristem maintenance; (i) Meristem determinacy; (j) Floral meristem determinacy; (k) Leaf shaping; (l) Maintenance of floral meristem identity; (m) Transcription regulator activity; (n) Transcripiton factor activity. (D) ChIP-seq data showing changes in H3K27me3 levels at 10 selected genes inbrm-1. Nine of them showed an increase and one showed a decrease in H3K27me3 levels. Data for the wild-type Col are shown in red at the top, andbrm-1is shown in orange at the bottom. Gene structures are shown underneath each panel. Scale bars, 1Kb. (E) ChIP-qPCR validation using independent samples. Data are shown as percentage of
Removal of CLF or SWN Activity in
brm
Background Results in a
Substantial Decrease of H3K27me3 Deposition at Some Genes
InArabidopsis, CLF is thought to be a major H3K27 methyltransferase responsible for the
de-position of H3K27me3 in tissues other than seeds [42,43]. LIKE HETEROCHROMATIN PROTEIN 1/TERMINAL FLOWER 2 (LHP1/TFL2) associates with regions with H3K27me3 across theArabidopsisgenome and was proposed to be a key component of a plant PRC1 complex [44,45]. Bothclfandtfl2single mutants showed up-ward curling of leaves (Fig. 2A) [42,46]. We reasoned that CLF might be required for the increased H3K27me3 levels at some genes in thebrm-1mutant. To test this, we first generated abrm clfdouble mutant to exam-ine the genetic relationship betweenCLFandBRM. clfsingle mutants display up-wardly curled leaves whilebrmsingle mutants show down-ward curling of leaves [28]. Up-ward leaf curling inclfmutants can be caused by ectopic expression of floral homeotic genes such as
AG, AP1, andAP3[16,42]. In thebrm clfdouble mutants, the up-ward curling of leaves was
weaker than that inclfsingle mutants (Fig. 2AandS1 Fig.), suggesting thatbrmcan partially suppressesclf. We also generatedbrm tfl2double mutants. The leaves of thebrm tfl2double mutants showed down-ward curling as those inbrmsingle mutants (Fig. 2AandS1 Fig.) sug-gesting thatbrmsuppressestfl2’s phenotype of up-wardly curled leaves. These genetic data support a notion that BRM antagonizes PcG function during vegetative development. Con-sistent with the partially rescued up-ward leaf curling inbrm clfdouble mutants, we found decreased ectopic expression of several floral homeotic genes such asAG, AP1, andAP3in
brm clfdouble mutant leaves compared toclfsingle mutants (S2 Fig.). Interestingly, thebrm
clfdouble mutants were also smaller in terms of overall size than either single mutant, sug-gesting the additive effect of the two mutations in plant development. Supporting this obser-vation, we noticed that there were more genes mis-regulated inbrm clfdouble mutants than either single mutant (S3 Fig.).
To test if CLF is required for the increased H3K27me3 levels at some genes in thebrm-1 mutant, we measured genome-wide H3K27me3 levels inbrm clfdouble mutants by ChIP-seq and compared them with those inbrmsingle mutants. We found that removal of CLF activity led to a marked reduction of H3K27me3 levels at approximately half of the genes with in-creased H3K27me3 levels inbrm-1(133 out of 258;Fig. 2B;S3 Dataset), indicating the re-quirement for CLF activity for the increased H3K27me3 levels at some of the genes inbrm mutants. We validated these results by ChIP-qPCR at selected genes (Fig. 2C). It is worth noting, however, that there was no drastic loss in H3K27me3 levels at the rest of the genes in
thebrm clfdouble mutant relative to thebrmsingle mutant (Fig. 2B and 2C), which might be
explained by the redundant SWN activity at these loci. To examine the contribution of SWN, we generated thebrm-1 swn-4double mutant. We found that H3K27me3 levels at the majori-ty of the selected loci in thebrm swndouble mutant were lower than those in thebrmsingle mutant (Fig. 2C). Furthermore, we scanned theSVPlocus and included a region from the neighboring geneAt2g22560, for H3K27me3 distribution in all five mutant backgrounds. As shown inFig. 2D, the results were consistent with those inFig. 2B and 2C, suggesting a re-dundant role of CLF and SWN atSVP. These observations are consistent with a scenario in which BRM acts to protect some gene loci from PcG activity in developing seedlings so that these genes stay active.
input.ACTIN2/7andAGwere used as control loci that exhibited no change in H3K27me3 deposition. Error bars indicate standard deviations from three biological replicates.*:P<0.05;**:P<0.01. (F) Expression analysis of selected genes by qRT-PCR. The expression of each gene was normalized to that ofGAPDH, and the expression level in Col was set to 1. Error bars indicate standard deviations from three biological replicates.*:P<0.05;**:P<0.01.
Increased Occupancy of CLF/SWN at Target Loci in
brm
Mutants
To determine if the increase in H3K27me3 levels inbrmmutants was due to increased CLF/ SWN presence at the loci, we first measured CLF occupancy at the loci in thebrmmutant rela-tive to wild-type using a GFP-tagged CLF line [43]. As shown inFig. 3A, CLF occupancy was increased at all the selected genes, suggesting that, in the absence of BRM, CLF is allowed to ac-cess some inappropriate genomic regions, resulting in increased H3K27me3 levels. We then ex-amined the involvement of SWN. For that, we generated an YFP-tagged SWN line and
performed ChIP with anti-YFP antibodies to measure SWN occupancy in thebrmmutant rela-tive to wild type. We found that the occupancy of SWN was also increased at the majority of the loci when BRM was absent (Fig. 3B). Furthermore, we also scanned theSVPlocus, includ-ing the region in the neighborinclud-ing gene, to compare patterns of CLF/SWN occupancy between wild type andbrm-1. As shown inFig. 3C and 3D, the two proteins were markedly enriched in
brm-1across theSVPlocus with a strong bias towards the transcription start site (TSS),
impli-cating a redundant action of CLF and SWN atSVP. These observations suggest that increased CLF/SWN occupancy could contribute to the elevated levels of H3K27me3 inbrmmutants. On the other hand, by comparing H3K27me3 levels and CLF/SWN occupancy atSVPrelative to the control loci such asAt2g22560andACTIN, low but significant levels of H3K27me3 (Fig. 2D) and CLF/SWN (Fig. 3C and 3D) atSVPwere found in wild-type plants. This sug-gested that BRM prevents high levels of H3K27me3 and CLF/SWN occupancy rather than ex-cluding them. Alternatively, it could also function to keep PcG in an inactive state. At the
WRKY23locus, CLF/SWN occupancy was reduced in thebrmmutant (Fig. 3A and 3B),
consis-tent with the decreased H3K27me3 levels observed at this locus (Fig. 1D and 1E).
Physical Occupancy of BRM at Target Loci
Next, we asked how BRM antagonizes PcG function during vegetative growth, i.e., whether it does so directly or indirectly. One of the possibilities that could explain the increased
H3K27me3 deposition and PcG protein occupancy on chromatin inbrmis the elevated expres-sion level of genes encoding PcG subunits. To address this issue, we examined the expresexpres-sion levels of genes encoding PRC2 components, includingCLF, SWN, EMBRYONIC FLOWER2
(EMF2),VERNALIZATION2(VRN2), FERTILIZATION-INDEPENDENT ENDOSPERM
(FIE) andFERTILIZATION INDEPENDENT SEED2(FIS2) [12] inbrmmutants. The expres-sion of these genes was not increased markedly inbrm-1compared to that in wild-type (S4 Fig.), indicating that BRM does not antagonize PcG through repressing the expression of PcG-encoding genes. We also measured histone H3 levels at selected genes, and found a slight in-crease inbrm-1(S5 Fig.). However, the change in H3 levels was very small and thus could not Figure 2. Removal of CLF or SWN activity inbrmbackground results in a substantial decrease of H3K27me3 deposition.(A) Loss of BRM activity partially rescues the up-wardly leaf curling phenotypes of
clf-29andtfl2-1. Scale bar: 1 cm. (B) ChIP-seq data comparing H3K27me3 levels at 10 selected genes in Col,brm-1, clf-29andbrm-1 clf-29. Data for the wild type Col are shown in red,brm-1in orange,clf-29in yellow, andbrm-1 clf-29in green. Gene structures are shown underneath each panel. Scale bars, 1Kb. (C) ChIP-qPCR validation of the H3K27me3 ChIP-seq data using independent samples; and ChIP-qPCR detection of H3K27me3 levels inswn-4andbrm-1 swn-4mutants. ChIP signals are shown as percentage of input.ACTIN2/7andAT2G22560(a flanking gene ofSVP) were used as negative control loci; andAGwas used as a positive control locus. Error bars indicate standard deviations from three biological replicates. (D) Top panel: schematic representation of the genomic region coveringSVPand the flanking geneAT2G22560. Dark and light blue boxes indicate exon and intron, respectively. Arrows indicate the transcription start sites. Short blue lines indicate the positions of primer pairs used. Bottom panel: ChIP-qPCR determining the levels of H3K27me3 across theSVPlocus. ChIP signals are shown as percentage of input. Error bars indicate standard deviations from three biological replicates.
fully account for the change in H3K27me3 levels. These observations point to the possibility that BRM acts directly at the target loci to antagonize PcG proteins.
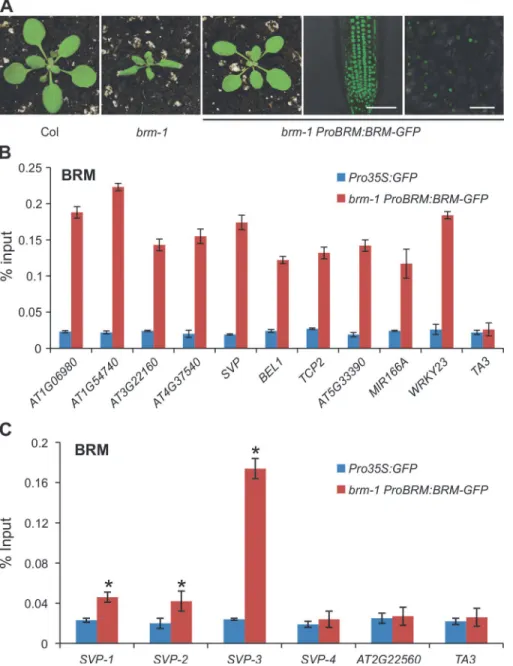
We then tested whether BRM acts directly on the affected genes by physically binding to these genes. We performed ChIP-qPCR experiments to examine BRM occupancy at the affect-ed genes. For the ChIP assay, we usaffect-ed a transgenicArabidopsisline expressing a GFP-tagged BRM transgene under the control of theBRMnative promoter (ProBRM:BRM-GFP) [47]. The transgene could fully rescue the morphological defects of thebrm-1null mutant (Fig. 4A), sug-gesting that it is functional in vivo. ChIP was performed with anti-GFP antibodies andPro35S: GFPplants were used as the negative control. The ChIP DNA was analyzed by qPCR to exam-ine the enrichment of BRM at target genes. Genomic regions around the transcription start site at all examined genes were significantly enriched in the BRM-GFP ChIP (Fig. 4B). Further-more, we scanned theSVPlocus, including the negative control region in the neighboring gene, for BRM occupancy. As shown inFig. 4C, the BRM was found to be significantly en-riched at theSVPlocus, particularly near the TSS. The physical association of BRM with these selected genes, in combination with increased H3K27me3 deposition and decreased expression of the genes inbrmmutants, suggests that BRM acts directly at these target loci, to keep the PRC2 activity off and thus promote gene activity. Loss of BRM activity allows the access to these loci by PRC2, which turns off or decreases gene expression.
BRM Positively Regulates
SVP
Expression
In the sections below, we present our observations to demonstrate thatSVPis a main target of BRM in the control of flowering.SVPis a key negative regulator of flowering inArabidopsis, and loss-of-function ofSVPresults in early flowering [5,7]. Consistent with its role in main-taining the duration of the vegetative phase,SVPis highly expressed in seedlings, but is barely detectable in inflorescence tissues [7]. We noticed initially from our ChIP-seq and ChIP-qPCR data (Fig. 1D and 1E) that H3K27me3 levels drastically increased at theSVPlocus inbrm-1 compared with wild-type. These data suggest that theSVPlocus becomes a PRC2 target in the absence of BRM activity. The increase in H3K27me3 levels at theSVPlocus inbrmraises the possibility that BRM may act to keepSVPon by antagonizing PcG activity during vegetative growth. To test this hypothesis, we first extended the single time point expression analysis of
SVPinbrm-1as presented inFig. 1Fby examining the expression ofSVPin thebrm-1mutant
spanning several developmental time points. Indeed, the expression ofSVPin thebrm-1 mu-tant was consistently lower than that in wild-type plants over a time course spanning 8 to 14 days after germination (DAG,Fig. 5A), suggesting that BRM activity is continually required for the high levels ofSVPexpression in seedlings. The decreased expression ofSVPwas unlikely due to the accelerated floral transition ofbrm-1plants, since the expression ofAP1, a marker gene for the vegetative-to-floral developmental transition [48,49], remained low throughout the time course (S6 Fig.).
To confirm that BRM activates the expression ofSVP, we generatedXVE::aMIRBRM trans-genic lines that harbor an inducible artificial microRNA (amiRNA) targetingBRM(Fig. 5B). Figure 3. Physical occupancy of CLF and SWN at selected genes inbrmmutants.(A) Analysis of CLF occupancy at selected genes as determined by ChIP-qPCR using anti-GFP antibody inbrm-1 Pro35S:GFP-CLFandPro35S:GFP-CLFplants. (B) Analysis of SWN occupancy at selected genes as determined by ChIP-qPCR using anti-GFP antibody inbrm-1 Pro35S:YFP-SWNandPro35S:YFP-SWNplants. (C) and (D) ChIP-qPCR to determine the levels of CLF (C) and SWN (D) occupancy across theSVPlocus. The primers used are the same as those inFig. 2D. ChIP signals are shown as percentage of input.ACTIN2/7and
AT2G22560were used as negative control loci.AGwas a positive control locus. Error bars indicate standard deviations among three biological replicates.*:P<0.05;**:P<0.01.
As shown inFig. 5C,BRMtranscript levels in 7-day-oldXVE::aMIRBRMseedlings treated withβ-estradiol to induce the amiRNA were gradually decreased by approximately 50% during a 24h time course, indicating that the amiRNA was effective.SVPtranscript levels showed a similar reduction kinetics in the time course (Fig. 5D). This result reveals that proper BRM ac-tivity is required forSVPexpression.
Figure 4. Physical occupancy of BRM at selected genes.(A)ProBRM:BRM-GFPcould complement the
brm-1phenotype. GFP signals were detected by confocal microscopy in 14-day-oldbrm-1 ProBRM:BRM-GFProots and leaves, respectively. Scale bar: 50μm. (B) BRM occupancy at selected genes as determined by ChIP using anti-GFP antibody inbrm-1 ProBRM:BRM-GFPplants withPro35S:GFPplants as control. ChIP signals are shown as percentage of input.TA3, a transposable element gene that is not targeted by BRM [34], was used as a negative control locus. (C) ChIP-qPCR to determine the occupancy of BRM across theSVPlocus. ChIP signals are shown as percentage of input. The position of primer pairs used is the same as inFig. 2D.AT2G22560, a flanking locus ofSVP, was used as a negative control locus. Error bars indicate standard deviations among three biological replicates.*:P<0.05.
doi:10.1371/journal.pgen.1004944.g004
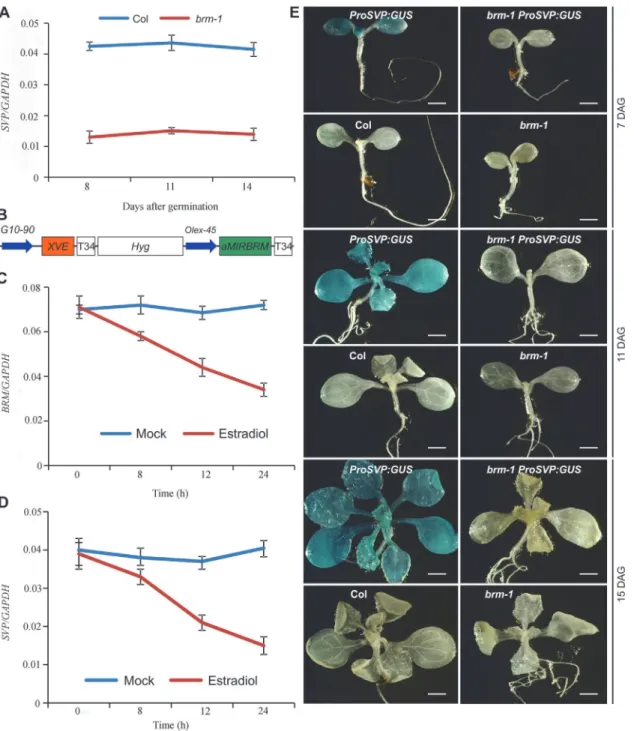
To further verify that BRM activatesSVPexpression at the transcriptional level, we obtained a previously developedSVPpromoter-GUS fusion reporter line (ProSVP:GUS) [5], and intro-duced it into thebrm-1background by genetic crosses (brm-1 ProSVP:GUS). As shown in Figure 5.SVPexpression is tightly controlled by BRM.(A) The expression ofSVPis drastically decreased in developingbrm-1seedlings compared with that in Col (grown at 22°C) as determined by qRT-PCR. (B) Schematic diagram of the region between the right and left T-DNA borders of theXVE::aMIRBRM
construct. The precursor ofaMIRBRMwas inserted behind a LexA operator sequence fused to the-45 35S minimal promoter (OLexA-45). Other components
of the vector were described previously (Curtis and Grossniklaus 2003). (C)BRMexpression in 7-old-dayXVE::aMIRBRMtransgenic seedlings mock treated or treated with 10μmβ-estradiol for 0, 8, 12, and 24h, respectively. (D)SVPexpression in 7-day-oldXVE::aMIRBRMtransgenic seedlings mock treated or treated with 10μmβ-estradiol for 0, 8, 12, and 24h, respectively. The expression of each gene in A, C, and D was normalized to that ofGAPDH. Error bars indicate standard deviations among three technical replicates from one representative experiment. (E) GUS activity patterns ofProSVP:GUSin Col and brm-1backgrounds in 7, 11, and 14-DAG (days after germination) seedlings. Col andbrm-1were included as negative controls. Scale bar: 0.5 mm.
Fig. 5E, GUS activity inbrm-1 ProSVP:GUSwas almost invisible compared to that inProSVP: GUSat all three time points (Fig. 5E), suggesting that the promoter ofSVPhas no detectable activity when BRM is absent. As negative controls, we also stained Col wild-type andbrm-1 mutants but saw no signals (Fig. 5E). DocumentedArabidopsisgene expression data indicate a temporal and spatial overlap of theSVPandBRMexpression patterns in leaves (S7 Fig.) [50], which is consistent with a role for BRM as a positive regulator ofSVPin developing seedlings. These observations demonstrate a positive spatial and temporal correlation betweenBRMand SVPexpression, and when combined with our BRM-GFP ChIP data (Fig. 4B and 4C) that showed a direct BRM binding to theSVPlocus, indicate that BRM directly promotesSVP ex-pression during vegetative development.
BRM Represses Flowering Mainly via Regulating
SVP
Transcription
Having shown above a positive role for BRM in regulatingSVPexpression, we next sought to investigate whether the BRM-SVP module can largely explain the early flowering phenotype of thebrmmutant. Bothbrmandsvpsingle mutants show early flowering phenotypes under long-day conditions [6,7,33,39,40], but it is not known whether there is a common molecular mechanism underlying their flowering phenotypes. We first estimated the flowering time in the two mutants by counting the number of leaves at bolting (Fig. 6A and 6B, top panel).
brm-1andsvp-31, a null T-DNA insertion mutant [6], flowered at roughly the same time. The
svp-31heterozygous plants flowered significantly later than their homozygous siblings but earlier than wild-type Col plants, indicating that SVP controls flowering in a dosage-dependent man-ner, consistent with previous observations [7]. Next, taking advantage of the dosage-dependent nature of flowering control by SVP, we quantifiedSVPtranscript levels by qRT-PCR in the mu-tant plants to estimate the contribution of SVP to the flowering control by BRM (Fig. 6B, mid-dle panel). Our qRT-PCR data confirmed thatsvp-31is a null allele and the heterozygous plants accumulated approximately half the amount ofSVPtranscripts found in wild-type plants (Fig. 6B, middle panel).SVPexpression inbrm-1was drastically decreased to less than half that ofsvp-31heterozygous plants. Inbrm-1 ProBRM:BRM-GFPplants, both the flowering time andSVPexpression were restored to the wild-type level (Fig. 6A and 6B), further confirm-ing that BRM activity is responsible for the normal expression level ofSVP. Our quantification of flowering time andSVPtranscript levels inbrm-1, when compared quantitatively to those
fromsvp-31mutants, suggests that 1) BRM is a major activator ofSVPexpression; and 2) The
early flowering phenotype of thebrm-1mutant can largely be accounted for by the down regu-lation ofSVPtranscription in the mutant, although other BRM targets also have
minor contributions.
To provide additional evidence to strengthen our conclusion, we tested whether restoration ofSVPinbrmmutant background could overcome its early flowering phenotype by expressing SVPfrom a promoter that is not controlled by BRM (Pro35S:SVP) [51] inbrm-5, a chemically induced mutant that has a single nucleotide change in the region encoding the ATPase domain [33]. Indeed, introduction ofPro35S:SVPintobrm-5could rescue the early flowering of the
brm-5mutant (Fig. 6C). We also generated abrm-1 svp-31double mutant to test the genetic
in-teraction betweenBRMandSVPin flowering time control. Thebrm-1 svp-31double mutant flowered only slightly earlier than either single mutant (Fig. 6B), suggesting that BRM and SVP act largely in a common pathway in determining flowering time, and only minor contributions from other BRM targets. It is worth mentioning that three other flowering time genes also dis-played increased H3K27me3 levels in thebrmmutant (S2 DatasetandS8 Fig.). When we checked the expression of these genes, we only saw a clear decrease ofAGAMOUS-LIKE24 (AGL24) expression but not the other two inbrm-1(S8 Fig.). AGL24 is a MADS-box protein
involved in flowering time control.agl24mutants show delayed flowering whileagl24 svp dou-ble mutants are early flowering assvpsingle mutants [52]. The data thus suggest that the early flowering phenotype ofbrmmutants is unlikely caused by these flowering time genes. In Figure 6. BRM represses flowering mainly through regulatingSVPtranscription.(A) Comparison of flowering phenotypes of plants with various genetic backgrounds shortly after bolting. For direct comparison, pictures of wild-type andbrm-1 ProBRM:BRM-GFP, svp-31/+ (heterozygous) andsvp-31, and
brm-1andbrm-1 svp-31were taken at the same age, respectively. All plants were grown at 22°C under long-day conditions. Scale bar: 2 cm. (B) Reduction ofSVPexpression is associated with the early flowering ofbrm-1at 22°C. Top panel: rosette leaf number at bolting of plants in different genetic backgrounds. Error bar indicates standard deviations from at least 20 plants. Lowercase letters indicate significant differences between genetic backgrounds, as
determined by Post-hoc Tukey’s HSD test. Middle panel: expression analysis ofSVP. Bottom panel: expression analysis ofFT. The expression ofSVPand
FTwas calculated relative to that ofGAPDH. Error bars indicate standard deviations among three technical replicates from one representative experiment. (C) Overexpression ofSVPrescues the early flowering phenotype ofbrmmutant. Top panel: flowering phenotype ofbrm-5, Pro35S:SVPandbrm-5 Pro35S: SVPplants grown for five weeks at 22°C under long-day conditions. Scale bar: 2 cm. Bottom panel: rosette leaf number ofbrm-5, Pro35S:SVPandbrm-5 Pro35S:SVPplants at bolting. Lowercase letters indicate significant differences between genetic backgrounds, as determined by Post-hoc Tukey’s HSD test.
addition, we also examined the expression ofFT, a well-established SVP target, in the various genetic backgrounds (Fig. 6B, bottom panel). As expected,FTtranscript levels correlated nega-tively with those ofSVPand positively with flowering time in the corresponding genetic back-grounds. In summary, our observations strongly suggest that BRM represses flowering mainly through activatingSVP.
Discussion
In both animals and plants, a group of proteins that counteract PcG function have been de-scribed and referred to as TrxG proteins [9,13]. Several putative TrxG proteins have been pro-posed inArabidopsis, including the H3K4 methyltransferase ATX1 [53], the SAND-domain DNA binding protein ULTRAPETALA1 (ULT1) [54], the chromatin remodeling ATPase PICKLE (PKL) [55], the H3K27me3 demethylase REF6 [19], and the SWI2/SNF2 ATPases SPLAYED (SYD) and BRM [34]. A challenge for the field is to understand the specific roles of the putative TrxG proteins and the functional relationship among them in antagonizing PcG.
The nature of the antagonism between SWI/SNF-type chromatin remodeling ATPases and PcG proteins has been investigated in several studies in animals; and several models of counter-action have been proposed [23,25,56–58]. Interestingly, a very recent report inArabidopsis showed that BRM overcomes the repression ofAGandAP3by the PcG pathway during the ini-tiation of floral development [34], however, how it does so and to what extent BRM is required for antagonizing PcG function in plants remains unclear. Our genome-wide study shows that BRM deficiency led to an increase in H3K27me3 levels at several hundred genes across the ge-nome during vegetative development inArabidopsis. We further observed increased occupancy of CLF/SWN-containing PcG complex(es) at these genes when BRM is not located there (Fig. 3;S1 Table). Considering that there are low but significant levels of H3K27me3 (Fig. 2B–
2D) and CLF/SWN occupancy (Fig. 3) atSVPin wild-type plants, we favour a model of antago-nism between BRM and PcG, in which BRM might function to prevent high levels H3K27me3 and CLF/SWN occupancy instead of excluding them (Fig. 7). It is also possible that BRM could function to keep PcG in an inactive state. In addition to chromatin remodelers, plants might employ transcription factors to counteract PcG. A recent study showed that the binding of transcription factor AG to the promoter of zinc finger repressorKNUCKLES(KNU) causes the eviction of the PcG proteins from the locus, leading to the induction ofKNU[59]. Thus, both transcription factors and chromatin remodeling proteins could be involved in counteracting PcG. It will be interesting to determine whether and how these two machineries work together in antagonizing PcG function.
Our genome-wide analysis of H3K27me3 occupancy inbrmmutant indicates that BRM does not only antagonize PcG function during plant development, but also cooperates with PcG at some loci (Fig. 1D and 1E). For example, the H3K27me3 level atWRKY23is decreased and the expression of the gene is up-regulated in bothbrmandfiemutant (FIE is a PcG sub-unit) seedlings [17] (this study), suggesting that both BRM and PcG are required for the proper expression ofWRKY23. Further, we show that the decreased H3K27me3 observed atWRKY23 loci inbrmmutant could be because of, at least partly, the decreased CLF binding. Therefore, this observation suggests that BRM may work with the PcG proteins at some of the common loci and thus repress the targets expression. WRKY23 was recently found to be needed for proper root development and the over-expression ofWRKY23results in the reduction of root length [60]. It will be interesting to test whether the increased transcription ofWRKY23could explain the short root phenotype ofbrm[28]. The synergistic relationship between BRM and PcG reported here was also observed by a study in human embryonic stem cell showing that an embryonic stem cell specific SWI/SNF complex acts synergistically with PRC2 at all fourHox
loci [25]. The mechanism by which BRM cooperates with PcG is currently unknown. One pos-sibility would be that BRM directly interacts with PcG and facilitates the targeting of PcG to genes. Indeed, we found that BRM co-localizes with H3K27me3 at theWRKY23locus in wild-type seedlings (Fig. 4), suggesting that BRM might interact with PcG proteins. However, no study so far has demonstrated a direct physical interaction between BRM and PcG proteins. It is possible that these two complexes might interact transiently or indirectly. Nevertheless, the synergistic relationship between BRM and PcG found in both animals and plants might suggest its biological relevance and warrants further studies.
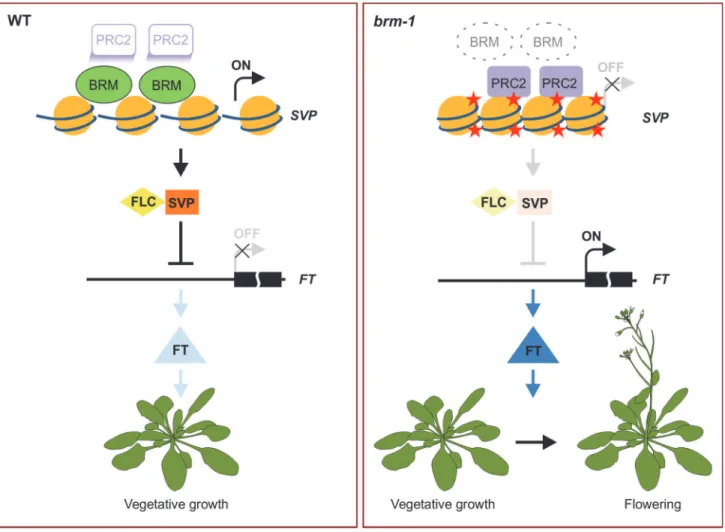
The proper transition from vegetative growth to flowering is critical for the reproductive success of angiosperm plants and must be controlled precisely. BRM has been proposed as a re-pressor of flowering as suggested by the early flowering phenotype and the elevatedFT expres-sion ofbrmmutants [39,40]. However, it was not clear whether BRM acts directly or indirectly to repressFT. SVPhas been demonstrated to be a direct repressor ofFT[5,6], and thus serves as a key repressor of floral transition. The precise regulation ofSVPis obviously of critical im-portance for our understanding of flowering control. Thus far, however, no direct upstream Figure 7. A model for BRM in preventing inappropriate PcG activities atSVPto promote vegetative growth.In wild-type plants, BRM is physically present at the target chromatin sites, and suppresses the inappropriate silencing of target genes by PcG, thus maintaining the expression of the target loci where such expression is needed at the specific developmental phase. Without BRM, PcG is allowed access to some inappropriate genomic sites, resulting in increased H3K37me3 levels and consequently down-regulation of the expression of the genes. For example,SVPis highly expressed in wild-type seedlings and its downstream targetFTis repressed, therefore, vegetative growth is promoted. Conversely,SVPexpression is repressed by the mistargeting of PRC2 inbrmmutants, andFTis de-repressed as a result to lead to early flowering. Red star: the H3K27me3 mark.
activator ofSVPhas been identified. In this work, we provide evidence demonstrating that BRM repressesFTby directly maintaining a high level ofSVPexpression (Fig. 7). First, loss of BRM activity results in decreased expression ofSVP(Fig. 5A–5E), which is associated with in-creased H3K27me3 levels (Fig. 1D and 1E) and increased occupancy of CLF and SWN (Fig. 3C and 3D). Second, BRM directly binds to theSVPlocus in vegetative tissues whereSVPis highly expressed (Fig. 4B and 4C). Together, these observations suggest that BRM represses the floral transition through directly activatingSVP. This is consistent with the genetic evidence showing that thebrm-1 svp-31double mutant displays almost the same early flowering phenotype as
brm-1andsvp-31single mutants (Fig. 6A and 6B). Although our data support a scenario that
BRM represses flowering mainly throughSVP, some evidence suggests that BRM may also re-press flowering through other pathways. For example, the exre-pression ofCONSTANS(CO), an activator ofFTin the photoperiod pathway, was increased inbrmmutants [40]. In addition, el-evated expression of bothFLCandFTinbrmmutants was also reported previously [39,40]. SinceFLCis a repressor ofFTexpression [61], it seems hard to understand why the expression levels of bothFLCandFTwere increased inbrmmutants. Our results presented here provide an explanation for this apparent discrepancy: mutation ofBRMresults in reduced expression ofSVPand consequently lower abundance of the SVP-FLC repressor complex, ultimately lead-ing to activation ofFT, regardless of the increased expression ofFLC.
It is also relevant to note that down-regulation ofBAF60/SWP73Bwas recently reported to cause increasedFLCexpression and delayed floral transition [37]. The apparently opposing flowering time phenotype ofbrmmutants and theBAF60knockdown line is puzzling. It is un-known whether and how BAF60 regulatesSVPexpression. It might be possible that the pres-ence of BAF60 in a SWI/SNF complex inhibits the activity of BRM, thus reduction of BAF60 could allow BRM to activateSVPexpression, which, in turn, leads to delayed floral transition. Alternatively, it might also be possible that BRM and BAF60 are present in distinct complexes that differ in their regulatory activities and target genes, e.g., BRM activatesSVP, while BAF60 repressesFLC.
Our genome-wide H3K27me3 profiling data also reveal that BRM is involved in the regula-tion of a number of other important developmental genes including, most noticeably, members of themiR166andmiR156families (S2 Dataset). It is well established that themiR166family miRNAs target the transcripts of the HD-ZIPIII genes, controlling the level and domain of their expression to allow their proper functions in plant development [62–64]. More recently, we uncovered a new role formiR166in repressing the seed maturation program during vegeta-tive development [65]. An earlier study demonstrated the involvement of BRM in repression of the seed maturation genes in leaves [33]–abrmmutation was isolated in a reporter-assisted genetic screen forArabidopsismutants exhibiting ectopic expression of seed storage protein genes [33,65,66]. Our new data presented here thus provide a potential link between the two early studies [33,65]: it strongly suggests that BRM promotes the accumulation ofmiR166, which in turn represses seed maturation genes in developing seedlings. In conclusion, our work demonstrates that BRM promotes vegetative development by harnessing PcG proteins (mainly by preventing their activities) at key developmental genes.
Materials and Methods
Plant Materials and Growth Condition
Arabidopsisseeds were stratified at 4°C for 3 days in dark condition. Then the seeds were sown
on soil or on agar plates containing 4.3 g/L Murashige and Skoog nutrient mix (Sigma-Al-drich), 1.5% sucrose, 0.5 g/L MES (pH 5.8), and 0.8% agar. Plants were grown in growth rooms with 16-h-light/8-h-dark cycles (Long-day, LD) at 22°C or 16°C. T-DNA insertion mutants
were obtained from the ABRC, unless otherwise indicated. Thebrm-1(SALK_030046),brm-5,
clf-29(SALK_021003),tfl2-1(CS3796),svp-31(SALK_026551) andSWN-4(SALK_109121)
mutants are all in the Col background and have been described previously [6,28,33,46,67,68]. Homozygous T-DNA insertion mutants were identified by PCR-based genotyping. Transgenic plantsProBRM:BRM-GFP, ProSVP:GUS, Pro35S:SVP, Pro35S:GFP-CLFandPro35S:GFPhave been described [5,43,47,69].
Chromatin Immunoprecipitation (ChIP) Assays
ChIP was carried out as described [70,71] with minor modifications. Briefly, two grams of 14-day-old seedlings grown on MS agar were cross-linked with 1% formaldehyde and then ground into fine power with liquid nitrogen. Chromatin was isolated and sheared into 200–800 base pair fragments by sonication. The sonicated chromatin was immunoprecipitated with 5μL of
anti-H3K27me3 (07–449, Millipore), anti-GFP (ab290, Abcam) or anti-H3 (Ab1791, Abcam) antibodies. The precipitated DNA was then recovered with the MiniElute PCR Purification Kit (Cat#28004, Qiagen) according to the manufacturer’s instructions. ChIP-qPCR was performed with three technical replicates, and results were calculated as percentage of input DNA accord-ing to the Champion ChIP-qPCR user manual (SABioscience). If fold enrichment was used, the calculated percentage input of the wild-type control plant at the regions tested was set to 1. The fold enrichment represents the fold change relative to the wild-type. Independent ChIP experiments were performed at least two more times and similar results were obtained. Primer sequences used for ChIP-qPCR were listed inS2 Table.
ChIP-seq Analysis
Ten ng of ChIP DNA immuoprecipitated by the anti-H3K27me3 antibody was used for ChIP-seq library construction. End repair, adapter ligation and amplification were carried out using the Illumina Genomic DNA Sample Prep Kit according to the manufacturer’s protocol. Illu-mina Genome Analyser IIx or HiSeq 2500 was used for high-throughput sequencing of the ChIP-seq library. The raw sequence data were processed using the Illumina sequence data analysis pipeline GAPipeline1.3.2. Then Bowtie [72] was employed to map the reads to the
Arabidopsisgenome (TAIR10) [73]. Only perfectly and uniquely mapped reads were retained
for further analysis. Then the data were analyzed as described [19]. Briefly, the alignments were first converted to WIG files using MACS [74]. Then the data were imported to Integrated Genome Browser (IGB) [75] for visualization. Secondly, the program SICER [76] was used to identify ChIP-enriched domains (peaks) in histone modification signals. Thirdly, quantitative comparisons between wild-type Col and mutants were performed using the ChIPDiff program [77]. Regions with more than twofold changes were kept for further analysis. Finally, the iden-tified regions were annotated according to the Arabidopsis annotation gff file (TAIR10,www. arabidopsis.org) using a customized Perl script. Two independent biological replicates were used for sequencing, and only the regions of H3K27me3 found in both replicates were included in the analyses.
Gene Expression Analysis
Total RNA was isolated from*100 mg of plant tissues using the RNeasy Plant Mini kit
(Qiagen). Oneμg RNA was reverse transcribed into cDNA using the High Capacity cDNA
independent RNA samples (biological replicates).GAPDHserved as the internal reference. PCR primers used in real-time PCR are listed inS2 Table.
For genome-wide expression analysis, three biological replicates of Col,brm-1, clf-29and
brm-1 clf-29samples were analyzed on Affymetrix ATH1 arrays. Genes showing 1.5 fold
changes were considered to be differentially expressed.
Construction of YFP-SWN Transgenic Line
TheSWNgene without the stop codon was amplified by PCR and cloned into the pDONR221 vector (Invitrogen) by BP reaction according to the manufacturer’s instructions. The resulting transgene in the entry vector was sequenced to make sure that no mutation was introduced during PCR. The transgene was then transferred into the pEarlyGate 104 Gateway-compatible destination vector [78] by LR reaction, according to the manufacturer’s instructions, to make
Pro35S:YFP-SWN. The construct was introduced intoAgrobacterium tumefaciensGV3101,
which was then used to transformswn-4mutant plants using the floral dip method [79]. Trans-genic plants were selected in MS agar media containing 50μg/ml of Hygromycin B and allowed
to grow in soil to maturity to yield seeds. PCR primers used in making the construct are listed inS2 Table.
Artificial miRNA Transgene Constructs
For generating theXVE::aMIRBRMconstruct, the pRS300 vector [80] was used as the back-bone to first generateaMIRBRM. The primers used were designed according to WMD3 (http://wmd3.weigelworld.org/cgi-bin/webapp.cgi) and are listed inS2 Table.aMIRBRMwas subcloned into the pDONR221 vector (Invitrogen), confirmed by sequencing, and then recom-bined into the pMDC7 Gateway-compatible destination vector [78] where theaMIRBRM transgene is controlled by a Estradiol-inducible promoter. The construct was transformed into Col wild-type plants by the floral dip method [79]. Transgenic plants were selected for Hygro-mycin B resistance and allowed to grow to maturity to yield seeds. Seven-day-old T2 transgenic plants were treated either by 10μmolβ-Estradiol or DMSO (as the mock control) and samples
were collected at different time points after the treatment.
Histochemical GUS Staining
The standard GUS staining solution (0.5 mg/mL 5-bromo-4-chloro-3-indolyl-glucuronide, 20% methanol, 0.01 M Tris-HCl, pH 7.0) was used. Seedlings immersed in GUS staining solu-tion were placed under vacuum for 15 min, and then incubated at 37°C overnight. The staining solution was removed and samples were cleared by sequential incubation in 75% and
95% ethanol.
Flowering Time Measurement
Wild-type and mutant plants were grown side by side in soil at 22°C or 16°C with 16-h-light/ 8-h-dark cycles. The number of rosette leaves was counted when the length of the inflorescence stem was 1 cm. For each genotype, at least 20 plants were analyzed, and the analysis was repeat-ed 3 times independently.
Accession Numbers
Sequence data from this article can be found in the Arabidopsis Genome Initiative or Gen-Bank/EMBL databases under the following accession numbers:BRM(AT2G46020),SVP
(AT2G22540),CLF(AT2G23380),BEL1(AT5G41410),TCP2(AT4G18390),WRKY23
(AT2G47260),miR156D(AT5G10945),LHP1/TFL2(AT5G17690),EMF2(AT5G51230),FIE
(AT3G20740),SWN(AT4G02020),VRN2(AT4G16845),AP1(AT1G69120),TA3
(AT1G37110),ACTIN2/7(AT5G09810),AG(AT4G18960),AP3(AT3G54340),FLC (AT5G10140),AGL24(AT4G24540),SMZ(AT3G54990) andFT(AT1G65480). All raw ChIP-seq dataset and ATH1 expression array dataset have been deposited in the Gene Expres-sion Omnibus database under accesExpres-sion number GSE47202 and GSE53623.
Supporting Information
S1 Fig. Leaf curling phenotype ofbrm-1, clf-29, brm-1 clf-29, brm-1 tfl2-1, and brm-1 swn-4. (A) Top panel: Rosette leaves from 14-d-old plants are shown. Scale bar: 2 mm. Bottom panel: Percentage of upwardly curled leaves in each genetic background is shown. Error bar in-dicates standard deviations from at least 20 plants.Pvalues were determined by two-tailed t-test. (B) Comparison ofbrm-1andbrm-1 swn-4double mutants grown in soil for 14 days. Scale: 1cm.
(PDF)
S2 Fig. Ectopic expression of floral homeotic genes in theclfmutant could be partially re-stored by removing BRM activity. Expression data of floral homeotic genes,AG(A),AP1(B), AP3(C) andAGL24(D), in different genetic backgrounds were determined by qRT-PCR with three biological replicates.
(PDF)
S3 Fig. The number of genes showing at least 1.5 fold change in 14-d-oldbrm-1, clf-29, and brm-1 clf-29seedlings as determined by microarray-based gene expression profiling.
(PDF)
S4 Fig. Expression analysis of PcG-encoding genes inbrm-1and col seedlings as deter-mined by qRT-PCR. The expression levels of each gene were normalized to that ofGAPDH, and the expression level in Col was set to 1. Error bars indicate standard deviation among three technical replicates from one representative experiment.
(PDF)
S5 Fig. ChIP-qPCR analyses of histone H3 levels at selected genes inbrm-1and Col seed-lings. ChIP signals are shown as fold changes relative to that in wild-type plants. Error bars in-dicate standard deviation among three technical replicates from one
representative experiment. (PDF)
S6 Fig. Expression analysis ofAP1inbrm-1and Col seedlings as determined by qRT-PCR.
The expression level ofAP1gene was normalized to that ofGAPDH. Error bars indicate stan-dard deviation among three technical replicates from one representative experiment.
(PDF)
S7 Fig. Expression patterns ofBRMandSVP.The data were extracted from Schmid et al [50] and displayed using the AtGenExpress Visualization Tool (http://jsp.weigelworld.org/expviz/ expviz.jsp).
(PDF)
of input. Error bars indicate standard deviations among three technical replicates from one representative experiment. (C) Expression analysis ofAGL24andSMZby qRT-PCR. The ex-pression of each gene was normalized to that ofGAPDH, and the expression level in Col was set to 1. Error bars indicate standard deviations among three technical replicates from one rep-resentative experiment. (D) Small RNA northern blot analysis ofmiR156inbrm-1compared with Col. Two time points were used (10 days and 14 days after germination). The levels of small RNAs inbrm-1were compared with those in Col, which was set as 1. The numbers below the gel images indicate relative abundance. U6 served as loading control. RNA isolation and hybridization for miRNA detection was performed as described [65]. Digoxigenin-labeled miRNA probes were generated using the mirVana miRNA Probe Construction Kit (Ambion). Oligonucleotide probes used are listed inS2 Table.
(PDF)
S1 Table. Summary of changes in H3K27me3 levels, CLF occupancy and gene expression in brm-1mutants.
(PDF)
S2 Table. Oligonucleotides used in this study.
(PDF)
S1 Dataset. List of genes occupied by H3K27me3 in 14-day-old Col seedlings.
(XLSX)
S2 Dataset. List of genes with more than 2-fold changes in H3K27me3 levels inbrm-1 seed-lings compared with Col.
(XLSX)
S3 Dataset. Genes at which increased H3K27me3 levels inbrm-1are dependent on CLF.
(XLSX)
Acknowledgments
We thank Kerstein Kaufmann for kindly providing us seeds ofProBRM:BRM-GFP; Hao Yu for seeds ofProSVP:GUS; Jeong Hwan Lee for seeds ofPro35S:SVP; Justin Goodrich for seeds of Pro35S:GFP-CLF; and ABRC for seeds of T-DNA insertion lines. We thank Steven Rothstein for critical reading of the manuscript; Vojislava Grbic for the suggestion of using the absence of AP1expression as a marker of the vegetative developmental phase; and Alex Molnar for help with preparing the figures.
Author Contributions
Conceived and designed the experiments: CL YC. Performed the experiments: CL CC KS LG VN XC XS. Analyzed the data: CL CC KW LG SEK SH SY XC YC. Wrote the paper: CL XC YC.
References
1. He Y (2012) Chromatin regulation of flowering. Trends Plant Sci 17: 556–562. doi:10.1016/j.tplants. 2012.05.001PMID:22658650
2. Boss PK, Bastow RM, Mylne JS, Dean C (2004) Multiple pathways in the decision to flower: enabling, promoting, and resetting. Plant Cell 16: S18–S31. doi:10.1105/tpc.015958PMID:15037730
3. Mouradov A, Cremer F, Coupland G (2002) Control of flowering time interacting pathways as a basis for diversity. Plant Cell 14: S111–S130. doi:10.1105/tpc.001362PMID:12045273
4. Andrés F, Coupland G (2012) The genetic basis of flowering responses to seasonal cues. Nat Rev Genet 13: 627–639. doi:10.1038/nrg3291PMID:22898651
5. Li D, Liu C, Shen L, Wu Y, Chen H, et al. (2008) A repressor complex governs the integration of flower-ing signals inArabidopsis. Dev Cell 15: 110–120. doi:10.1016/j.devcel.2008.05.002PMID:18606145
6. Lee JH, Yoo SJ, Park SH, Hwang I, Lee JS, et al. (2007) Role of SVP in the control of flowering time by ambient temperature inArabidopsis. Genes Dev 21: 397–402. doi:10.1101/gad.1518407PMID: 17322399
7. Hartmann U, Höhmann S, Nettesheim K, Wisman E, Saedler H, et al. (2000) Molecular cloning of SVP: a negative regulator of the floral transition inArabidopsis. Plant J 21: 351–360.
8. Margueron R, Reinberg D (2011) The Polycomb complex PRC2 and its mark in life. Nature 469: 343–
349. doi:10.1038/nature09784PMID:21248841
9. Schwartz YB, Pirrotta V (2007) Polycomb silencing mechanisms and the management of genomic pro-grammes. Nat Rev Genet 8: 9–22.
10. Simon JA, Kingston RE (2013) Occupying chromatin: Polycomb mechanisms for getting to genomic tar-gets, stopping transcriptional traffic, and staying put. Mol Cell 49: 808–824. doi:10.1016/j.molcel.2013. 02.013PMID:23473600
11. Simon JA, Kingston RE (2009) Mechanisms of polycomb gene silencing: knowns and unknowns. Nat Rev Mol Cell Biol 10: 697–708. doi:10.1038/nrm2763PMID:19738629
12. Zheng B, Chen X (2011) Dynamics of histone H3 lysine 27 trimethylation in plant development. Curr Opin Plant Biol 14: 123–129. doi:10.1016/j.pbi.2011.01.001PMID:21330185
13. Bemer M, Grossniklaus U (2012) Dynamic regulation of Polycomb group activity during plant develop-ment. Curr Opin Plant Biol 15: 523–529. doi:10.1016/j.pbi.2012.09.006PMID:22999383
14. Holec S, Berger F (2012) Polycomb group complexes mediate developmental transitions in plants. Plant Physiol 158: 35–43. doi:10.1104/pp.111.186445PMID:22086420
15. Köhler C, Hennig L (2010) Regulation of cell identity by plant Polycomb and trithorax group proteins. Curr Opin Genet Dev 20: 541–547. doi:10.1016/j.gde.2010.04.015PMID:20684877
16. Chanvivattana Y, Bishopp A, Schubert D, Stock C, Moon YH, et al. (2004) Interaction of Polycomb-group proteins controlling flowering inArabidopsis. Development 131: 5263–5276. PMID:15456723
17. Bouyer D, Roudier F, Heese M, Andersen ED, Gey D, et al. (2011) Polycomb repressive complex 2 controls the embryo-to-seedling phase transition. PLoS Genet 7: e1002014. doi:10.1371/journal. pgen.1002014PMID:21423668
18. Lafos M, Kroll P, Hohenstatt ML, Thorpe FL, Clarenz O, et al. (2011) Dynamic regulation of H3K27 tri-methylation duringArabidopsisdifferentiation. PLoS Genet 7: e1002040. doi:10.1371/journal.pgen. 1002040PMID:21490956
19. Lu F, Cui X, Zhang S, Jenuwein T, Cao X (2011)ArabidopsisREF6 is a histone H3 lysine 27 demethylase. Nat Genet 43: 715–719. doi:10.1038/ng.854PMID:21642989
20. Lodha M, Marco CF, Timmermans MCP (2013) The ASYMMETRIC LEAVES complex maintains re-pression of KNOX homeobox genes via direct recruitment of Polycomb-repressive complex2. Genes Dev 27: 596–601. doi:10.1101/gad.211425.112PMID:23468429
21. Clapier CR, Cairns BR (2009) The biology of chromatin remodeling complexes. Annu Rev Biochem 78: 273–304. doi:10.1146/annurev.biochem.77.062706.153223PMID:19355820
22. Saha A, Wittmeyer J, Cairns BR (2006) Chromatin remodelling: the industrial revolution of DNA around histones. Nat Rev Mol Cell Biol 7: 437–447. PMID:16723979
23. Tamkun JW, Deuring R, Scott MP, Kissinger M, Pattatucci AM, et al. (1992) brahma: a regulator of Dro-sophilahomeotic genes structurally related to the yeast transcriptional activator SNF2/SWI2. Cell 68: 561. PMID:1346755
24. Hargreaves DC, Crabtree GR (2011) ATP-dependent chromatin remodeling: genetics, genomics and mechanisms. Cell Res 21: 396–420. doi:10.1038/cr.2011.32PMID:21358755
25. Ho L, Miller EL, Ronan JL, Ho WQ, Jothi R, et al. (2011) esBAF facilitates pluripotency by conditioning the genome for LIF/STAT3 signalling and by regulating polycomb function. Nat Cell Biol 13: 903–913. doi:10.1038/ncb2285PMID:21785422
26. Han SK, Sang Y, Rodrigues A,F2010 B, Wu MF, et al. (2012) The SWI2/SNF2 chromatin remodeling ATPase BRAHMA represses abscisic acid responses in the absence of the stress stimulus in
Arabidopsis. Plant Cell 24: 4892–4906. doi:10.1105/tpc.112.105114PMID:23209114
27. Jerzmanowski A (2007) SWI/SNF chromatin remodeling and linker histones in plants. Biochim Biophys Acta 1769: 330–345. PMID:17292979
29. Bezhani S, Winter C, Hershman S, Wagner JD, Kennedy JF, et al. (2007) Unique, shared, and redun-dant roles for theArabidopsisSWI/SNF chromatin remodeling ATPases BRAHMA and SPLAYED. Plant Cell 19: 403–416. doi:10.1105/tpc.106.048272PMID:17293567
30. Archacki R, Buszewicz D, Sarnowski TJ, Sarnowska E, Rolicka AT, et al. (2013) BRAHMA ATPase of the SWI/SNF chromatin remodeling complex acts as a positive regulator of gibberellin-mediated re-sponses inArabidopsis. PLoS ONE 8: e58588. doi:10.1371/journal.pone.0058588PMID:23536800
31. Sarnowski TJ, Ríos G, Jásik J,Świeżewski S, Kaczanowski S, et al. (2005) SWI3 subunits of putative
SWI/SNF chromatin-remodeling complexes play distinct roles during Arabidopsis development. Plant Cell 17: 2454–2472. doi:10.1105/tpc.105.031203PMID:16055636
32. Vercruyssen L, Verkest A, Gonzalez N, Heyndrickx KS, Eeckhout D, et al. (2014) ANGUSTIFOLIA3 binds to SWI/SNF chromatin remodeling complexes to regulate transcription duringArabidopsisleaf development. Plant Cell 26: 210–229. doi:10.1105/tpc.113.115907PMID:24443518
33. Tang X, Hou A, Babu M, Nguyen V, Hurtado L, et al. (2008) TheArabidopsisBRAHMA chromatin-re-modeling ATPase is involved in repression of seed maturation genes in leaves. Plant Physiol 147: 1143–1157. doi:10.1104/pp.108.121996PMID:18508955
34. Wu MF, Sang Y, Bezhani S, Yamaguchi N, Han SK, et al. (2012) SWI2/SNF2 chromatin remodeling ATPases overcome polycomb repression and control floral organ identity with the LEAFY and SEPAL-LATA3 transcription factors. Proc Natl Acad Sci USA 109: 3576–3581. doi:10.1073/pnas.1113409109 PMID:22323601
35. Zhu Y, Rowley MJ, Böhmdorfer G, Wierzbicki AT (2012) A SWI/SNF chromatin-remodeling complex acts in noncoding RNA-mediated transcriptional silencing. Mol Cell 49: 1–12. doi:10.1016/j.molcel. 2012.11.011PMID:23246435
36. Kwon CS, Hibara K, Pfluger J, Bezhani S, Metha H, et al. (2006) A role for chromatin remodeling in reg-ulation of CUC gene expression in theArabidopsiscotyledon boundary. Development 133: 3223–
3230. PMID:16854978
37. Jégu T, Latrasse D, Delarue M, Hirt H, Domenichini S, et al. (2014) The BAF60 subunit of the SWI/SNF chromatin-remodeling complex directly controls the formation of a gene loop at FLOWERING LOCUS C inArabidopsis. Plant Cell 26: 538–551. doi:10.1105/tpc.113.114454PMID:24510722
38. Sarnowska EA, Rolicka AT, Bucior E, Cwiek P, Tohge T, et al. (2013) DELLA-interacting SWI3C core subunit of switch/sucrose nonfermenting chromatin remodeling complex modulates gibberellin re-sponses and hormonal cross talk inArabidopsis. Plant Physiol 163: 305–317. doi:10.1104/pp.113. 223933PMID:23893173
39. Farrona S, Hurtado L, Bowman JL, Reyes JC (2004) TheArabidopsis thalianaSNF2 homolog AtBRM controls shoot development and flowering. Development 131: 4965–4975. PMID:15371304
40. Farrona S, Hurtado L, March-Díaz R, Schmitz RJ, Florencio FJ, et al. (2011) Brahma is required for proper expression of the floral repressor FLC inArabidopsis. PLoS One 6: e17997. doi:10.1371/ journal.pone.0017997PMID:21445315
41. Maere S, Heymans K, Kuiper M (2005) BiNGO: a Cytoscape plugin to assess overrepresentation of gene ontology categories in biological networks. Bioinformatics 21: 3448–3449. PMID:15972284
42. Goodrich J, Puangsomlee P, Martin M, Long D, Meyerowitz EM, et al. (1997) A Polycomb-group gene regulates homeotic gene expression inArabidopsis. Nature 386: 44–51. PMID:9052779
43. Schubert D, Primavesi L, Bishopp A, Roberts G, Doonan J, et al. (2006) Silencing by plant Polycomb-group genes requires dispersed trimethylation of histone H3 at lysine 27. EMBO J 25: 4638–4649. doi: 10.1038/sj.emboj.7601311PMID:16957776
44. Turck F, Roudier F, Farrona S, Martin-Magniette ML, Guillaume E, et al. (2007)ArabidopsisTFL2/ LHP1 specifically associates with genes marked by trimethylation of histone H3 lysine 27. PLoS Genet 3: e86. doi:10.1371/journal.pgen.0030086PMID:17542647
45. Zhang X, Germann S, Blus BJ, Khorasanizadeh S, Gaudin V, et al. (2007) TheArabidopsisLHP1 pro-tein colocalizes with histone H3 Lys27 trimethylation. Nat Struct Mol Biol 14: 869–871. PMID: 17676062
46. Larsson AS, Landberg K, Meeks-Wagner DR (1998) The TERMINAL FLOWER2 (TFL2) gene controls the reproductive transition and meristem identity inArabidopsis thaliana. Genetics 149: 597–605. PMID:9611176
47. Smaczniak C, Immink RGH, Muiño JM, Blanvillain R, Busscher M, et al. (2012) Characterization of MADS-domain transcription factor complexes inArabidopsisflower development. Proc Natl Acad Sci USA 109: 1560–1565. doi:10.1073/pnas.1112871109PMID:22238427
48. Mandel MA, Gustafson-Brown C, Savidge B, Yanofsky MF (1992) Molecular characterization of the
Arabidopsisfloral homeotic gene APETALA1. Nature 360: 273–277. PMID:1359429