URBAN MOBILITY APPLIED AT COMFORT LEVEL IN CPTM CORAL LINE WAGONS
MOBILIDADE URBANA APLICADA AO NÍVEL DE CONFORTO NOS VAGÕES DA LINHA CORAL DA CPTM
MOVILIDAD URBANA APLICADA AL NIVEL DE CONFORT EN CORAL WAGONS DE CPTM
Ed Carlos Mariz1 Jônatas Gomes de Oliveira2
Regis Cortez Bueno3
Received in june 2019 Accepted in july 2020 ABSTRACT
The city of São Paulo, the most developed metropolis in Brazil, has become an attractive global hub. It currently has a population of approximately 21 million inhabitants in the metropolitan region. In recent years there has been a substantial increase in the number of inhabitants, a fact that brings a direct correlation to the low rates of urban mobility. Passenger transport is no longer offered with quality, often operating with low levels of comfort, especially during peak hours. The purpose of the research is to measure the number of passengers per m2 in the CPTM train operations, Coral line, in order to verify if the service is offered with quality to its users. The mathematical modeling used was the calculation of fleet sizing. The survey data indicated that the levels are on average nine passengers per square meter, acceptable levels, but well below the standards of developed countries.
Keywords: Passenger Transport. Urban Mobility. CPTM. Comfort Level.
RESUMO
A cidade de São Paulo, metrópole mais desenvolvida do Brasil, tem se tornado um polo atrativo mundial. Conta atualmente com uma população de aproximadamente 21 milhões de habitantes, na região metropolitana. Nos últimos anos tem verificado um aumento substancial em número de habitantes, fato que, traz uma correlação direta aos baixos índices de mobilidade urbana. Os transportes de passageiros passam a não ser ofertados com qualidade, muitas vezes operam com baixos níveis de conforto, sobretudo nos horários de pico. A pesquisa tem por propósito mensurar a quantidade de passageiros por m2 nas operações de trens da CPTM, linha Coral, a fim de verificar se o serviço é ofertado com qualidade a seus usuários. A modelagem matemática utilizada foi o cálculo de dimensionamento de frota. Os dados da pesquisa indicaram que os níveis estão em média nove passageiros por metro quadrado, níveis aceitáveis, porém muito abaixo dos padrões de países desenvolvidos.
Palavras-chave: Transporte de Passageiros. Mobilidade Urbana. CPTM. Nível de Conforto.
1 Instituto Federal de Suzano. E-mail: edcarlosmarizn@gmail.com. 2
Instituto Federal de Suzano. E-mail: jonatashistoria@gmail.com.
RESUMEN
La ciudad de São Paulo, la metrópolis más desarrollada de Brasil, se ha convertido en un atractivo centro global. Actualmente tiene una población aproximada de 21 millones de habitantes en la región metropolitana. En los últimos años se ha producido un aumento sustancial del número de habitantes, hecho que tiene una correlación directa con las bajas tasas de movilidad urbana. El transporte de pasajeros ya no se ofrece con calidad, a menudo operando con bajos niveles de comodidad, especialmente durante las horas pico. El propósito de la investigación es medir el número de pasajeros por m2 en las operaciones del tren CPTM, línea Coral, con el fin de verificar si el servicio se ofrece con calidad a sus usuarios. El modelo matemático utilizado fue el cálculo del tamaño de la flota. Los datos de la encuesta indicaron que los niveles son en promedio nueve pasajeros por metro cuadrado, niveles aceptables, pero muy por debajo de los estándares de los países desarrollados.
Palabras clave: Transporte de pasajeros. Mobilidad urbana. CPTM. Nivel de comodidad.
1 INTRODUCTION
It is understood that large Brazilian cities suffer from infrastructure problems, especially in essential public services, lack of planning, use and occupation of land, pollution, traffic congestion, precarious public transport and insecurity, are always recurring adversities. The growing obstacles make the quality of life of the inhabitants very deficient, which results in a decrease in the leisure time of the population, raises the operating costs of transport systems and hinders the flow of labor and goods, not to mention the constant traffic accidents and large-scale polluting agents (FURTADO, 2018).
Several cities around the world have efficient public transport systems, especially those powered by trails, responsible for interconnecting kilometers throughout the city, very common in North America and Europe (TORRES, 2014). In Brazil, due to industrial development, urban populations have opted for individual transport, a fact that over the years has increased the number of vehicles in circulation, and citizens have suffered from the effects of such a choice. The car transformed the characteristics of the city, which increasingly depended on it, and gradually expelled other modes of transport, such as trams and bicycles. The city of São Paulo had a tram network, now called VLT, which allowed 700 kilometers of itineraries, with an offer of 0.58 per inhabitant / day, greater than the 0.22 inhabitant trips / day, currently offered by the subway and by CPTM (Companhia Paulista de Trens Metropolitanos). Trams were buried by asphalt in the 1960s, giving way to current automobile routes (GREGORI, 2017).
Cities no longer support the expansion of automobiles, transport on rail should increase their participation and efficiency in Brazilian metropolitan regions (LOUBACK, 2018). The increase in investment in public transport becomes essential in the modes on tracks, such as subway and train, however, the volume of capital for the expansion and operation of the network is quite high, so the lines continue to operate in a deficient manner and with great passenger flow, especially at peak times.
In the city of São Paulo, CPTM and Metro trains are operating, connecting cities neighboring the capital, places where growth has intensified conflicts between different forms of displacement that generate large expenses.
CNT data (2016) address that the capacity for passenger transport is a measure of the real supply of seats, corresponding to the number of km2 cars, multiplied by the sum of the car seats, plus the capacity of standing passengers per square meter, is considered, by most European operators, four passengers standing per m2, ideal for the convenience of users, a fact that was overcome by Line 11, Coral by CPTM.
Therefore, it is necessary to have projects with high visibility supported by studies that can measure the main obstacles in passenger transport, mainly public ones. One of the problems encountered is the surpassed passenger capacity per m2, which means that users tend to make use of private automotive transport.
Therefore, the research aims to measure the number of passengers per m2 in CPTM train operations, Coral line, in order to verify if the service is offered with quality to its users.
2 THEORETICAL BACKGROUND
The theoretical framework begins with passenger transport in Brazil.
2.1 Passenger transportation in Brazil
The transport system was developed gradually, according to Torres (2004), from the 19th century, initially on the European continent, and gradually implanted worldwide. Initially it was developed from animal traction, which underwent modifications over the years, which used as a driving force burning coal, fossil fuels and later renewable energies, such as biofuels and electric energy (TORRES, 2004).
In the early periods the speed was very low, as it cost high values, a factor that made transportation unattractive, generally used by the European nobility who boasted pomp and refinement. Currently, the situation is reversed, at least when it comes to Brazil, the populations that use public transport are generally from the less affluent classes, who use transport essentially to work and study, which travels many kilometers across the city , which spends hours of its daily journey, not to mention the scorching journeys at peak times. As described, the current daily situations are the opposite of those of the past centuries, with the advancement of science, medicine and technology, the world populations have grown wildly, reaching unimaginable population contingents, thus, the authorities are unable to give apparatus to the peripheral populations, who as addressed, are massively the public of public passenger transport (BOUBACK, 2018).
Transport services are offered by public or private companies, usually a municipal obligation, sometimes accompanied by subsidies, or by private companies. In Brazil, most of the transport takes place by bus, train and subway, however, some other modalities have been popularized around the world, many being implemented in Brazil, such as BRT (Bus Rapid Transit), it is a transport similar to the bus that works in a system based on the elimination of any and all possible interference on the road, such as passenger vehicles, with a vehicle that operates in an exclusive lane, so it is a faster travel alternative for passengers (REIS et al , 2014). The BRTs had their operations initially implemented in Curitiba (Brazil) and Bogotá (Colombia) and expanded their operation to several cities in the world, considered an efficient and fair-priced transport is increasingly known as one of the most viable transport service
solutions of quality, becoming an alternative for urban mobility, Curitiba was a milestone in this pioneering project, according to the Ministry of Cities (2008).
2.2 Urban Mobility
According to Duarte and Libardi (2007), the accelerated growth of urban centers and the increase in the number of individual transports intensified the conflicts between different modes of displacement. Thus, urban planning has a relevant role in mobility, as well as its relationship with land use, environmental issues and city planning.
At the beginning of the twentieth century, the number of vehicles in circulation was low and traffic problems related only to police and bureaucratic issues. When the problem of circulation in the city center began to worry the ruling layers, road and urban plans emerged to decongest traffic (VASCONCELLOS, 2013).
The issue of mobility has been present in Brazilian cities since the 20th century, a period of demographic expansion essentially in the Southeast region of Brazil, due to large demographic flows of populations in search of jobs or better living conditions (CASTIGLIONI, 2020; VASCONCELLOS, 2013). However, this phenomenon worsened with the massification of private cars, which became part of the daily life of ordinary people, both for work and study, and for leisure, thus, the permitted capacity was overcome and cities began to suffer several problems socioenvironmental (STUCHI; PAULINO, 2020; VASCONCELLOS, 2013). Such problems are faced particularly by populations located in the Global South (BANISTER, 2008; LIN et al; MRKAJIC and ANGUELOVSKI, 2016).
The described uncertainty starts to directly affect the populations of large cities that spend more time on their daily commutes (ANGUELOVSKI, 2018; RTVELADZE, 2013). They use means of transport with low levels of comfort, which make locomotion unfeasible, and which disrespect fundamental rights and guarantees, that of 'coming and going', guaranteed by the Constitution (BRASIL, 2008).
2.3 History of CPTM
CPTM had its creation authorized by Law No. 7,861, of May 28, 1992, according to which, the new Company should take over the train systems of the Metropolitan Region of São Paulo (RMSP) to replace CBTU - Companhia Brasileira de Trens Urbanos (Superintendence of Urban Trains of São Paulo STU / SP) and FEPASA - Ferrovia Paulista S / A, in order to ensure continuity and improvement of services (CPTM, 2019a). In the beginning, operations were precarious, passengers were transported with open doors, with compositions with low levels of comfort, which portrays a situation of inefficiency, the population often did not trust the operations and were afraid to move on their lines, the company lacked reliability.
In April 1994, the company started operating effectively the current Lines 7, 10, 11 and 12, in 1996, effectively started operating the current Lines 8 and 9, and in 1998, 48 reformed trains (three cars) arrived from Spain that they start operating on Line E (currently Line 11) and then have been removed for Lines C and D (current Lines 9 and 10).
In 2000, the Expresso Leste began to operate with new trains equipped with air conditioning, anatomical benches and ambient music, thus the operation of four modern stations began: Corinthians-Itaquera, Dom Bosco, José Bonifácio and Guaianazes.
In 2004, the free integration at Estação Luz began, in 2005 construction began on the stations Jardim Helena, Jardim Romano and USP Leste (Line F, currently 12 Safira), Autódromo, Interlagos and Grajaú (Line C, current Line 9 Emerald).
In 2008, in order to reaffirm the decision of the State Government to integrate the subway network in the Metropolitan Region of São Paulo, CPTM lines gained new names and colors, based on precious stones: Line A became Line 7 Rubi; Line B became Line 8 Diamond, Line C became Line 9 Emerald; Line D became Line 10 Turquoise, Line E became Line 11 Coral; and Line F became Line 12 Sapphire.
The new USP-Leste, Comendador Ermelino, Jardim Romano (Line 12 Sapphire), Primavera-Interlagos and Grajaú (Line 9 Esmeralda) stations were opened in 2014, Extension of Line 8 - Diamond, which added another 6.3 km to the CPTM operational network and two more stations: Amador Bueno and Santa Rita, Line 7 - Rubi gains a new Franco da Rocha Station (reconstructed).
And still in 2018, the first railroad connection with Guarulhos takes place, Line 13-Jade, integrated with Line 12-Safira, the new line is 12.2 km long and has three stations: Engenheiro Goulart, Guarulhos-Cecap and Guarulhos Airport (CPTM, 2019a).
3 METHOD
The nature of the research consists of quantitative analysis, which considers the ideal verification in comfort level in the coral line of CPTM. To this end, we seek to demonstrate mathematically the situation of the operation and the comfort offered and the possible solutions to the service offered by the company.
We will use the method of number of trips per period of passengers that can support the research, in order to prove the proposed theme, thus, it will be necessary to use accurate data about the operation and operation of the line, data that will be used based on CPTM, and complementary literature.
Dimensioning a vehicle fleet is to define the number of vehicles to meet the transport demand with the best relation between the cost and the benefit offered by the vehicle that is part of the fleet. The mathematical model used follows the approach of Valente et al (2008), see Formula 1.
𝑄𝑉𝑃 =
𝑇𝑇𝑃𝐼 (1)
QVP = Number of trips per period TTP = Total Period Time
4 RESULTS AND DISCUSSION
CPTM's Coral Line, Line 11, starts at the East-West Viaduct and extends to CPTM's Guaianases station, which is approximately 28 km long. Through this route, the largest volume of traffic passes, bound for the center and other regions of the city of São Paulo; commuting has commuting characteristics, as it occurs in the neighborhood-center direction in the morning and in the center-neighborhood direction in the afternoon (DARONCHO et al, 2016).
In recent years, the Company has improved its comfort levels, from the beginning to the present, the improvements have been numerous, however for the trip to be pleasant, six passengers per m2 are stipulated as the maximum occupancy limit with comfort and safety, for closed places or events (NUGEM, 2012).
The operation of the lines keeps the stations open from Sunday to Friday, from 4 am to midnight, and on Saturdays from 4 am to 1 am, one way, from downtown São Paulo to the neighborhoods and municipalities of the Metropolitan Region (CPTM, 2019b ).
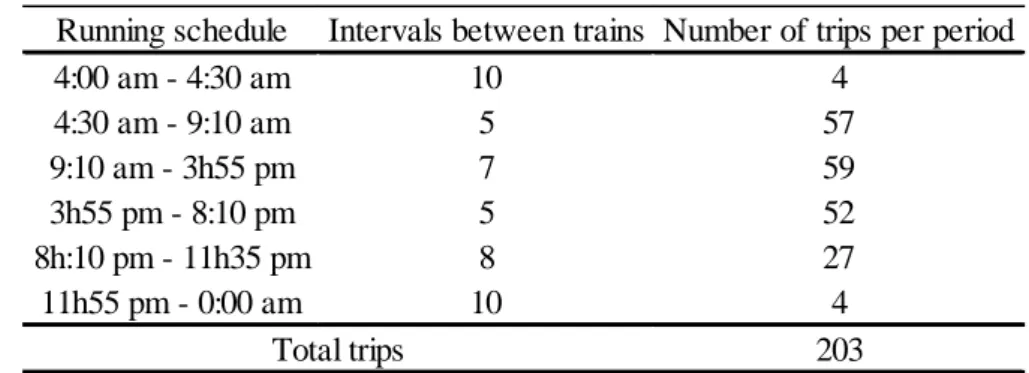
According to the official website of CPTM, line 11 Coral, operates from 4:00 am to 0:00 am, which results in 1200 minutes, as shown in Table 1.
Table 1 – Line 11 Coral trips
Source: CPTM, 2019 – Adapted by the authors
As shown in Table 1, line 11 Coral, is divided between periods, and for each period there is a different time interval and this generates a consequent relationship with the demand for the period, that is, the greater the demand in the period, the less time interval and more trips will be taken. Thus, the average number of trips made on this line is around 202, which apparently seems to be a relatively high number, since if the average capacity of trains on line 11 is verified, it gives a total of 2,600 passengers, since they represent 525 thousand passengers per day.
Figure 1 shows that in 2017 the service was already insufficient, as the numbers are much higher than the capacity supported by the line itself, the data for 2018, reflects an increase of 4.1% over the previous year, and the trend is that this number gets higher in the year 2019.
Running schedule Intervals between trains Number of trips per period
4:00 am - 4:30 am 10 4 4:30 am - 9:10 am 5 57 9:10 am - 3h55 pm 7 59 3h55 pm - 8:10 pm 5 52 8h:10 pm - 11h35 pm 8 27 11h55 pm - 0:00 am 10 4 203 Total trips
Figure 1 – Average daily passenger
Source: authors
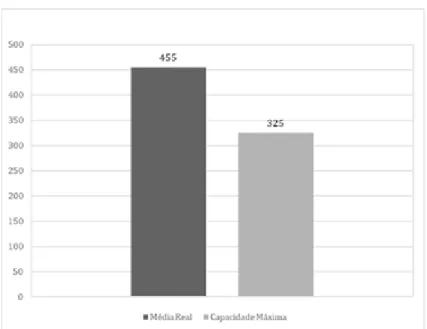
The average number of passengers per day is currently more than 25% above the maximum capacity of the train. This can be seen in Figure 2, the wagon has a capacity of 325 passengers, including those who are standing and those who are seated, according to the survey, the average number of passengers on the line per car today is around 455 passengers.
Figura 2 – Passenger per wagon
The actual average shown in Figure 2 shows that the line's capacity is insufficient. The ideal for acceptable comfort would be six people per square meter, however, according to the analysis made, it reaches up to almost nine people per square meter, regardless of peak hours.
Currently, the trains run with eight wagons with a maximum allowed capacity of 2,600 passengers. Operation with optimal comfort levels should be 325 users per car, with the current average of 3,748. Thus, it is necessary for each train to have at least four extra wagons in order to meet the acceptable standards in a way that does not affect the user's health as shown in Figure 3. In total there are 1,035 passengers under real capacity.
Figure 3 – Passenger division by wagon
Source: authors
Figure 3 represents a simulation of the ideal number of passengers per car, which would serve the service with quality, which reduces possible problems, as directed by health organizations.
It contains 209,600 passengers under capacity, 81 more trips would have to be made as shown in Table 2.
Table 2 – Fleet Sizing
Passenger flow Train Capacity Travel flow
209.600 2.600 81
Thus, the way of operating the trains would flow better, as there are many factors that impact the time of transport with overcrowding, such as users who hold the door when it closes, this further delays travel and decreases efficiency .
Maiellaro (2017) highlights the importance of the insertion of quality tools, says it is fundamental in decision making, and replication of real events, thus, the use of simulation helps in decision making, which obtains cost savings, since we can test the model studied several times before making any real changes to the system.
The literature helps us to reflect on the situation of urban mobility and seeks to propose viable solutions for solving problems that contemplate more sustainable modes. Since the number of motor vehicles is still very large in large cities.
Brazilian cities were adapted for the automobile, thus, the roads were expanded in response to this type of modal, which values the use of the automobile above public passenger transport (DUARTE; LIBARDI, 2007). A fact that makes the use of automobiles increasingly increasing.
CPTM aims at a more effective participation in the city of São Paulo, aiming gradually to reduce the number of vehicles on the streets, in addition to offering services with high quality standards, it will be contributing to the reduction of pollutant gas emissions, since the majority of automobiles use ethanol or gasoline.
Another viable solution is the metro, but it works in some periods with high capacity. According to Gregori (2017), subway operations at peak times operate with 10 to 11 passengers per square meter, a fact that makes the user opt for individual automotive transport. In view of this, it is noted that rail transport works with high capacities.
However, CPTM data indicate that the service levels offered, compared to data obtained in the 1990s, are much higher. Thus, we can see the remarkable evolution of the train company (CPTM, 2017).
The fleet renewal demonstrates another qualitative leap in the company. CPTM report (2017) shows that the average age of the fleet is 15 years, with 67.8% of cars under 10 years old. The renovation of trains is the result of acquisitions made in recent years, which has increased the comfort and safety of users' travel. The older ones were replaced by others, equipped with air conditioning, accessibility items, modern visual communication and video surveillance system. Today, 85% of the 1,474 cars in the 197-train operating fleet already have these characteristics. The maintenance policy adopted for years, provides for the outsourcing of the services of the vast majority of the fleet.
Quality criteria are required of the contracted companies, measured by indicators of availability, reliability and maintainability. In case of non-compliance with the contracted indices, penalties are applied. The older trains and part of the new ones are maintained by CPTM employees, as a way to preserve the technological dominance of the company and its technicians. The MKBF indicator (average mileage between failures), traditionally used to measure maintenance performance, shows recovery since 2014, with an 18% improvement between 2016 and 2017 in the metric that covers failures that generate operational losses.
In a study carried out in the United Kingdom, Oliveira (2019) reports that transporting such high volumes of passengers provides its own challenges. One factor that contributes to the perception of overcrowding in the railway sector is concentrated boarding, a phenomenon that occurs when passengers gather at points of access to station platforms, or near stairs. The research attempted to quantify the number of passengers passing through doors at any given time and proposed layout changes for the platform and trains. It aims to understand the impact
of boarding and disembarking, and to calculate how long it takes for all passengers to leave or board the train.
The digital age continues its advance, which brings with it remarkable technological possibilities. Lyons (2018) discusses how the urban mobility of the future could be transformed with the application of technology. According to the author, smart urban mobility designates the ease, convenience, accessibility of traveling to the destination with minimal impact on the environment and others.
For Xia (2018) the application of Big Data would allow exploring patterns of human mobility with multiple sources that would play an important role in the analysis of the formation of socioeconomic phenomena in smart cities. Its analysis is based on two sets of real data generated by card transactions, Shanghai GPS routes, which contain more than 451 million commercial records on 14 subway lines and 34 billion GPS records on 13,695 taxis, with the aim of create an integrated analysis method to find the characteristics of human mobility in Shanghai, China.
CPTM in its years of operation managed to make a qualitative leap in the evolution of technologies, started to guarantee services of high standard, mainly in security and insertion of information technology services. However, the large volume of users in CPTM operations makes many passengers opt for individual transport, which generates numerous car indices in the city.
5 FINAL CONSIDERATIONS
CPTM is the company responsible for managing the transport of trains in the metropolitan region of São Paulo, started operations in the 1990s, replacing the old CBTU. In the early years the service was deficient, however it was structured and systematically started to operate with quality, so the number of users has suffered a relative increase in recent years. The trains started to operate with high capacities, the acceptable rate for health organizations is six passengers per meter m2, the operation has an average of nine passengers m2 and at peak times there are 11 passengers per m2.
The study showed that this increase in the number of passengers caused overcrowding in the trains during trips which causes low levels of comfort for its users during trips. The number of passengers on the platforms at peak times is very large which makes passengers wait 2 to 3 trains to make their trips.
6 REFERENCES
BANISTER, D. The sustainable mobility paradigm. Transport policy, v. 15, n. 2, p. 73-80, 2008.
BRASIL. Ministério das Cidades. Implantação de sistemas de transporte acessível. Brasília. Brasil Acessível: Programa Brasileiro de Acessibilidade Urbana, 5, 2008.
BRASIL. Ministério das Cidades. Manual de BRT - Bus Rapid Transit - Guia de Planejamento. Brasília: Ministério das Cidades. 2009.
CASTIGLIONI, A.H. Transição urbana e demográfica no Brasil: características, percursos e tendências. Ateliê Geográfico, v. 14, n. 1, p. 6-26, 2020.
CAVALETT, O. From political to climate crisis. Nature Climate Change, v. 8, n. 8, p. 663-664, 2018.
CONFEDERAÇÃO NACIONAL DO TRANSPORTE – CNT. Disponível em:> http://cms.cnt.org.br/Imagens%20CNT/PDFs%20CNT/2016%20CNT%20Pesquisa%20Metro ferrovi%C3%A1ria%20(web).pdf, 2016> Acesso em: 30 jan. 2019.
COMPANHIA PAULISTA DE TRENS METROPOLITANOS - CPTM. Disponível em:> https://www.cptm.sp.gov.br/a-companhia/Pages/Nossa-Historia.aspx> Acesso em: 30 jan. 2019a.
COMPANHIA PAULISTA DE TRENS METROPOLITANOS - CPTM. Disponível em:> https://www.cptm.sp.gov.br/sua-viagem/Documents/L11.pdf> Acesso em: 30 jan. 2019b. DARONCHO, C.; RODRIGUES, G.; GALVES, M. L. Estruturação do problema de escolha do modal de transporte público na avenida Radial Leste, em São Paulo. Revista dos Transportes Públicos-ANTP-Ano, v. 38, p. 1º, 2016.
DE FREITAS LOUBACK, N. J.; DE SOUZA, R. A.; DE SOUZA, J. C.; DE OLIVEIRA, R. D. C. M.; MOREIRA, R. A. Planejamento estratégico: o desafio da mobilidade urbana na cidade de Manhuaçu (MG). Pensar Acadêmico, v. 16, n. 1, p. 64-87, 2018.
DOS REIS, J. G. M.; DE OLIVEIRA LIMA, J.; MACHADO, S. T.; FORMIGONI, A. Bus Rapid Transit (BRT) como solução para o transporte público de passageiros na cidade de São Paulo. INOVAE-Journal of Engineering, Architecture and Technology Innovation (ISSN 2357-7797), v. 1, n. 1, p. 83-98, 2014.
DUARTE, F.; LIBARDI, R. Introdução à mobilidade urbana. Curitiba: Jurua Editora, 2007.
FURTADO, A. C. Direito ao Transporte na Constituição Federal brasileira de 1988: A bicicleta como meio de transporte alternativo para a mobilidade urbana. Fibra Lex, n. 4, 2018.
GREGORI, L. A luta pela universalidade das políticas públicas de transporte. Revista de Políticas Públicas, v. 20, p. 117-126, 2017.
LIN, X.; WELLS, P.; SOVACOOL, B. K. Benign mobility? Electric bicycles, sustainable transport consumption behaviour and socio-technical transitions in Nanjing, China. Transportation research part A: policy and practice, v. 103, p. 223-234, 2017. LYONS, G. Getting smart about urban mobility–aligning the paradigms of smart and sustainable. Transportation Research Part A: Policy and Practice, v. 115, p. 4-14, 2018. MAIELLARO, J. R.; Marins, A.; DA SILVA, B. P.; DA SILVA, F. F.; DA SILVA, H. A.; DE MELO ALMEIDA, N. L. O uso da simulação como apoio à decisão no setor de chek-in no aeroporto de Guarulhos. South American Development Society Journal, v. 2, n. 4, p. 102-117, 2017.
MRKAJIC, V.; ANGUELOVSKI, I. Planning for sustainable mobility in transition cities: Cycling losses and hopes of revival in Novi Sad, Serbia. Cities, v. 52, p. 66-78, 2016.
NUGEM, R. D. C.; SANTOS, C. H. S.; DE OLIVEIRA, C. C. Transporte Coletivo e Saúde: Uma questão de gestão. Revista da Universidade Vale do Rio Verde, v. 10, n. 1, p. 186-198, 2012.
OLIVEIRA, L. C.; FOX, C.; BIRRELL, S.; CAIN, R. Analysing passengers behaviours when boarding trains to improve rail infrastructure and technology. Robotics and Computer-Integrated Manufacturing, v. 57, p. 282-291, 2019.
RTVELADZE, K.; MARSH, T.; WEBBER, L.; KILPI, F.; LEVY, D.; CONDE, W.; BROWN, M. Health and economic burden of obesity in Brazil. PloS one, v. 8, n. 7, p. e68785, 2013.
STUCHI, S; PAULINO, S. Inovação em serviços para mobilidade ativa e promoção da qualidade ambiental. Revista Gestão & Sustentabilidade Ambiental, v. 9, n. 1 esp, p. 626-650, 2020.
TORRES, I. G. E. Transporte público urbano. São Paulo: Rima, p, 09-16, 2004.
VALENTE, A. M.; PASSAGLIA, E.; CRUZ, J. A.; MELLO, J. C.; CARVALHO, N. A.; MAYERLE, S. Qualidade e produtividade nos transportes. São Paulo: Cengage Learning, 2008.
VASCONCELLOS, E. A. Mobilidade urbana: O que você precisa saber. São Paulo: Companhia das Letras, 2013.
XIA, F.; WANG, J.; KONG, X.; WANG, Z.; LI, J.; LIU, C. Exploring human mobility patterns in urban scenarios: A trajectory data perspective. IEEE Communications Magazine, v. 56, n. 3, p. 142-149, 2018.