ELSEVIER
Jmtnx~/ of Food E~~guwc~;r~g 30 (IY’JO) 36)3-37f? Copyright 0 1406 Elscvier Science Limited Printed in Great Britain. All rights rcccncd 0x0-X774/Y6 $15.00 t 0.00 Pll:SO260-8774f96)00016-7
Characterization of Requeijgo and Technological
Optimization of its Manufacturing Process
M. E. Pintado, J. A. Lopes da Silva & F. X. Malcata”
Escola Superior de Biotecnologia, Universidade Catblica Portuguesa, Rua Dr. Antbnio Bernardino de Almeida, 4200 Porto, Portugal
(Received 28 June 19%; accepted 3 February 1996)
ABSTRACT
In attempts to characterize Portuguese whey cheese (Requeijao) and optimize the manufacture thereof I7 whey cheeses were produced according to a factorial design using heating time, heating temperature and fractional addition
of ovinelcaprine milk as manipulated technological variables. Chemical
analyses were carried out for the 17 cheeses, whereas sensorial and rheological analyses were carried out for eight selected whey cheeses and a reference (i.e. a whey cheese produced locally according to traditional procedures). A true local maximum exists for moisture content (at a temperature of about 93°C heating time of about 30 min and addition of about 17% ovine milk) which lies well within the range chosen for expen’mentation. Fat content of Requeijao was positively affected by heating temperature (especially via its quadratic effect) and, to a lesser extent, by heating time (especiallv via its linear effect); nitrogen content was especially affected by heating temperature (via its quadratic effect); and moisture content was aSfected especially by heating temperature (via its quadratic effect). The sensorial analyses showed that the eight whey cheeses produced were prefewed with respect to the reference whey cheese. For
rheological analyses the most significant observations pertain to the high strain dependence of the dynamic moduli, absence of a true equilibrium storage modulus, and relatively low difference between the loss and the storage modulus. Copyright 0 1996 Elsevier Science Limited
NOTATION BSA Bovine serum albumin
FPLC Fast protein liquid chromatography IgG Immunoglobulin G
r-La x-Lactalbumin
“Author to whom correspondence should be addressed. 363
364 M. E. Pintado et al.
8-k
P-LactoglobulinINTRODUCTION
During recent years extensive efforts have been implemented in developing new methods, and extending existing ones, with the purpose of upgrading whey, the major by-product of cheese and casein manufacture industries (Mathur & Shahani, 1981). Most whey is still disposed of into the public sewage, but such option implies not only a loss of excellent nutrients for human consumption (e.g. whey protein, lactose and minerals) but also results in pollution of fresh water supplies (due to the high biochemical oxygen demand of whey).
Precipitation by heat processing still remains the simplest method to recover proteins from sweet and acid wheys. Such a process encompasses aggregation phenomena which are preceded by the unfolding and denaturation of protein (Hill et al., 1982; Mangino, 1992; Mulvihill & Kinsella, 1987; Pearce, 1989). Ricotta is probably the oldest and the best known whey cheese in which protein is recovered by heat precipitation, and several processing parameters have been studied with respect to their effect on the final characteristics (Vodret, 1970; Mathur & Shahani, 1981; Weatherup, 1986; Modler, 1988; Pereira et al., 1988). In Portugal there is a tradition regarding manufacture of a whey cheese called Requeijao, especially with ovine whey. The importance of dairy sheep is currently increasing in the Mediter- ranean Basin (Mills, 1986): although in the distant past Requeijao was sold door-to-door in limited regions of the interior of Portugal, nowadays it is an ubiqui- tous food speciality sold in plastic packages at virtually every supermarket (Santiago, 1993). Although there is a surplus of bovine milk in Europe and so its price is below that of small ruminants’ milks, it should be emphasized that Requeijao manufac- tured with ovine milk whey is organoleptically much better than its bovine counterpart, and a concomitantly higher demand allows a higher final retail price which compensates for the higher cost of the feedstock.
The traditional method of manufacture of Requeijao consists in heating the starting material, i.e. ovine whey or mixtures thereof with ovine or caprine milk, at a temperature ranging from 90 to 100°C for about 30 min under smooth stirring conditions. The curd rises spontaneously to the surface and is scooped into plastic molds and allowed to drain and cool for several minutes. This manufacture protocol uses technological conditions determined empirically and no consistent scientific study attempting to quantitatively describe the influence of each processing param- eter on the final product properties has appeared to date. The objective of this research effort was to characterize Requeijao so as to gain a deeper insight into such a product in terms of technological parameters, and consequently determine how to change its manufacturing conditions in order to optimize its (quality-related) characteristics.
MATERIALS AND METHODS Reagents
Purified proteins from bovine milk (Z-La, p-Lg, BSA and IgG) were purchased from Sigma (USA), whereas NaCl, Na2HP04, NaH,PO,, HCI, NaN,, H2S04, NaOH and
isoamilic acid were purchased from Merck (Germany). Ovine whey was obtained from bulk manufacture of Serra cheese (a traditional Portuguese ovine cheese prepared via enzymatic coagulation of raw ovine milk using a plant rennet). Ovine milk was obtained from a flock of Bordaleira sheep and caprine milk was obtained from a flock of Serrana goats.
Equipment
Filter paper (pore size 0.22 /lrn) was purchased from Nucleopore (USA). The FPLC system (Pharmacia) utilized for protein separation consisted of two P-500 positive displacement pumps, an electrically-powered MV-7 motorized valve, a gel filtration column prepacked with Superose 12 HR 10130, a UVl single path spectrophot- ometer monitor, a REC-102 double channel recorder, and an LCC-500 controller. Thermostatted centrifugation for the determination of fat content was achieved in a Norma Milk G centrifuge (Italy). Total nitrogen was determined using the Micro- kjeltec system from Tecator (Sweden). Moisture content was determined using an oven from Heraeus (Germany). Dynamic rheological characterization was per- formed using a controlled stress rheometer (Carri-Med CS-SO, UK) fitted with a parallel plate device (gap, 3 mm and plate diameter, 2 cm).
Preparation of whey cheeses
Seventeen different whey cheeses were manufactured from a single, pooled batch of 40 litre of whey. Of these 17 whey cheeses, eight were produced according to all possible combinations of two levels of temperature (90 and 95’33 two levels of heating time (30 and 60 min), and two types of addition of milk (lO%(v/v) of caprine milk and 10% (v/v) of ovine milk using initial volume of whey as reference); three were produced at 9O”C, 45 min and without any addition of milk (thus corresponding to a central point); and the remaining six were produced as axially laid experimental counterparts (see Table 1).
The manufacture of each plain whey cheese required 1250 ml of whey. (Using experimental protocols detailed in the next subsection, one could conclude that the ovine whey used as feedstock had the following composition: 0.3O%(w/w) nitrogen content, 1.25%(w/w) fat content and 91.4%(w/w) moisture content.) For whey cheeses where whey was blended with milk, 125 ml of whey were substituted by milk from the appropriate source. (Using experimental protocols detailed in the next subsection, one could conclude that the ovine and caprine milks used as feedstocks had the following composition: O-95 and 0.7.5%(w/w) nitrogen content, 8.40 and 38O%(w/w) fat content, and 83.3 and 88.4%(w/w) moisture content, respectively.) The glass vessel with the whey (or mixture of whey and milk) was heated to l-he appropriate temperature for the appropriate heating time (see Table 1) in a water bath. The proteinaceous coagulum was, upon formation, recovered from the upper layer of hot whey and poured into plastic molds, slightly pressed and left to drain and cool to room temperature for 2 h under a cover (in order to reduce contamina- tion), and finally left to drain for 24 h at 4°C. Rheological and sensorial analyses were carried out on fresh whey cheese portions after this time period had elapsed and the remaining portions were kept frozen at -20°C until further chemical ana- lyses. A whey cheese manufactured in loco using traditional procedures was used as a reference for assays of the experimental whey cheeses. [Using experimental proto-
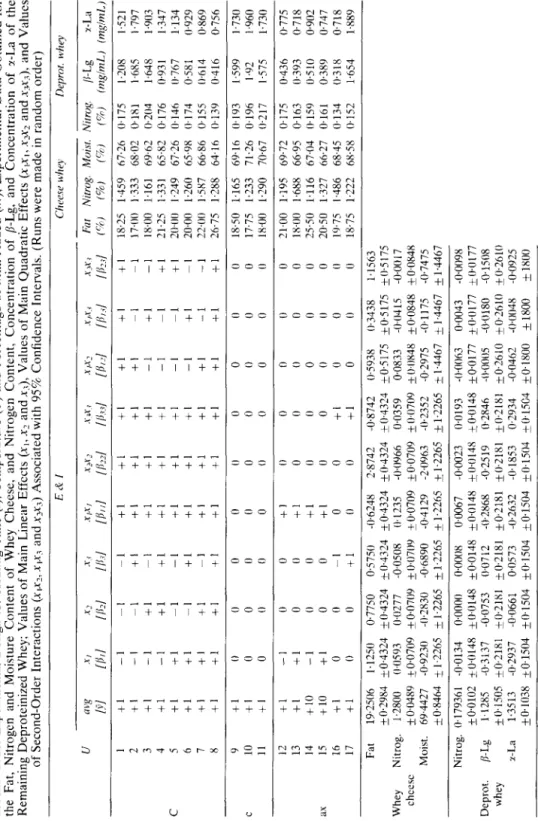
TABLE 1 Second Order Experimental Design for Heating Time (t), Temperature (7) and Percentage of Milk Added (m); Experimental Data Obtained for the Fat, Nitrogen and Moisture Content of Whey Cheese, and Nitrogen Content, Concentration of p-Lg, and Concentration of r-La of the i;i Remaining Deproteinized Whey; Values of Main Linear Effects (xl, x2 and x3), Values of Main Quadratic Effects (x,x1, xgz and x.+~), and Values ~ of Second-Order Interactions (X,X,. xix3 and x_s3) Associated with 95% Confidence Intervals. (Runs were made in random order) E&I Cheese whej Dqmt. whey I!/ ‘1 vg x2 .x,x/ X$2 s c\’ < x ,x2 I PY.3 Fat Nirrog. Moist. Nirrog, /I- Lg x-La l,il Ihl [P/i1 [/~22/ llhl IBid Il~,.+l F/r) IQ) m) (7P) ~mglmL) (rnglmL) 1 +I -1 -I -1 +1 +1 +I fl +1 +1 18.25 1,459 h7.26 0.175 I.208 1.52 1 2 +1 -I -1 +I +I +1 +1 +I -1 -1 17.1)0 I.333 68.02 @1X1 1.6X5 1.797 3 +I -1 +1 -I +l +I +1 -1 +I -1 1X.00 1,161 69.62 0,204 1,648 1.903 4 +1 -1 +I +1 +I +I +1 -1 -1 +I 21.25 1.331 65.82 0,176 0.93 1 I.347 5 +1 +I -1 -1 +I +l +1 -1 -1 fl 2OGO I.249 67.26 0.146 0.767 1.134 6 +I +l -I +1 +I +I +I -I +I -1 20.00 I.260 6598 0.174 0.581 0.929 7 +1 +1 +1 -1 +I +l +1 +1 -I -1 22w 1.5X7 66.86 0,155 0%14 0.869 x +1 +1 +1 +1 +l +I fl +1 +I +1 26.75 1,288 64.16 0.13’) 0.410 0.756 Y +1 0 0 0 0 0 0 0 0 0 18.50 1,165 69.16 0.193 1.599 I.730 10 +1 0 0 0 0 0 0 0 0 0 17.7.5 I.233 71.26 0.196 I.02 1 .Y60 is 11 fl 0 0 0 0 0 0 0 0 0 1X.00 I.290 70.67 0.217 1 .s7s 1.730 .h 12 +I -1 0 0 +I 0 0 0 0 0 21.00 I.195 69.72 0.175 0.436 0.775 13 fl +1 0 0 +1 0 0 0 0 0 lRO0 16Xx 66.95 0,163 3 0.393 0.718 g I4 fl0 -1 0 0 +1 0 0 0 0 0 25.50 1.116 67.04 0.159 0.510 0,902 IS + 10 +1 0 0 0 20.50 % +1 0 0 0 0 1.327 66.27 0.161 0.389 0.747 16 +1 0 0 -1 0 0 +I 0 0 0 14.75 I.486 68.45 O-134 0.31x 0.718 2 17 +1 0 0 +1 0 0 +I 0 0 0 18.75 1,222 6X.5X w 0.152 1,654 1.8X9 7 Fat 19.2506 1.1250 0.7750 0.57.50 -0.6248 2.8742 -0.8742 05938 0.3438 1.1563 i0.2984 i-O.4324 iO.4324 kO.4324 kO.4324 kO.4324 kO.4324 kO.5175 iO.5175 +0.5175 Whey Nitrog. I.2800 0.05Y3 0.0277 -0.0508 0.1235 -0~0066 0.0359 0.0833 -0.04 15 -0.00 17 chew k 0.048Y f 0.0709 + 0.0709 f 0~07OY t_ 0.0709 kO.0709 i lbO7OY +0.0X48 kO.0848 k 0.0X4X Moist. 69.4427 -0.9230 -0.2X30 -0.6890 -0.4129 -2VJ63 -0.2352 -0.2975 -0.1175 -0.7475 kO.8464 + I.2265 +I.2265 k1.2265 ? 1.2265 k1.2265 k1.2265 i 1.4467 + 1.4467 k1.4467 Nitrog. 0.179361 -0.0134 0.0000 0~0008 0.0067 -0.0023 0.0193 -0~0063 0.0043 -0.0098 +0,0102 F0.0148 +0.0148 kO.0148 kO.0148 *0.014X kO.0148 kO.0177 +0~0177 ~0~0177 Deprot. /j-Lg 1.12X5 -03137 -0.0753 0.0712 -0.2868 -0.2519 0.2846 -0~0005 -0Q180 -0.1508 whey +O.lSOS kO.2181 *0.21X1 iO.2181 +0,2181 +0.21X1 +0.21X1 kO.2610 kO.2610 +0.2610 r-La 1.3513 -0.2Y37 -0.0661 0.0573 -0.2632 -0.1853 0.2934 -0.0462 -0.004X -0.0925 +0.103X +0,1504 +().I504 iO.1504 i-O.1504 +0.1504 ~0~1504 +0.1800 k1800 + 1800 Note: ax-axial points; c-Center points; C-Comer points; EE-Estimated Effects; E&I-Effects (linear and quadratic) and Interactions (second order); U-rLJn; x,. Normalized value of heating time, defined as (l-45)/15, where t is exprcsscd in min; nZ-Normalized temperature, defined as (T-925)/2,5, where T is expressed in “C; a?-Normalized percentage of goat’s milk, defined as (rn-O)/lO, where m is expressed in %.
cots detailed in the next subsection, one could conclude that such reference whey cheese had the following composition: 59*O%(w/w) moisture content, 295% (w/w) fat content and 1.33%(w/w) nitrogen content.]
Chemical analyses
The moisture content of Requeijao was determined according to the IDF method (FILIIDF 4: 1958). The fat content of whey was determined using Gerber’s butyro- metric determination (Portuguese standard NP 469). The fat content of whey cheese was determined using Van Gulik’s butyrometric determination (Portuguese Standard NP 2105). The nitrogen contents were determined according to the IDF method (FIWIDF 20B: 1993) adapted to micro conditions by using one tenth of all samples and reagents. The measurements of fat, nitrogen and moisture contents of whey cheese are shown in Table 1.
Determination of p-Lg and r-La concentrations was carried out by injecting 100 ,uI of deproteinized whey, eluting using a 0.05 M phosphate buffer at pH 7.0 containing 0.15 M NaCl (used to correct ionic strength) and 0.2 gilitre of NaN, (used as a preservative) at a flow rate of 0.4 mlimin and detecting by reading absorbance at 280 nm. Prior to chromatographic analysis, the sample and eluting buffer were filtered through titter paper and degassed. Quantitative calibration, done in terms of bovine whey proteins, was performed using various dilutions of an aqueous solution containing 9.10 mg/ml of bovine x-La, 4.10 mg/ml of bovine /j-I-g. 4.9 mg/ml of bovine IgG, 6.X mg/ml of bovine BSA, 0.13 mg/ml of erotic acid and 0.018 mg/ml of uric acid. The measures of nitrogen content and of the concentra- tions of x-La and /I-Lg in the supernatant whey after protein precipitation (i.e. in the deproteinized whey) are depicted in Table 1.
Sensorial analyses
A sensorial panel was selected on the basis of the results of preliminary tests performed with the goal of recognition of basic tastes, ability to determine the intensity of basic tastes, recognition of odour and rating of texture (Stevens bi Albright, 1990). Whey cheese samples were evaluated at room temperature by t hc 1.3 panelists that met the minimum qualifications for the sensorial criteria described above. Whey cheeses were graded for firmness and smoothness based on a multiple comparison test (Meilgaard et al., 1988) using whey cheese produced according to the traditional way as a control; the scales used for both parameters ranged from I to 9 (1: ‘extremely less firm and smooth than control’, 5: ‘equal to control’ and 9: ‘extremely firmer and smoother than control’). The panelists were also requested to indicate their relative overall preference on a scale of 1 to 5 (1: ‘most preferred’.. 5: ‘least preferred’) according to a ranking test (Meilgaard ct al., 1988). Due to the large amount of samples to be tested (eight samples and one control) the taste panel met at two different periods separated by 3 h, each one including the control and four samples taken at random. The data obtained are depicted in Tahlc 2. Kheological analyses
In order to characterize the viscoelastic behaviour of Requeijao, the eight samples selected as indicated above were left at room temperature for 1 h and then cut
368 IV. E. Pintado et al.
using a cork borer so as to generate round discs with a diameter of 2-O cm and a thickness of 3 mm. Slippage was prevented by adding two drops of cyanoacrylate bonding agent and spreading evenly over the lower plate of the rheometer and over the cheese disc. The sample was covered with light oil to prevent dehydration and allowed to stand for 30 min at 20°C before the experimental test was carried out. Each experiment consisted in characterizing the frequency dependence of both the elastic component G’ (storage modulus) and the viscous component G” (loss mod- ulus) at a low strain amplitude (2%).
Mathematical analyses
The first empiric model to be tentatively fitted by linear regression to the experi- mental results listed in Table 1 for the first 11 runs has the form
9 =y+a,x, +Sl&fX$J (1)
where y is the fitted response, y is the average of all data and the QS are adjustable parameters. The xis are the technological (manipulated) variables under scrutiny in coded, normalized form, and are defined as: xl = (t-45)/15 where t is the heating time expressed in min; x2 = (T-92.5)/2*5 where T is the heating temperature, expressed in “C; and xg = (m-0)/10, where m is the percent addition of caprine milk (a negative value for m means addition of ovine milk in the same proportion instead
TABLE 2
Average Firmness and Smoothness Data Obtained from a Multiple Comparison Test and Overall Preference Data from a Ranking Test, for the Evaluation of Eight Different Whey
Cheeses using a Traditional Whey Cheese as Control
Cheese Conditions Firmness” Smoothness” Overall
Preference’. Analysis I 10% CM-90”-30 min 3.6 6.3 4 10% CM-90”-60 min 2.8 5.4 1 10% CM-95”-60 min 3.8 5.4 2 10% OM-95”-30 min 3.7 6.3 3 Control 5.3 4.7 5 Analysis 2 10% OM-95”-30 min 4.9 5.9 3 10% OM-95”-60 min 4.6 6.7 2 10% OM-90”-60 min :.: 6.6 4 10% CM-95”-60 min Control 5:2 6.1 1 5.1 5
” Scale 1-9: l-extremely less firm than control, 5-as firm as control, 9-extremely firmer than the control.
’ Scale l-9: l-extremely less smooth than control, 5-as smooth as control, 9-extremely smoother than control.
” Scale l-5: l-most preferred, 5-least preferred. CM-Caprine milk.
of caprine milk). Estimates of the sums of all quadratic effects (i.e. those including x2) for all processing parameters following the method outlined in Box et al. (1978)
have shown that second order effects were likely to be of importance; hence the experimental design had to be expanded accordingly. The experimental results for the six extra experimental points (laid out as axial points) are also depicted in Table
1. The model to be fitted by linear regression analysis to the data is then
C =\‘+/~,x_l+p~x,+p3x~$ (2)
/I, ,.uf+/~22X~+/133X~+
where the /js are adjustable parameters. The estimates obtained for all paramett:rx are tabulated in Table 1 together with their 95% confidence interval.
Differentiating eqn (2) independently with respect to xl, to _yZ and to x3, and setting the result thus obtained equal to zero provides a necessary condition for a local optimum to exist. The resulting three linear equations can, in turn, bc algebra- ically solved with respect to x,, x2 and x3, respectively; the results in terms of loci 01 the optima when variables x2 and x3, or X, and x,?, or x1 and x2, respectively, arc deliberately prefixed are depicted in Table 3. Only a true local maximum exists for moisture content (located at x, = -0.985, x2 = 0.306 and xi = -1.705), although local optima exist for combinations of every set of prefixed values of one or two process- ing variables.
Analyses of variance were implemented on the results obtained from the sensorial and rheological experiments. The results are shown in Table 4.
TABLE 3
Loci and Type of Optima with Respect to the Operating Variables Heating Time (x,). Heating Temperature (x2) and Percentage of Milk Added (x3) Associated with the Quadratic
Models Fitted to the Data Obtained for the Manufacture of Requeijao
LO TO __~ _ Whey cheese s, _YJ * i x, .t-- x ,
Fat 0~00 I + 0475.Y~ -~0~135--0~103.r, 0~32’)+o~lYhu, milx min InaY
+ 0.27s,t 1 - 0~2WU.? + oei7r~
Nitrogen ~0~240~0~337k~ Wl44-W432r, 0.706 fO~57&-, min ma min
+ 0. I h&-.2 - 0403x~ ~ 0~025.r~
Moisture - I.222 - 0~3hl.r, POG8 -0.07 Ix: ~ I.466 ~ 0.25 Is, max max max
-O.l4b-3 - 0.17Kx3 ~ I .SY 1x2
Dcproteinized Nitrogen WY6 + 04641~ 0~000 - 1.377x, 0~0208 + 0. I 17-r, min max IllilY
whey -0.3lhx~ -2.lSUXl - W2S.iw~
/I ~- Lg ~ 0~547 + 0~00 lsz ~ 0.14’) ~ 0a.l IX, ~~0.125 +WO32w, milx max min
- 0.03 lu.3 - 0.07Cu-r + W?hSXSx_
r - La 0~559 -- 0Gek~ ~0~178+0~125..r, ~ 0+97 + WOOfk, miix max min
- O~OOY.~~ + 0~25(k, +0~157X~
370 M. E. Pintado et al.
TABLE 4
ANOVA Table for Organoleptic Data Expressed as Firmness and Smoothness and for Rheological Data Expressed as Storage Moduli G’ and G” Obtained at (I) = 0.1 radis
Source of variation Degrees qf freedom Sum of squares Mean square F-ratio
Firmness Samples Panelists Error Smoothness Samples Panelists Error G’ Treatments Error G” Treatments Error 9 75.66 8.41 5.71 12 35.83 2.99 2.03 108 158.94 1.47 9 52.27 5.81 3.18 12 49.91 4.16 2.28 108 197.32 1.83 2053 689 2053 689 1.76 9350611 1168826 288 800 288 800 3.39 681337 85 167
RESULTS AND DISCUSSION
During manufacture of whey cheeses one could observe that the amount of protei- naceous coagulum produced with whey previously blended with milk was higher and the curd was more cohesive than in the absence of milk addition, an observation that was somewhat expected in view of the coprecipitation of caseins with whey proteins; similar results were obtained by Mathur and Shahani (1981). A fine preci- pitate remained in the deproteinized whey because the manufacture of Requeijao did not encompass an acidification step after the heating process.
From the nitrogen content of deproteinized whey, it can be pointed out that the yield of nitrogen in the whey cheese ranged from 53.7% of the total nitrogen of the initial whey (when whey cheese was prepared by coagulation at 95°C for 60 min with addition of 10% of caprine milk) to 32.7% of the total nitrogen of the initial whey (when whey cheese was prepared by coagulation at 92*5”C for 45 min without milk adition). These results are in agreement with Hill et al. (1982) who reported that the theoretical maximum recovery of nitrogen from whey ranges from 55 to 65% since the heat stable proteose-peptone and non-protein nitrogen account for from 35 to 45% of the total nitrogen. However, Modler and Emmons (1989) have shown that the proteose-peptone content in the deproteinized whey decreases when whey is mixed with milk, which suggests that the proteose-peptone fractions could coprecipitate with caseins.
Comparison of the traditional whey cheese used as a reference in this study with the results obtained for the experimental whey cheeses indicates that although the nitrogen content is similar, a lower moisture content and a higher fat content are exhibited by the traditional whey cheese, probably due to the higher temperature used for its manufacture.
The experimental results tabulated in Table 1 are similar to those obtained for Ricotta cheeses produced with ovine whey in Sardinia (Vodret, 1970). Inspection of
this table allows one to conclude that fat content of whey cheese is affected posi- tively by heating time (via the linear effect) and heating temperature (via both linear and quadratic effects), and by addition of milk either positively (via the linear effect) or negatively (via the quadratic effect). In terms of interactions, they are significant at the 5% level except the interaction heating time/addition of milk. Pereira et al. (1988) concluded that increases in heating rate lead to a greater retention of fat, which agrees with our observations.
For fat there is not a true local maximum (see Table 3); nevertheless, if tempera- ture is fixed at either 90 or 95°C optima are obtained at t = 51 min and rn = 2.5% ovine milk, and t = 71 min and m = 133% caprine milk, respectively. In this case the first condition would be preferable because it corresponds to conditions that ensure a higher yield. It is interesting to note that when the temperature is 95°C. the fat content in whey cheese is higher if caprine milk rather than ovine milk is added, irrespective of the heating time, a quite unexpected observation in view of the fact that ovine milk is richer in fat than caprine milk. Different interaction of whey proteins with fatty acid residues depending on the animal species in question (Perez et al., 1993) coupled with the fact that interaction between the fat globules and the gel matrix results from combination of the /GLg fraction adsorbed onto fat globules with the k--casein of the gel matrix via dissulphide bridges promoted by the heating step (Xu et al., 1992) could tentatively explain why higher amounts of milk fat are apparently released in the manufacture of ovine whey cheese with addition of one type of milk than with addition of the other type.
No linear effect of any processing variable is important for the nitrogen content of whey cheese (see Table 1); however, the quadratic effects of heating temperature and heating time are significant at the 5% level. Kalab & Modler (1985) also observed that the amount of whey protein denatured increased considerably when the heating temperature was increased. Again there is no true local optimum for this property (see Table 3), but if one sets the heating temperature to 90 and 95”c’, optima are obtained at t = 48 min and m = 8.2%) caprine milk, and t = 37.5 and
m = 4.4% caprine milk, respectively.
The quadratic effect of temperature is the only effect that is statistically signiti- cant at the 5% level for the determination of the moisture content of whey cheese. Vodret (1970) reported that differences in the moisture content of whey cheeses could be consistently related to precipitation temperature. A true global maximum exists for this parameter in whey cheese (see Table 3), namely t = 30.2 min, T = 93.3”C and m = 17% ovine milk. The moisture content exhibited a significant negative correlation with fat (Y = 0.910, results not shown).
The fraction of nitrogen in deproteinized whey is significantly affected only by the quadratic effect of milk addition. This result is consistent with conclusions by Mod- ler and Emmons (1989), namely that the addition of milk reduces the proteose-peptone content of deproteinized whey. A true local optimum could not be found once again (see Table 3), yet setting the heating time to 60 and 30 min it is possible to obtain maxima located at T = 81.8”C and m = 12.2?% caprine milk, or T = 99.5”C and m = 6.6% ovine milk, respectively.
Although the major whey proteins would eventually precipitate upon sufficiently stressing thermal processing, small amounts of x-La and p-Lg may remain in the deproteinized whey together with the heat stable fractions depending on the condi- tions employed. Both p-Lg and x-La are affected by heating time via its linear effect, as well as by all tested technological variables via their quadratic effects. Inspection
372 M. E. Pintado et al.
of Table 3 indicates that no true overall optimum exists. However, if addition of milk was preset at 10% caprine milk one would obtain t = 36.3 min and T = 91.4”C for p-Lg, and t = 36.9 min and T = 91*6”C for a-La, whereas if it were preset at 10% ovine milk one would have obtained t = 37.3 min and T = 92el“C for /3-Lg, and t = 36.6 min and T = 92*9”C for r-La. The values obtained for the optima of either protein are close enough that it should be possible to reach conditions that yield maximum recovery of both proteins.
In the performance of the organoleptic tests, a traditional whey cheese was included as a control: this control was aimed at determining whether the evaluation was impartial and consistent. From the data depicted in Table 2, it can be concluded that the traditional whey cheese used as a control scored an average of 5.3 and 5.2 for the first and second analyses, respectively; therefore, the sensorial evaluation could be labelled as good because these controls are very close to one another, which means that blocking had no effect on the accuracy of the organoleptic evalu- ation. When one compares the results for the experimental whey cheeses with those for the traditional whey cheese (control) for firmness, it is obvious that all samples are less firm than the reference, although two samples (95°C 30 min, 10% ovine milk and 95°C 60 min, 10% caprine milk, respectively) are indeed quite close to 5. Analyses of the effects of moisture using fat-free and protein-free bases (namely using the ratios (%moisture)/( 100 - %fat) and (%moisture)/( 100 - %protein)) have shown a poor correlation between these corrected measures of moisture and firm- ness, thus suggesting that differences in moisture content should be caused by protein aggregation due to temperature effects. This poor correlation could be partially accounted for by realization that the water held in a gel can be either in bound form (via adsorption forces or capillary forces) or in free form, and thus a given amount of water may give rise to different degrees of firmness upon spontane- ous shrinkage of whey proteins during heat treatments above the gelation temperature (de Wit, 1988). In general, the higher values for firmness are obtained for whey cheeses prepared at 95°C and the control is also included in this list since it is prepared nearly at boiling conditions. The effect of higher temperatures in imparting a high firmness to whey cheese has been discussed elsewhere (Hill et al., 1982).
The results for smoothness shown in Table 2 indicate that all cheeses are smoother than the control, although two of them (90°C 60 min and 10% caprine milk, and 95°C 30 min and 10% caprine milk, respectively) are rather close to the control.
Statistical analyses of the results for firmness and smoothness (see Table 4) were carried out with all samples including the control. Although for firmness a high F- ratio was found (i.e. there are differences among the firmness of the samples at the 1% level of significance), for smoothness a low F-ratio was found (i.e. there are no differences among the smoothness of the samples at the 5% level of significance).
The overall preference data displayed in Table 3 indicate that the least preferred whey cheese is the control, which suggests the existence of room for technological optimization of traditional whey cheese manufacture. Due to splitting of the organo- leptic evaluation in two blocks, it is not possible to determine the most preferred of all eight whey cheeses, but it is possible to select the two most preferred whey cheeses from each group, namely those prepared at 90°C for the first analysis and 95°C for the second, 10% caprine milk, and heating for 60 min. If one compares the firmness and smoothness of these two whey cheeses, one concludes that for the
whey cheese prepared at 90°C smoothness is close to the control and firmness is well below it, whereas for the whey cheese prepared at 95°C firmness is close to the control but balanced by a relatively higher smoothness. Inspection of the composi- tion data in Table 1 for the same whey cheeses, one finds nitrogen contents of
1.260% and 1.288%, moisture contents of 65.98% and 64.16%, and fat contents of 20.00%) and 2675% for the whey cheeses prepared at 90°C and 95°C respectively: it is apparent that the protein contents of both cheeses are quite close to one another (X.04 and 8.22%;, after multiplication by the classical correction factor ol 6.38).
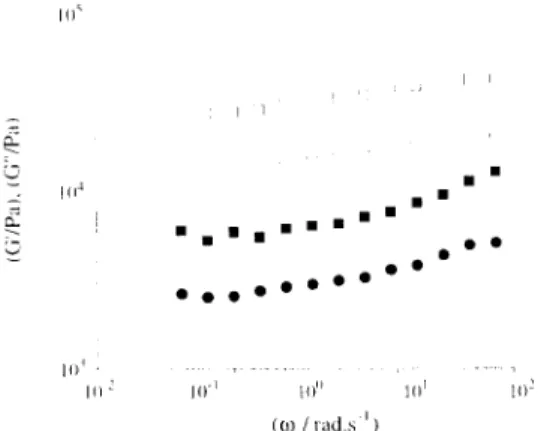
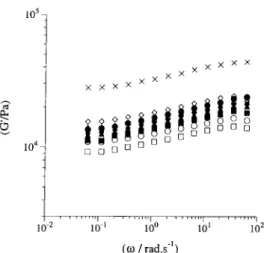
As typically found for protein coagulates (Clark & Ross-Murphy, 1987; Tunick CI (11.. 1990), the whey cheese samples tested have shown a high strain sensitivity. probably a result of the heterogeneous network formed by the proteins in the whey cheese. Typical examples of the mechanical spectra obtained for these samples are shown in Fig. 1. Qualitatively, the viscoelastic behaviour observed was similar 1’01 both the reference whey cheese and those prepared at laboratory scale using the aforementioned factorial experimental design. The storage modulus was slightly dependent upon the oscillatory frequency (Konstance & Holsinger, 1992) which can be attributed to some mobility of the elastically active protein chains that build up the gelled network. Also the difference between the two viscoelastic moduli is relatively low if compared with true gels (Clark & Ross-Murphy, 1987; Kamphuis & Jongschaap, 1985). Probably, the cross-linking density is small as a result of the relatively low protein concentration, thus preventing formation of a more elastic network, although the contribution of such other components of the whey cheese matrix as fat and calcium might also play a role in the viscoelastic behaviour of this system. Figure 2 shows the frequency dependence of the storage modulus for the whey cheeses prepared at laboratory scale as compared with the behaviour of the control whey cheese. Although qualitatively all whey cheeses tested show a similar behaviour, the control whey cheese clearly exhibits higher dynamic moduli (G’ and G”), which are likely related to a lower water content: the higher water content of the experimental whey cheeses may then be attributed to the lower precipitation temperatures employed (remember that, traditionally, whey cheese is prepared at
Fig. 1. Frequency dependence of G’ and G” viscoelastic moduli of control cheese (u-G’.W’?‘) and whey cheese prepared at 95°C for 60 min with addition of 10%’ ovine milk (:~-G’, o-G”).
374 M. E. Pintado et al.
1 “T “‘T ‘T”““, “““1
10-Z 10-1 10" 10' lo2
(w I rad.s-‘)
Fig. 2. Frequency dependence of G’ for whey cheese prepared via heating at 95°C for 30 min with addition of 10% caprine milk (o), whey cheese prepared via heating at 90°C for 60 min with addition of 10% caprine milk (o), whey cheese prepared via heating at 95°C for 30 min with addition of 10% ovine milk (w), whey cheese prepared via heating at 95°C for 60 min with addition of 10% ovine milk (+), whey cheese prepared via heating at 90°C for 60 min with addition of 10% ovine milk (o), whey cheese prepared via heating at 90°C for 30 min with addition of 10% ovine milk (A), whey cheese prepared via heating at 90°C for 30 min with addition of 10% caprine milk (A), whey cheese prepared via heating at 95°C for 60 min
with addition of 10% caprine milk (o), and control whey cheese (X).
nearly boiling temperature). These results are in agreement with those obtained for firmness in the sensory analysis, namely that the whey cheeses manufactured possess a higher firmness than the control, and they are also confirmed by the significant negative correlation of moisture content with the storage modulus (Y = OG355) and the loss modulus (Y = 0.905). Our results are also consistent with those reported by Pereira et al. (1982) who claimed that moisture content is one of the most important factors in the determination of the textural characteristics (including firmness) of a whey cheese. The observation that no important differences appear to exist between the whey cheeses prepared at different temperatures, heating times and with addi- tion of different quantities and qualities of milk, is confirmed by the statistical analyses of the rheological data (see Table 4): low F-ratios indicate that differences between the storage modulus and the loss modulus are not significant at the 5% level of significance.
CONCLUSIONS
From the above analyses, it is apparent that choice of ideal conditions for whey cheese manufacture must result from a compromise between high yield (for which most information is obtained from the deproteinized whey) and high nitrogen con- tent (for which most information is obtained from the whey cheese) since the (tentative) maxima for these two criteria do not coincide. If one attends preferen- tially to the protein (or nitrogen) enriched whey cheese (as this might drive the
preference and consequently the demand by the consumer), then the processing conditions that lead to an optimum for nitrogen content of whey cheese (i.e. T = Oo”C, t = 48 min and m = 8.2% caprine milk, or T = 9S”C, t = 37.5 min and II? = 4.4% caprine milk) would be good choices for whey cheese manufacture. If one attends to the whey cheese most preferred in the sensorial analyses, then the first condition (i.e. T = 9o”C, t = 48 min and m = 8.27~ caprine milk) will be the final choice.
ACKNOWLEDGEMENTS
Funding for author M. E. P. was provided by a Ph. D. Fellowship issued within the framework of CIENCIA (BD-2526/93-IF), administered by Junta National de Inves- tiga@io Cientifica e Tecnolbgica, Portugal. Partial funding for this project was obtained from grants by Funda@o Luso-Americana para o Desenvolvimento (Portugal-project Characterization of the protein profile in ewe’s whey), Agencia de Inova@o (Portugal-project MAQUETTE: MelhorAmento de QUEijos Tradicionais e sua TEcnologia), and program LIFE (European Commission - project GANI- MEDES: Gestao e vAlorizaq$o National por via Microbiana Especifica Dc Efluentes de Soro).
REFERENC’ES
Box. G. E. P., Hunter. W. G. Kc Hunter, J. S. (107X). S~ustistics jbr Eqwimct~ts .- ,411 Irl~roductio~l to Des@ Datu Anulysis and Model Building. Wiley, New York, pp. 5 10-535. Clark, A. H. & Ross-Murphy, S. B. (1987). Structural and mechanical properties of bio-
polymer gels. Ad\: P&m. Sci., 83, S7- t 92.
tic Wit. J. N. (1988). Functional properties of whey proteins. A review. NIZO-l,c,t:s/r,s~/t. 281, l-35.
Hill. A. R.. Irvine, D. M. & Bullock, D. H. (lY82). Precipitation and recovery of whcv proteins. A review. Curl. Inst. Food Sci. Techtwl. J., 15. 155- 160.
Kalab, M. & Modler. H. W. (IYdS). Development of microstruturc in a cream cheese ba\ed
on Queso Blanco cheese. Food Microstruct., 4, 8Y-98.
Kamphuis, H. & Jongschaap, J. J. (1985). The viscoclastic behavior of heat-set ovalhumin gels explained in terms of a transient-network model. J. Hhcol., 29, 685-708.
Konstance, R. P. blr Holsinger, V. H. (1992). Development of rhcological test methods for cheese. Food Trchnol., 46, 1 OS- 109.
Mangino, M. E. (1992). Gelation of whey protein concentrates. Food Techrzol., 46, I 16 I I II. Mathur, B. N. & Shahani, K. M. (1981). Ricotta cheese could be your best vehicle for whey.
Da& Field, 164, I IO- 1 14.
Meilgaard. M.. Civitle, G. V. & C’arr, B. T. ( lY88). Scrzsor~ EIuhufion Er~hrziqws. CRC. Fl.. pp.47-Ill.
Mills, 0. (lY86). Sheep dairying in Britain - a future industry. J. Sr)c. DuiY\. 7ivhtwI.. 39. 88-00.
Modler, H. W. (1988). Development of a continous process for the production of Ricotta cheese. J. Duiv Sci., 71, 2003-200Y.
Modlcr, H. W. & Emmons, D. B. (lY8Y). Production and yield of whole-milk Ricotta manufacture by a continous process. II. Results and discussion. Milclzwi.sserlsc.llu,ft. 44. 753-756.
Mulvihill, D. M. & Kinsella, J. E. (1087). Gelation characteristics of whey proteins and /i-Lactoglobulin. Food Tcchnol., 41. 102- 104.
376 M. E. Pintado et al.
Pearce, R. J. (1989). Thermal denaturation of whey proteins. Bull. ht. Dairy Fed., 238, 17-23.
Pereira, A. J. G., Povoa, M. E. B. & Cruz, G. R. (1982). Influ&ncia da velocidade de aquecimento sobre a qualidade do Ricotta. VII Congress0 National de Lacticinios, Juiz de Fora, Brazil.
Perez, M. D., Puyol, P., Ena, J. M. & Calvo, M. (1993). Comparison of the ability to bind lipids and serum albumin from ruminant and non-ruminant species. J. Dairy Res., 60, 5.5-63.
Santiago, L. (1993). 0 requeijao cm Portugal. Via L&tea, 2, 71-73.
Stevens, M. A. & Albright, M. (1990). An approach to sensory evaluation of horticultural commodities. Hort. Sci., 15, 48-50.
Tunick, M. H., Shieh, J. J., Bash, J. J., Thompson, M. P., Maleeff, B. E. & Holsinger V. H. (1990). Cheddar and Cheshire cheese rheology. 1. Dairy Sci., 73, 1671-1675.
Vodret, A. (1970). La ricotta pecorina sarda. Sci 7&x. Latt.-Gas., 21, 310-313.
Xu, S. Y., Stanley, D. W., Goff, H. D., Davidson, V. J. & Le Maguer, M. (1992). Hydro-
colloid/milk gel formation and properties. 1. Food Sci., 57, 96- 102.
Weatherup, W. (1986). The effect of processing variables on the yield and quality of Ricotta cheese. Dairy Ind. Int., 51, 4 l-45.