© 2017 WIT Press, www.witpress.com
ISSN: 2041-9031 (paper format), ISSN: 2041-904X (online), http://www.witpress.com/journals DOI: 10.2495/SAFE-V7-N2-221-233
USING A COASTAL STORM HAZARD INDEX TO ASSESS
STORM IMPACTS IN LISBON
BOGDAN JARANOVIC, JORGE TRINDADE, JOÃO RIBEIRO & ADÉLIO SILVA
Centre of Geographical Studies - University of Lisbon, Universidade Aberta and Hidromod - Modelling & IT Specialists
ABSTRACT
Coastal areas are among the most dynamic earth systems as they are exposed to powerful agents. Near-shore wave energy is one of the most important triggering factors for erosion and flooding and is often neglected for severe infrastructure damaging, property losses and loss of life. These consequences are amplified with high population density and heavy infrastructure implantation as it happens in Lisbon (Portugal). In this context, it is of great importance for coastal stakeholders, decision-makers and civil protection entities to estimate precisely the spatial distribution of storm hazard for prevention and mitigation purposes, as well as to design adjusted answers for calamity responses. We apply a coastal storm hazard index (CSHI) considering triggering and conditioning variables involved in the effects of an extreme storm, namely: 100-year return period of SWAN modelled Hs, and its spatial distribution across the study area, land use, number of buildings, height, slope, geology, geomorphology, erosion/ accretion rates, width of the systems, exposure of the coastline, bathymetry and legally protected areas. The variables were weighted according to a hierarchical analysis process and classified into five classes of exposure. A validation process was then implemented by comparing the occurrences identified in the last two decades newspapers and the storm hazard classification, showing a satisfactory validation results. The results show a classified storm hazard map that identifies the most and the less exposed areas. High values of CSHI occur in areas with excessive human pressure, low heights sandy systems with significant costal erosion rates. The main type of consequences identified are associated with inland flooding and erosion, resulting in the destruction of coastal protection infrastructures, and popu-lation displacement leading to great economic and social impacts and loss of life.
Keywords: Coast, hazard index, numerical modelling, return period, waves 1 INTRODUCTION
Coastal areas have great economic advantages, due to navigation, coastal fisheries, tourism and leisure. Inevitably, these areas are also exposed to a significant number of hazards related to its specific hydrodynamic characteristics. Coastal storms are among the most powerful and dynamic hazards, frequently leading to severe structural damages, coastal erosion, affecting people and leading to loss of life.
In the Portuguese coast, the impact of storms is frequent. The last research about the quan-tification of coastal storms in the country was done by (Sousa [1]) who, through the modelled data from the Sines buoy (micore project – Dodet et al. [2]), found a total of 409 storms in the period from 1953 to 2009. 94.8% of the storms occurred between September and April, and the investigation concluded: (i) that the average significant wave height (Hs) of these events was 5.08 m and (ii) the storm direction was from the NW in 65.18% of the cases. The 60’ was the decade with the higher number of storms, totalling 86, but no increase/decrease tendency in storminess was noted.
To assess the coastal storm hazard, several methodologies have been developed. A com-monly used index for defining the coastal vulnerability is the CVI (coastal vulnerability index). This index allows the classification of different variables, relating them to one another and quantifying their relations [3–7]. The analysis of the coastal areas that may be affected by these extreme events is frequently done with geographic information systems, which
simplifies the spatial analysis of the results. Other methodologies use numerical models for the characterization of storm wave patterns in the nearshore [8]. It is also possible to analyse the coastal vulnerability with a statistical approach. Logistical regression has been used to relate coastal vulnerability to several explanatory variables [9]. The triggering and condition-ing factors considered in this kind of model implementation do not always coincide in the scientific literature, although it is common to find clusters of factors (i) that characterize the coastal morphology and its dynamics (heights, slope, rates of erosion, exposure), (ii) that correspond to land use and other anthropogenic variables and (iii) that define wave energy and other hydrodynamic parameters (wave parameters, tides and currents) and, finally, (iv) that predict the sea level near future evolution. Wave energy is one of the most important independent variable for the research of storms impact on the coast, but it is also lacking in measured data from wave buoy. When wave measured data time series is available, usually it does not translate wave parameters between the breaker zone and the beach face, where storm incidence is more likely to cause damage. This includes the disregard of several processes that change the wave characteristics (white-capping, wave-wave interactions, bottom friction, shoaling, depth-induced braking, refraction and diffraction) [10, 11]. The progress of tech-nologies has enabled the development of models that simulate this process and provide correct wave data nearshore. One of the most common models is SWAN (Simulating Waves Near-shore), which has been accepted and used extensively for this purpose [12–15].
Independently of the chosen approach to assess the coastal storm hazard, the accuracy of a coastal storm hazard map must be demonstrated through a validation process. The most fre-quent method consists in the comparison of the classified coastal storm hazard map results and the areas that have been affected previously by storms.
The main goal of this investigation is to assess the coastal storm hazard of the coastline between Cabo Raso and Cabo Espichel (Lisbon, Portugal). This would be carried through the analysis of the hydrodynamic distribution of a 100-year return-period scenario, and by estab-lishing the spatial distribution of the morphologic, hydrodynamic and anthropic parameters related to the storm events, and combining the different variables into a single validated measure of coastal storm hazard mapping.
2 STUDY AREA
The Portuguese West coast is characterized by high energetic wave regime during maritime winters. Most of the NW storms are defined by the general Atlantic atmospheric circulation and the mean significant wave height (Hs) is 2.5 m, reaching frequently 5 m. In this meso-tidal regime, the maximum tide amplitude reaches 4 m [16].
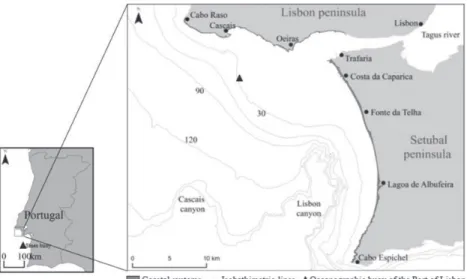
The Lisbon coastal area is located in the mid-west coast of Portugal (Fig. 1), between the
Cabo Raso and the Cabo Espichel, and has almost 60 km of diversified sandy and rocky coastal systems. Because of the position of the Cabo Raso headland, predominant storm wave direction is deflected from its original direction (NW) at this point and high amount of wave energy is spent here. Along with Cabo Raso, Cabo Espichel headland is also character-ized by high incident wave energy concentration, while the coastline near the Tagus estuary is less exposed to NW storms and less prone to wave action.
The study area is composed by the Lisbon and the Setubal peninsulas. The first one, between Cabo Raso and Lisbon, is dominated by a rocky coast, although with low altitudes and scattered pocket beaches, usually surrounded by cliffs. Besides the high level of human occupation and building density, the erosion rates present in this coast are very low, due to the predominantly hard limestone and sandstone cliffs [12, 17]. The Setubal peninsula is a low
altitude sandy coast from the extreme north (Trafaria) until the southern area of Lagoa de
Albufeira, where highest erosion rates dominate [1, 18] essentially where urbanization occu-pies large areas – Costa da Caparica and Fonte da Telha. The northern coastal stretch of the Setubal peninsula is the most affected area by coastline recession over the last century [19]. For that reason, hard protection mitigation measures were taken in the 70’s and in the 80’s of the past century to solve erosion problems. The construction of nine groins, a seawall, and sand nourishment were only some of the drastic measures taken. Southwards from this erosion hotspot, it is also possible to observe some sectors with accretion rates [1].
The nearshore bathymetric configuration is very important for wave propagation and, thus, for wave energy dissipation. Exception made for the Tagus estuary (Fig. 1), the inner conti-nental shelf platform of the study area is relatively narrow, reaching less than 20 km wide with high slope values. The Cascais and Lisbon canyons (Fig. 1) have direct influence on the hydrodynamics of the coast, leading to the accumulation of wave energy.
3 MATERIALS AND METHODS
To implement, validate and analyse the coastal storm hazard index (CSHI), the first step was to delimitate the study area. Sandy coastal systems were delimited including the beach, the seaward and the landward sides of the foredune. The limits of cliff systems were established between the coastline and the cliff top, including the shore platform and the cliff toe and face. In highly urbanized areas, the delimitation of the study area followed land use criteria, by using the first frontal urban blocks as the inner limit. Generally, these coastal areas also included heavy protection structures, such as groins and sea walls.
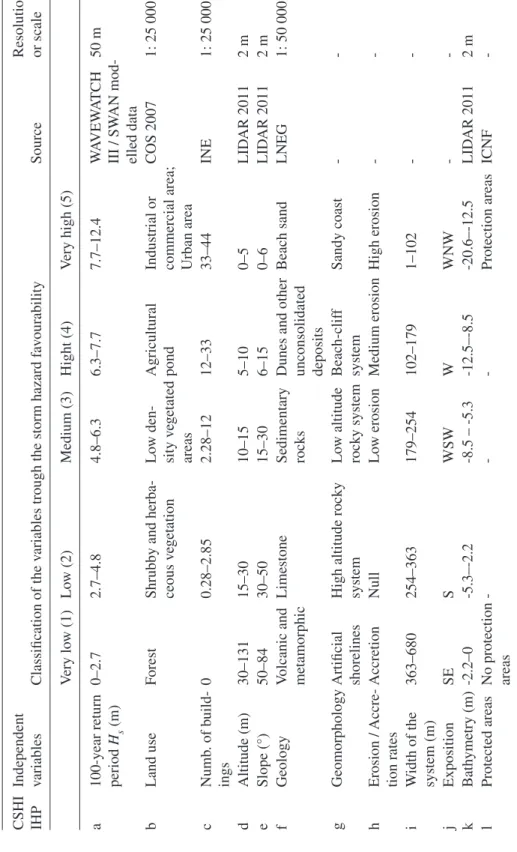
The second stage was to carefully choose the most significant triggering and conditioning factors for coastline storm hazard exposure. A set of 12 variables was selected based on the literature review, the study area specificity and on the available spatial data (Table 1) [3, 12, 20]. After the system was delimited, this was parcelled out in 50 m equidistance cells.
The main triggering factor for storm hazard exposure is the high energetic waves that hit the coast. Considering a high wave energy event scenario, the 100-year return period of Hs was calculated from a 50-year wave database, available at (Dodet et al. [2]) for the coastal
Table 1: Classification of the v
ariables used in the CSHI, with the respecti
ve sources and resolution.
CSHI IHP Independent variables
Classification of the v
ariables trough the storm hazard f
av ourability Source Resolution or scale V ery lo w (1) Lo w (2) Medium (3) Hight (4) V ery high (5) a
100-year return period
Hs (m) 0–2.7 2.7–4.8 4.8–6.3 6.3–7.7 7.7–12.4 W A VEW A TCH III / SW AN mod -elled data 50 m b Land use Forest
Shrubby and herba
-ceous v egetation Lo w den -sity v egetated areas Agricultural pond Industrial or commercial area; Urban area
COS 2007 1: 25 000 c Numb . of b uild -ings 0 0.28–2.85 2.28–12 12–33 33–44 INE 1: 25 000 d Altitude (m) 30–131 15–30 10–15 5–10 0–5 LID AR 2011 2 m e Slope (°) 50–84 30–50 15–30 6–15 0–6 LID AR 2011 2 m f Geology V
olcanic and metamorphic
Limestone
Sedimentary rocks Dunes and other unconsolidated deposits
Beach sand LNEG 1: 50 000 g Geomorphology Artificial shorelines
High altitude rock
y system Lo w altitude rock y system Beach-clif f system Sandy coast -h Erosion / Accre -tion rates Accretion Null Lo w erosion Medium erosion High erosion -i W idth of the system (m) 363–680 254–363 179–254 102–179 1–102 -j Exposition SE S WSW W WNW -k Bath ymetry (m) -2.2–0 -5.3–-2.2 -8.5 – -5.3 -12.5–-8.5 -20.6–-12.5 LID AR 2011 2 m l Protected areas No protection areas -Protection areas ICNF
-nearby area (Sines nearshore coastal sector, a in eqn (1)). The method described by Gilleland and Katz [21] is frequently used for wave ocean modelling.
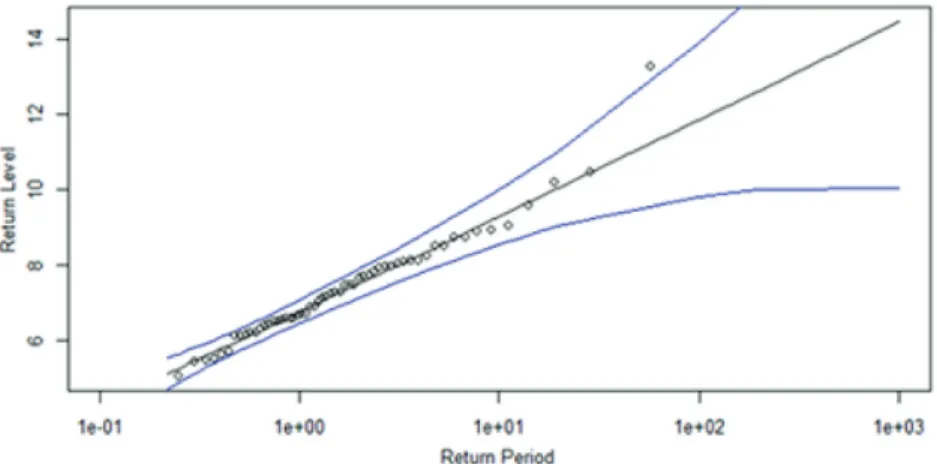
The Generalized Extreme Value distribution is usually used to explain the patterns of the maximum values distribution, and this analysis used the r-largest annual maxima method. The final 100-year Hs value obtained was 12.9 m. The representation of the 95%-confidence intervals is shown in the Figure 2. The value of µ, that represents the centre of a distribution, is 6.75, σ, the scale, is 1.08 and ξ, the shape, is 0.009.
This Hs 12,9 m value is used for the simulation of the worst-case scenario, using the SWAN model. The SWAN model computes short-crested wind-generated waves in coastal regions and inland waters, and enables the implementation of several physical processes that influ-ence wave progression [10, 11], as it takes into consideration the wind generation of waves, the interactions between waves (triads), and whitecapping. In this simulation, the mean sea level is held at 2.08 m, according to the Cascais tide gauge data. For the dissipation of waves, due to the sea floor interaction, the JONSWAP mode is used, and the growth of the waves was considered linear (JANSSEN). The dissipation and the diffraction processes were considered constant. The parameter AGROW is established as 0.0030, since Ribeiro et al. [22] states that this modification introduces a quality improvement of the simulated data. Two different bathymetric data are used, one for the western Iberian margin (EMODNET – 250 m resolu-tion) and another for the studied area (Hydrographic Institute of Portugal – 100 m resoluresolu-tion). A validation process was implemented by comparing the SWAN simulated wave data and the measured wave data from the Port of Lisbon buoy (latitude 38º37´ 33.6´´N e longitude 09º23´ 16.8´´W – WGS84 coordinate system). For the validation process, the interaction between the WAVEWATCH III and SWAN models was used. The WAVEWATCH III model was developed by NOAA/NCEP [23] and is used for wind generated waves on a large-scale area that may output boundary conditions for SWAN nesting. Nesting consist of running, in the first place, the WAVEWATCH III model on a larger scale and using the outputs that this model provided to start a new run in SWAN, using boundary conditions on a finer and more specific scale. The results of the validation for this wave climate models are presented in Figure 3. The result is considered satisfactory due to the general coincidence of the simulated and measured wave patterns, and reasonable statistical results – correlation value of 0.91; RMSE of 0.07 and BIAS value of -0.07.
The worst-case scenario simulation was only carried out when the validation process was over, obtaining a spatial distribution of the Hs in the study area. In contrast to the validation method, carried out in the non-stationary mode, the simulation of the worst-case scenario was carried out in the stationary mode. Finally, the spatial distribution of the 100-year Hs was assumed to be the values estimated at a distance of 500m seaward from the coastline, thus including the breaker zone extreme wave Hs.
Since the strongly occupied areas are the ones where the largest number of accidents occur, the land use classification (b in eqn (1)) and the number of buildings (c in eqn (1)) are used to represent the human pressures over the coastal systems. Altitude (d in eqn (1)) and slope (e in eqn (1)) are also used to define the influence that an extreme storm may have on the coast. Geology (f in eqn (1)) is considered in this study in terms of materials consolidation and pro-pensity to mechanical erosion due to wave action. Geomorphology (g in eqn (1)) defines the type of coastal systems in presence. Local erosion and accretion rates (h in eqn (1)) were also considered in this study, as well as the width of the system (i in eqn (1)), for it represents a buffer zone to the storm impacts. Coastline orientation is an important variable to consider, especially if the dominant storm direction is known. In Portugal, the most frequent storms are generated in the NW Atlantic Ocean and that is the more prone orientation to hazard incidence. The bathymetric data (k in eqn (1)) was an important independent variable for WAVEWATCH III/SWAN wave modelling, because it drives the water masses to the coast proximity under the influence of waves and currents. The legally protected areas (l in eqn (1)) where considered because the consequences of an extreme storm on the coast cannot be resumed to human and infrastructure loss and should consider also the loss of biodiversity of the legally protected areas in this coastal stretch. Table 1 shows all the factors considered and its classification.
An analytic hierarchy process was used to order the relative importance of the twelve vari-ables for the CSHI [24]. The varivari-ables were classified in accordance with the groups represented in the Table 1. This method defines a way of measurement through pairwise comparisons and is based on the judgment of experts to derive the priority scale [25]. In this investigation, it was used the nine-level scale, where the biggest number represents a higher importance of the factor [25]. The result shows 66 comparisons between the variables with a consistency index of 0.06. After the classification of the 50m equidistant parcels with the representative value of each variable, the CSHI was calculated, using the formula below [3, 26]. The letters represent the different variables in the same order as in Table 1.
CSHI= 25 6a 11 9
(
b c d e)
4 2(
f g h i j k)
1 6l 12, * , * * * * , * * * * * * ,
(1) Figure 3: Comparison of the SWAN data and the data in the Port of Lisbon buoy.
A storm consequences geodatabase was created with the analysis of 3150 newspaper editions, during maritime winters, from September to April. The analysis on the 2000 to 2015 editions of the Diário de Notícias newspaper was essential for the validation of the final CSHI map.
4 RESULTS
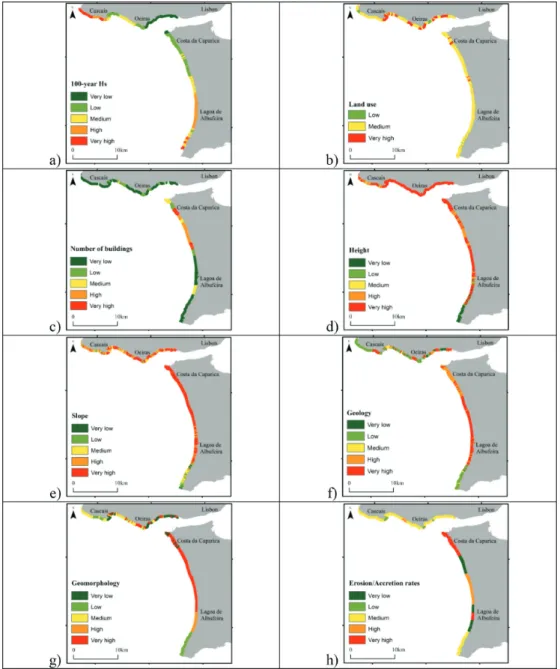
The spatial distribution of the eight independent variables with the highest IHP score values are shown in Figure 4 and classified according to Table 1.
Figure 4: Classified variables according to its favourability to storms occurrence: (a) 100-year return period Hs; (b) land use; (c) number of buildings; (d) height; (e) slope; (f) geology; (g) accretion/erosion rates; (h) geomorphology.
(a) 100-year Hs – represents a probability of an extreme storm event and its spatial distribu-tion throughout the Lisbon coast. The reference value for the SWAN numerical wave modelling was 12.9 m. Spatial distribution of maximum values of 100-year Hs can be ob-served near the Cabo Raso, on the west side of Cascais, and Cabo Espichel, in the south side of Lagoa de Albufeira. Gradually, the 100-year Hs decreases towards the Tagus estuary area, between Lisbon and Costa da Caparica.
(b) Land use – depicts the natural and the types of human presence and pressure at the Lisbon coast. High to low vegetated areas include forests to low herbaceous plant strata, and from high to low vegetation density with little anthropic pressure. These areas are spatially con-centrated in the southern coastal sector, while the northern Lisbon coastal stretch is more densely urbanized. Heavy coastal protection structures are found near the Tagus estuary. (c) Number of buildings – The spatial distribution reflects the presence of anthropic
struc-tures within the limits of the coastal systems. Higher values are present in Costa da
Caparica, where building densities are very high. Although the northern coastal sector has higher population densities, in the nearby coastline areas the cliff dominant coastal systems are narrower and exclude land use classifications related to anthropic presence. (d) Altitude – influences directly the landward storm wave progression, conditioning flood
extent and duration. Lisbon coast is essentially a low lying coastal system, despite the cliff subsystems, very frequently associated with a beach at the cliff toe, which reduce the over-all altitude. High system altitude values can be found at the extreme south of the study area. (e) Slope – can be an important independent variable to explain, not only storm wave in-land progression, but also the anthropic presence [27]. Namely, coastal systems near densely urbanized areas and with low slope values have more favourable conditions for recreational use and building, than those with higher slope values. Lower slope values are consistently present at the Setubal peninsula, between Costa da Caparica and Lagoa
de Albufeira. This leads to a high classification in the storm hazard favourability scale (Table 1, Fig. 4e) for this variable. Low to medium favourability classifications are found at the extreme south and inconsistently at Cascais coastal area.
(f) Geology and (g) Geomorphology – Geology defines the physical processes that lead to wave energy dissipation, and erosion and coastline recession [26]. Thus, unconsolidated materials, like beach and dune sediments, are more prone to coastline recession and run-up progression, than consolidated rocky coasts, which are more favourable to a stable behaviour in terms of erosion and to wave energy reflection back to the nearshore. In the study area, these two variables are highly linked together. The type of the coastal system is conditioned by geology: consolidate materials are associated with cliff systems, and unconsolidated materials are associated with beach/dune systems. Essentially, uncon-solidated sandy beach/dune systems are found between Costa da Caparica and Lagoa
de Albufeira, and are classified as high and very high storm hazard favourable areas. Due to the composite nature of the beach-cliff systems of the Lisbon peninsula, the Cascais –
Oeiras coastal scratch has the more diffuse distribution of the favourability classes. Here, low and very low classes are predominant.
(h) Erosion/accretion rates – Coastline recession can be the result of successive storm wave impacts over decades on the coast. Thus, the spatial distribution of erosion/accretion rates over the study area is a helpful evidence of the last decease storm impact hotspots. The Lisbon peninsula coastal scratch reaches intermediate storm hazard favourability. Higher values are observed at Costa da Caparica, where erosion rates, over the last century, lead to heavy coastal protection interventions, including groins, sea-walls and beach artificial nourishment.
5 RESULTS
The outcome of the CSHI appears as the spatial classification of the Lisbon coastal areas prone to 100-year storm hazard impact. It is a result of the weighted favourability triggering and conditioning factors for extreme wave impacts on the coast. The 100-year Hs triggering factor was assumed to have NW to SE direction, similar to the most frequent storms in the west coast of Portugal. Therefore, CSHI results are highly related to this hydrodynamic extreme storm context, which is particularly relevant in the Lisbon coastal area, given the different general coastal exposure and coastal systems geology and geomorphology.
Although a set of 12 variables are included in the CSHI eqn (1), several independent vari-ables were not considered, tidal range, storm surge and sea level rise are considered to have no spatial variability at this analysis scale. Therefore, they act as spatially neutral variables for the model implementation.
5.1 CSHI Model validation
CSHI map validation was assessed through the comparison between the CSHI classification and the 67 occurrences from the newspaper geodatabase. The distribution of these occur-rences does not shows the total area that might be affected by storms, essentially because these registers report only the events that have impacts on people and infrastructures. Areas with low atrophic pressures tend to have less or no newspaper geodatabase entries.
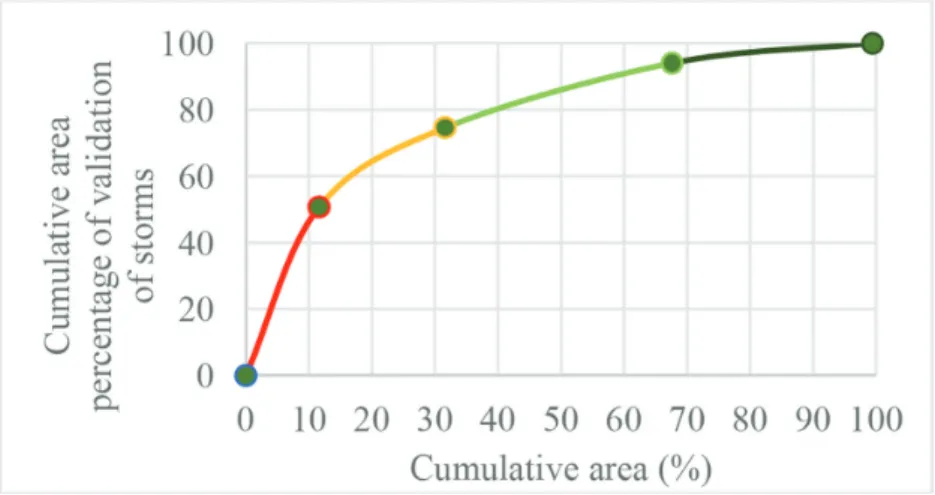
The validation process is based on prediction-rate curves, and the area accuracy of the map can be directly measured with the area under the curve (Fig. 5).
50.7% of the newspaper occurrences are coincident with the highest class of CSHI (Fig. 6). The two highest classes explain 74.6% of the occurrences. This is considered a satisfactory result mainly because ‘occurrences’ variable was not taken into account in the CSHI model, and the model explains ¾ of the total ‘occurrences’ in the most hazardous classes.
5.2 CSHI classification and spatial distribution
As stated before, the CSHI mapping quantifies classified areas more or less prone to the effects of coastal storm driven consequences at the Lisbon coast. This is a major tool to
Figure 5: Predicted curve for validation of the model. Colours are related to the classes of CSHI (Fig. 6).
support decision making, stakeholder’s action, population preparedness and hazard mitiga-tion by the authorities.
In the last 15 years, 67 occurrences related to storm wave action on the coast of Lisbon can be found in the newspaper reports. This means that this coast is, at least, exposed to this kind of hazard.
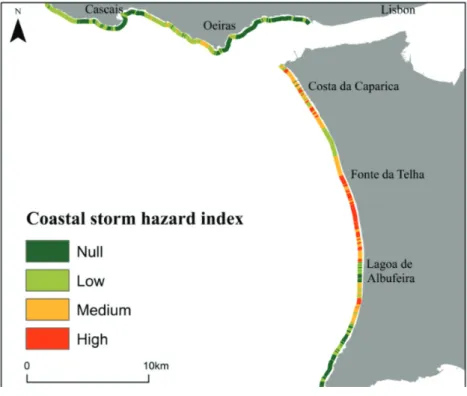
The CSHI is classified into four classes, from null to high storm hazard impacts (Fig. 6). Extreme storm wave height is considered in this work as the main triggering factor for storm induced consequences in the coast of Lisbon. As seen in Figure 6, the most prone coastal areas to the effects of an extreme storm (CSHI, Fig. 6) are not exactly the same areas where to have the higher incident wave energy is expected (100-year Hs in Figure 4a). In fact, coastal sectors to the west of Cascais and to the south of Lagoa de Albufeira with ‘Low’ and ‘Null’ CSHI classifications have the higher favourability for wave 100-year Hs. On the other hand, extreme storm wave sheltered coastal areas of Costa da Caparica have less favourable 100-year Hs and are classified with higher values of CSHI.
‘Low” CSHI values (35% of the study area) dominate the area to the west of Cascais, which is characterized by rocky cliff systems, with medium to low erosion rates, and high incident wave energy. They are also present where accretion rates dominate the historical coastline dynamics between Costa da Caparica and Fonte da Telha.
The ‘Null’ CSHI classification (31.8% of the study area) is dominant in the southern sector of Lagoa de Albufeira (Fig. 6) where coastal systems correspond to high limestone cliffs. This class is also present from Oeiras to Lisbon and in the Cascais bay. These are the shel-tered coastal stretches for the assumed storm scenario of 100-year Hs. The ‘Medium’ and
‘High’ CSHI classes appear in 33.2% of the study area. These classes are present only in low height and slope areas and unconsolidated sedimentary sectors that are indeed the most vul-nerable areas to storms [1]. In the Lisbon peninsula, the most exposed areas to storm incidence are the widest beach systems in the Oeiras coast (Fig. 6). Higher classes of CSHI can be found also between Costa da Caparica and Lagoa de Albufeira, where anthropic pressure over the beach/dune systems is very high with observed historical high erosion rates [1, 19] (Costa da Caparica and Fonte da Telha, Fig. 6) or in coastal areas with low anthropic pres-ence (south of Fonte da Telha) but with higher incident storm wave action (Fig. 4a)
6 CONCLUSION
As a powerful and harmful event, capable of causing significant damage and life loss, storms are a frequent coastal phenomenon in the Portuguese coast.
Using twelve independent variables this research explored the spatial patterns of the coastal storm vulnerability index (CSHI) validated classification over the 60 km coastal area.
CSHI showed that 33.2% of the study area is medium to highly prone to the effects of an extreme storm scenario (100-year Hs), while 66.8% of the coast of Lisbon have low exposure.
It is to be noted that the most favourable areas for wave action were not found to be the most exposed to an expected extreme storm event. During the occurrence of an extreme storm event, high level of wave energy dissipation is expected at the extreme west and south of the study area, but CSHI classification points out the relative low exposures to the effects of such an event. On the other hand, between Costa da Caparica and Fonte da Telha wave modelling sowed low 100-year Hs values but these are medium to high vulnerable areas.
Coastal systems height, slope, type, coastline rate of change (erosion/accretion rates) and anthropic pressure are the conditioning factors controlling the spatial distribution of the CSHI. Low lying, sandy, eroded and highly dense urbanized coastal stretches are more vul-nerable to extreme storms, even though they have not high 100-year Hs favourability.
The improvement of the CSHI is possible, whether it is by the introduction of a less fre-quent storm event from the SW direction, which would affect the coastal area with a different spatial distribution, or by the improvement of the validation process with the contribution of more newspaper reports of the storm consequences. Nevertheless, the authors believe that the CSHI show results with an acceptable level of confidence and can be used to support coastal decision makers, stakeholders, and civil protection entities.
BIBLIOGRAPHY
[1] Sousa, N., Dinâmica da linha de costa e vulnerabilidade à erosão no setor não
artifi-cializado do arco Caparica-Espichel. Masters dissertation, Institute of Geography and territorial planning, Lisbon, 2015.
[2] Dodet, G., Bertin, X. & Taborda, R., Wave climate variability in the North-East Atlantic Ocean over the last six decades. Ocean Modelling, 31, pp. 120–131, 2010.
https://doi.org/10.1016/j.ocemod.2009.10.010
[3] Gornitz, V.M., Daniels, R.C., White, T.W. & Birdwell, K.R., The development of a coastal risk assessment database: vulnerability to sea-level rise in the U.S. Southeast.
Journal of Coast Research, 12, pp. 327–338, 1994.
[4] Shaw, J., Taylor, R.B., Forbes, D.L., Ruz, M.H., & Solomon, S., Sensitivity of the coasts of Canada to sea-level rise. Bulletin – Geological Survey Canada, 505, pp. 1–79, 1998.
[5] Silva, S.F., Martinho, M., Capitão, R., Reis, T., Fortes, C.J. & Ferreira, J.C., An index-based method for coastal-flood risk assessment in low-lying areas (Costa de Caparica, Portugal). Ocean & Coastal Management, 144, pp. 90–104, 2017.
https://doi.org/10.1016/j.ocecoaman.2017.04.010
[6] Kumar, T.S., Mahendra, R.S., Nayak, S., Radhakrishnan, K. & Sahu, K., Coastal vul-nerability assessment for Orissa state, East Coast of India. Journal of Coastal Research,
3, pp. 523–534, 2010.
https://doi.org/10.2112/09-1186.1
[7] Islam, A., Mitra, D., Dewan, A., & Akhter S.H., Coastal multi-hazard vulnerability assessment along the Ganges deltaic coast of Bangladesh:a geospatial approach. Ocean
& Coastal Management, 127, pp. 1–15, 2016.
https://doi.org/10.1016/j.ocecoaman.2016.03.012
[8] Seenath, A., Wilson, M. & Miller, K., Hydrodynamic versus GIS modelling for coastal flood vulnerability assessment: Which is better for guiding coastal management? Ocean
& Coastal Management, 120, pp. 99–109, 2016.
https://doi.org/10.1016/j.ocecoaman.2015.11.019
[9] Dickson, M. & Perry, G., Identifying the controls on coastal cliff landslides using machine-learning approaches. Environmental Modelling & Software, 76, pp. 117–127, 2016.
https://doi.org/10.1016/j.envsoft.2015.10.029
[10] Booij, N., Ris R.C. & Holthuijsen, L.H., A third-generation wave model for coastal regions, Part I, Model description and validation. Journal of Geophysical Research,
104, pp. 7649–7666, 1999.
https://doi.org/10.1029/98jc02622
[11] Holthuijsen, L.H., Waves in Oceanic and Coastal Waters, Delft University of Technol-ogy and UNESCO-IHE, pp. 387, 2007.
[12] Rangel-Buitrago, N. & Anfuso G., Risk assessment of storms in coastal zones: case
studies from Cartagena (Colombia) and Cadiz (Spain), Springer Briefs in Earth Sci-ences, pp. 63, 2015.
[13] Huang, Y., Weisberg, R., Zheng, L. & Zijlema, M., Gulf of Mexico hurricane wave simulations using SWAN: Bulk formula-based drag coefficient sensitivity for Hurri-cane Ike. Journal of Geophysical Research: Oceans, 118, pp. 3916–3938, 2012.
https://doi.org/10.1002/jgrc.20283
[14] Gorrell. L., Raubenheimer, B., Elgar, S. & Guza, R., SWAN predictions of waves observed in shallow water onshore of complex bathymetry. Coastal Engineering, 58, pp. 510–516, 2011.
https://doi.org/10.1016/j.coastaleng.2011.01.013
[15] Rusu, E., Pilar, P. & Soares, G.S., Evaluation of the wave conditions in Madeira Archi-pelago with spectral models. Ocean Engineering, 35, pp. 1357–1371, 2008.
https://doi.org/10.1016/j.oceaneng.2008.05.007
[16] Pires, H.O. & Pessanha, V.E., Wave power climate of Portugal. Proceedings IUTAM
Symposium, Hidrodynamics of Ocean Wave-Energy Utilization, pp.157–167, 1986.
https://doi.org/10.1007/978-3-642-82666-5_12
[17] Davidson-Arnott R., An introduction to coastal processes and geomorphology. Cambridge University press, pp. 396–400, 2010.
[18] Veloso-Gomes, F., Pinto, F.P., Barbosa, J.P., Costa, J. & Rodrigues, A., The Defen-sive Works at Costa da Caparica. 2. as Jornadas de Hidráulica, Recursos Hídricos e
[19] Rocha, J., Ferreira, J.C., Simões, J. & Tenedório, J.A., Modelling coastal and land use evolution patterns through neural network and cellular automata integration. Journal of
Coastal Research, 50, pp. 827–831, 2007.
[20] Coelho, C.R., Silva, F., Veloso-Gomes, F. & Taveira-Pinto, F., A vulnerability analysis approach for the Portuguese west coast. Risk Analysis V: Simulation and Hazard
Miti-gation, 91, pp. 251–262, 2009.
https://doi.org/10.2495/risk060241
[21] Gilleland, E. & Katz, R., extRemes 2.0: an extreme value analysis package inR. Journal
of Statistical Software, 72(8), pp. 1–39, 2016.
https://doi.org/10.18637/jss.v072.i08
[22] Ribeiro, J., Silva, A.J.R. & Leitão, J.C., Modelos Operacionais de previsão da agitação para suporte à navegação e gestão de riscos, 6as Jornadas Portuguesas de Engenharia
Costeira e Portuária, pp. 22–38, 2009.
[23] Tolman, H. – User manual and system documentation of WAVEWATCH-III version
2.22, U.S. Department of Commerce, National Oceanic and Atmospheric Administra-tion, pp. 133, 2002.
[24] Denner, K., Phillips, M.R., Jenkins, R.E. & Thomas, T., A coastal vulnerability and environmental risk assessment of Loughor Estuary, South Wales. Ocean & Coastal
Management, 116, pp. 478–490, 2015.
https://doi.org/10.1016/j.ocecoaman.2015.09.002
[25] Saaty, R.W., The analytic hierarchy process – What it is and how it is used. Math
Mod-elling, 9, pp. 161–176, 1987.
https://doi.org/10.1016/0270-0255(87)90473-8
[26] Thieler E.R. & Hammar-Klose E.S., National Assessment of Coastal Vulnerability to Sea Level Rise: preliminary results for the US. Atlanta coast USGS, pp. 99 – 593, 1999. [27] Nageswara, K., Subraelu, P., Venkateswara, T., Hema, B., Ratheesh, R., Bhattacharya, S.
& Ajai, A.S.R., Sea-level rise and coastal vulnerability: an assessment of Andhra Pradesh coast, India through remote sensing and GIS. Journal of Coastal Conservation. 12, pp. 195–207, 2008.