www.nat-hazards-earth-syst-sci.net/15/1711/2015/ doi:10.5194/nhess-15-1711-2015
© Author(s) 2015. CC Attribution 3.0 License.
Probabilistic hurricane-induced storm surge hazard assessment in
Guadeloupe, Lesser Antilles
Y. Krien1,a, B. Dudon1, J. Roger1,2, and N. Zahibo1
1LARGE-Laboratoire de Recherche en Géosciences, Université des Antilles et de la Guyane, Guadeloupe, Pointe-A-Pitre, France
2G-Mer Etudes Marines, Guadeloupe, Saint François, France
anow at: UMR7266, LIENSs, Université de la Rochelle, La Rochelle, France Correspondence to:Y. Krien ([email protected])
Received: 31 October 2014 – Published in Nat. Hazards Earth Syst. Sci. Discuss.: 14 January 2015 Revised: 26 June 2015 – Accepted: 7 July 2015 – Published: 3 August 2015
Abstract. Current storm surge hazard maps in the French West Indies are essentially based on simple statistical meth-ods using limited historical data and early low-resolution models which do not take the effect of waves into account. In this paper, we infer new 100-year and 1000-year surge levels in Guadeloupe from the numerical modelling of storm surges induced by a large set of synthetic events that are in statistical agreement with features of historical hurricanes in the North Atlantic Basin between 1980 and 2011. Compu-tations are performed using the wave-current coupled model ADCIRC–SWAN with high grid resolutions (up to 40–60 m) in the coastal and wave dissipation areas. This model is val-idated against observations during past events such as hur-ricane HUGO (1989). Results are generally found to be in reasonable agreement with past studies in areas where surge is essentially wind-driven, but found to differ significantly in coastal regions where the transfer of momentum from waves to the water column constitutes a non-negligible part of the total surge. The methodology, which can be applied to other islands in the Lesser Antilles, allows storm surge level maps to be obtained that can be of major interest for coastal plan-ners and decision makers in terms of risk management.
1 Introduction
During the last century, coastal inundations from hurricane-induced storm surges have caused catastrophic damage to lives and properties in the French West Indies, as evidenced by the category 4-hurricane that hit Guadeloupe in 1928,
to conduct large-scale storm surge hazard assessment studies in the Lesser Antilles with much more accuracy.
In this paper, we carry out numerical modelling of hurri-cane surges using the ADCIRC–SWAN wave-current cou-pled model, which has been widely tested and validated through hindcast of past events (Dietrich et al., 2011a, b, 2012; Hope et al., 2013; Kennedy et al., 2011; Murty et al., 2014). This model is run for a large number of synthetic ricanes that take into account the natural variability in hur-ricane frequency, size, intensity and track (Emanuel et al., 2006), in order to infer new 100-year and 1000-year surge levels for the whole archipelago at high resolution.
A brief description of the study area is given in Sect. 2. Section 3 presents the methodology. Validation and results are shown in Sects. 4 and 5 respectively, followed by conclu-sions and discusconclu-sions.
2 Study area
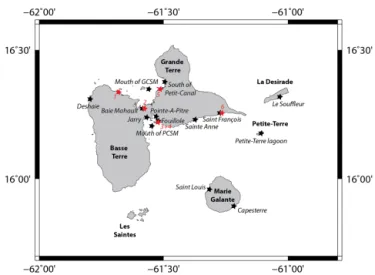
Located at the southernmost of the Leeward Islands, in the Lesser Antilles (Fig. 1), Guadeloupe is an archipelago com-posed of two main islands (Grande Terre and Basse Terre), separated by a narrow sea channel, and three smaller islands: La Désirade, Les Saintes and Marie-Galante (Fig. 2). This French overseas region lies within the paths taken by many hurricanes formed over the warm tropical waters of the At-lantic Ocean between the months of June and November, and has been struck dozens of times during the last cen-turies (Saffache et al., 2003). Past extreme storms include the 1776 event that killed more than 6000 people, mostly in the bay of Pointe-à-Pitre (Depradine, 1989; Zahibo et al., 2007), or the “Great Hurricane” of 1928, probably the most de-structive of the 20th century, which claimed more than 1200 lives. Severe storm surges were recorded for these events, with water reaching a few metres above mean sea level, flooding small islands in the PCSM or low-lying coastal areas south of Grande-Terre. The more recent, category 4-hurricane HUGO, which crossed Guadeloupe on 17 Septem-ber 1989, remains vivid in peoples’ memories especially be-cause of the strong winds (with gusts up to 300 km h−1) that caused extensive damage: 10 000 homes were destroyed, the whole banana crop and 60 % of the sugar cane crop was lost (Pagney, 1991). Yet it appears that storm surges were quite significant as well, and may have reached 2.5–3 m in some places along the shores of the GCSM (Saffache et al., 2003; Pagney, 1991). Fortunately, the flooded areas were
rel-Figure 1.Computational domain and tracks of a few recent major storms that have affected the French West Indies.
Figure 2.Schematic of Guadeloupe. Geographic location of val-idation (Table 2) and comparison (Table 3) points are indicated by black and red symbols, respectively. (1: Sainte Rose, 2: Baie Mahault, 3: Pointe Fouillole, 4: Pointe-à-Pitre marina, 5: Morne-à-l’Eau, 6: Saint François marina).
atively sparsely populated, because most of the buildings were constructed either on high grounds (in Baie Mahault for example), or behind a well developed mangrove forest (west of Grande-Terre), which might have played a protec-tive role. Severe environmental impacts were reported how-ever on mangroves (Francis and Gillespie, 1993; Imbert et al., 1996) or fishing communities (Bouchon et al., 1994). All these catastrophic events point out the need to conduct de-tailed storm surge hazard assessment studies in Guadeloupe to improve risk management, especially in the most exposed areas: the GCSM, PCSM and in the south of Grande Terre.
3 Methodology
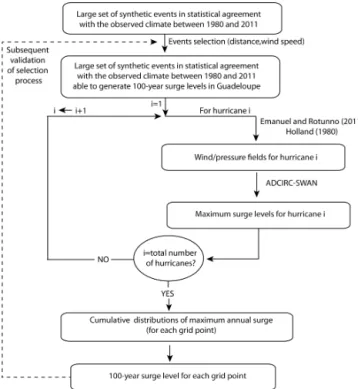
Figure 3.Schematic diagram of the method used to estimate 100-year surge levels. The same approach is followed for the 1000-100-year return period, but with a larger set of synthetic storms and different criteria to select the events to be computed.
– Two large sets of synthetic hurricanes are generated in statistical agreement with the present climate in terms of track, intensity, size and mean frequency (one to es-timate the 100-year surge levels, and the second for the 1000-year return period).
– A filter is applied to select only events strong and close enough to generate 100- or 1000-year surge levels. – Wind and pressure fields are computed for each event
using parametric models.
– These fields are used as inputs to the storm surge model ADCIRC–SWAN to compute the maximum surge for each grid point and scenario.
– Cumulative distributions of maximum surge are de-duced from the computation of the selected events for all grid points.
– 100- and 1000-year surge levels are inferred for all grid points by empirically determining the surges that have a probability of 0.01 and 0.001 respectively, to be ex-ceeded each year.
– We checked afterwards that the discarded events were too weak or too far away from Guadeloupe to induce storm surges higher than the computed surge levels.
Figure 4.Number of events as a function of hurricane category. Note that the number of category 1 hurricanes is under-represented in data set 2 (equivalent to 50 000 years of hurricane activity) com-pared to data set 1 (8000 years of activity), since the weakest cate-gory 1 events are not considered in this data set.
3.1 The synthetic storm database
The two synthetic storm data sets used in this study were provided by Kerry Emanuel from MIT, and are equivalent to 8000 and 50 000 years of hurricane activity in the vicin-ity of Guadeloupe. They are constituted of 780 and 3880 events respectively (Fig. 4) and have been obtained by ap-plying the statistical-deterministic models of Emanuel et al. (2006, 2008) to the observed climate estimated from the NCEP/NCAR reanalysis between 1980 and 2011. The method essentially relies on two main steps:
– the generation of tracks, using synthetic environmental wind fields, constructed so that they conform to mean climatologies derived from the NCEP/NCAR reanalysis data set
– the estimation of the evolution of storm intensity along these tracks, using the numerical model developed by Emanuel et al. (2004) and the synthetic winds generated in the first step
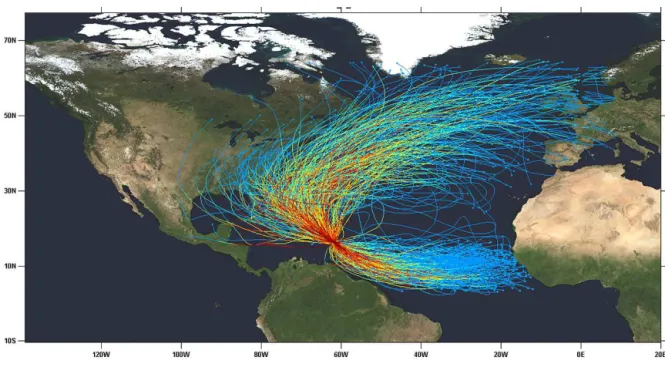
The Markov chain method for track generation was not used here since it was found not to be reliable in areas with in-sufficient historical records, such as in Boston (Emanuel et al., 2006). Conversely, the wind time series method applied here does not rely on the number of past events and pro-vides better results in the case of insufficient data records. Its main drawback (more variable tracks, such as larger num-ber of tracks with loops) does not seem to be an issue in Guadeloupe where the synthetic storms display much less variability than what can be observed at higher latitudes, with most hurricanes moving towards the northwest as is the case for hurricanes HUGO or DAVID (Fig. 5). They are thus ex-pected to properly represent hurricane activity in the vicinity of Guadeloupe.
Figure 5.Storm tracks obtained for the 300 strongest events of the second data set (50 000 years).
data in the cities of Maputo and Beira in Mozambique and in the Red River delta in Vietnam (Neumann et al., 2012, 2013).
3.2 Events selection
We computed the synthetic events in the vicinity of Guade-loupe in decreasing order of maximum wind speeds . Us-ing a trial and error approach, we found that the estimated 100- and 1000-year surge levels did not change when con-sidering storms with maximum wind speeds lower than 120 and 205 km h−1, respectively. Weaker events are therefore not taken into account in this study. Storms passing beyond 100 km from Pointe-à-Pitre are also discarded, for the same reason. The category 4–5 hurricane DAVID, which passed within 100 km from Pointe-à-Pitre in 1979, is found to in-duce storm surges significantly lower than the computed 100-year surge levels for instance, even in Marie-Galante and Les Saintes. Much stronger and larger events following a similar track are always theoretically conceivable of course, but we expect their frequency of occurrence to be too low to change our results significantly.
In all, more than 1200 hurricanes were simulated on a 240 computational cores cluster.
3.3 Wind and pressure fields
For each selected storm, the surface axisymmetric wind field is estimated by calculating the wind velocityV at the gradi-ent level with the analytical wind profile of Emanuel and Ro-tunno (2011) which has been found to give relatively good
results (Lin and Chavas, 2012): V (r)=2r(RmVm
+0.5f Rm2) R2
m+r2
−f r
2 , (1)
whereris the radius,f the Coriolis parameter,Rmthe radius of maximum winds, andVmthe maximum wind speed.
The surface wind reduction factor is set to 0.9. The asym-metry of the wind field is taken into account by adding 60 % of the storm translation velocity vector rotated by an angle of 19◦to the circular wind component, according to the findings
of Lin and Chavas (2012).
The surface pressureP is estimated from the parametric model of Holland (1980):
P (r)=(Pn−Pc)exp − R
m r
B!
+Pc, (2)
wherePcis the core pressure,Pnthe pressure at infinite
ra-dius, andBthe Holland parameter which writes B= ρeV
2 m (Pn−Pc)
, (3)
whereeis the base of natural logarithms andρthe air density. 3.4 ADCIRC–SWAN model
a wetting– drying algorithm. Wind velocities, water levels, currents and roughness lengths are passed every 10 min to the third generation wave model SWAN, which computes the wave radiation stresses and their gradients on the same un-structured mesh, and then passes those gradients as a forcing function back to ADCIRC. The spectral space in SWAN is discretized using 40 frequencies and 36 directions.
ADCIRC–SWAN has been validated against measured waves and storm surges during several historical storms (Di-etrich et al., 2011a, b, 2012; Bhaskaran et al., 2013), such as Katrina and Rita (2005), Gustav and Ike (2008), and Thane (2011). It has been used in a large variety of studies on hurricane storm surge worldwide (e.g. Sebastian et al., 2014; Bhaskaran et al., 2014).
The computational domain extends from 45–65◦W and
9.5–18.3◦N. It has been found to be sufficiently wide to
model the sea state generated by hurricanes travelling long distances from the east. It also includes the tracks of the few synthetic hurricanes travelling from the west, from their gen-esis to the time they hit Guadeloupe. It is worth noting that none of the events in the synthetic storm database maintain a west-to-east track for more than a few hundreds of kilome-tres.
Resolution varies from about 10 km in the deep ocean to 1–4 km in the Lesser Antilles, 100 m in the island shelf and up to 40–60 m on the coast and coral reefs, as highlighted in Fig. 6.
Bathymetry is specified using the 30-arc-second global model GEBCO (General Bathymetric Chart of the Oceans) in deep waters. Data from the French Naval Hydrographic and Oceanographic Department (SHOM) are available be-tween 30 m- and 1000 m-depth, with resolutions up to 20 m near the coast. Shallow waters and most of the coastal ar-eas are covered by lidar data with spatial resolutions of 1– 5 m. Topographic data of the IGN (National Institute of Ge-ographic and Forest Information) are used in the few inland areas where no better data are available.
The water levels are computed relative to IGN88. Whilst this level might be locally different from the mean sea level by a few centimetres, these differences are found to be much lower than the uncertainties on bathymetric and topographic data and to induce insignificant changes on maximum surges. The tides in Guadeloupe have a low amplitude (a few tens of centimetres) because of the narrow island shelf, and are found to have a relatively weak effect on storm surges, so they are not taken into account in this study.
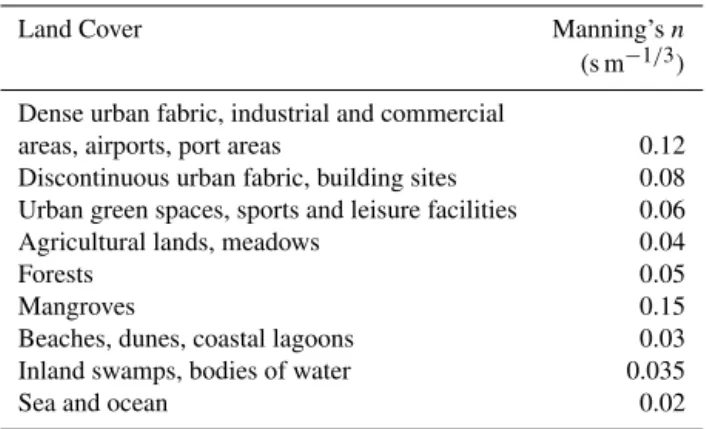
Hydraulic friction is computed in ADCIRC using Man-ning’snformula. SWAN converts these coefficients to rough-ness lengths (Dietrich et al., 2012). Values are adapted from previous numerical studies (Dietrich et al., 2012; Zhang et al., 2012), and based on Corine land cover data (Union Eu-ropeenne, 2006). They are summarized in Table 1.
Figure 6.Mesh resolution (in metres) in the Guadeloupe area.
Table 1.Manning coefficients for various categories of land cover.
Land Cover Manning’sn
(s m−1/3)
Dense urban fabric, industrial and commercial
areas, airports, port areas 0.12 Discontinuous urban fabric, building sites 0.08 Urban green spaces, sports and leisure facilities 0.06 Agricultural lands, meadows 0.04
Forests 0.05
Mangroves 0.15
Beaches, dunes, coastal lagoons 0.03 Inland swamps, bodies of water 0.035
Sea and ocean 0.02
3.5 Statistical analysis
Once all the selected events were simulated, we calculated the cumulative distributions of maximum annual surge for each grid point. The large number of synthetic storms of data set 1 (equivalent to 8000 years of data) was found to be suf-ficient to determine the 100-year surges empirically. In prac-tice, we determined for each node the surgexwhich satisfies the condition 1−F (x)=1/T, whereT is the return period in years, andF (x)the number of years for which the maxi-mum surge is lower thanx at the grid point, divided by the total number of years in the chosen data set.
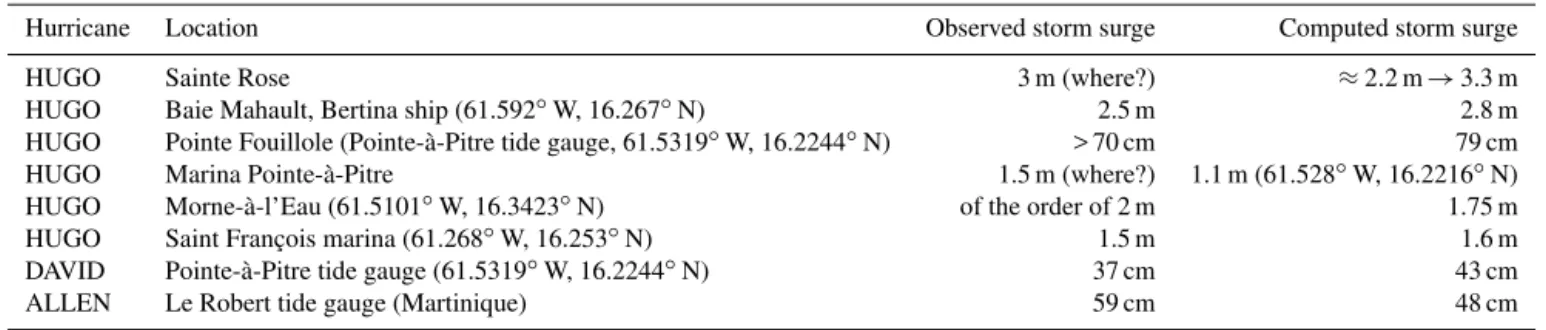
HUGO Saint François marina (61.268◦
W, 16.253◦
N) 1.5 m 1.6 m
DAVID Pointe-à-Pitre tide gauge (61.5319◦W, 16.2244◦N) 37 cm 43 cm
ALLEN Le Robert tide gauge (Martinique) 59 cm 48 cm
Table 3.Comparison of maximum 100- and 1000-year storm surges for this study and the early models of Météo France (2002) (see Fig. 2 for location).
Location Approximate Approximate Approximate
maximum 100-year maximum 100-year maximum 1000-year storm surge storm surge storm surge (Météo France, 2002) (this study) (this study)
Baie Mahault 2.05 m 1.8 m 3.3 m
Jarry 1.5 m 1.5 m 2.8 m
Mouth of PCSM 0.8 m 0.8 m 1.7 m
Mouth of GCSM 0.8 m 0.8 m 1.5 m
Saint François 0.8 m 1.6 m 2.3 m
Sainte Anne 0.8 m 1.2 m 2.2 m
Capesterre (Marie Galante) 0.6 m 1.7 m 2.4 m
South of Petit-Canal 1.6 m 1.0 m 2.0 m
Pointe-à-Pitre (Darse) 1.2 m 1.15 m 2.2 m
Pointe Fouillole 0.8 m 1.0 m 1.9 m
Petite-Terre lagoon 0.8 m 1.6 m 2.2 m
Le Souffleur (La Desirade) 0.6 m 1.5 m 2.2 m
Saint Louis (Marie Galante) 0.6 m 0.6 m 1.5 m
Deshaie < 0.6 m 0.5 m 1.0 m
A subsequent comparison of the results presented here for data set 2 (see Sect. 5) with those obtained using the first data set displayed differences generally in the order of 0–10 % at the shoreline.
4 Validation
Although the “Great Hurricane” of 1928 remains the most severe recent event in terms of storm surges, it is far bet-ter to validate computational storm surge models using ob-served data associated with hurricane HUGO in 1989, which are much more extensive and reliable than any other storm in Guadeloupe. However we have to recognize that measured data are still not really satisfactory even for this event, both in terms of quality and quantity. For example, only one tide gauge located at Pointe Fouillole near the Pointe-à-Pitre ma-rina was deployed in 1989, and the recording paper was not wide enough to display the whole surge peak, so we only know that the maximum surge exceeds 70 cm at this location. In addition, although several high-water marks and other
observations were collected all along the coasts of Guade-loupe, conditions under which they have been obtained are not always very clear, and the precise location is not always known. For example, the pontoons of the Pointe-à-Pitre ma-rina rose up to 1.5 m according to several authors (Saffache et al., 2003), but it is unclear whether this observation was made near the entrance or at the back of the marina, close to the aquarium. Similarly, a storm surge of 3 m was reported in the town of Sainte Rose, but we were not able to find where and how this value was obtained. To make up for this problem at least in part, we also compared maximum observed and computed storm surges at the Pointe-à-Pitre and Le Robert (Martinique) tide gauges for hurricanes DAVID (1979) and ALLEN (1980), respectively. All the results are summarized in Table 2. They have been obtained using the HURDAT best track database with some additions and corrections:
– Since no information is given on the radius of maximum winds for HUGO, we took the value from the Météo France report (1990): 18.5 km.
– This value was also used for DAVID, which has equiv-alent strength.
– Likewise, we attributed an arbitrary value of 20 km for the radius of maximum winds for ALLEN, which was of slightly lower intensity.
The results are found to be in relatively good agreement with observations, even if discrepancies of a few tens of centime-tres can be found locally. It is unclear whether these differ-ences are due to the model itself, the forcing data (track, in-tensity, radius of maximum winds, . . .) or the observations. Better fits can be obtained in some areas using slightly dif-ferent parameters or wind models, but considering the uncer-tainties on the observations, we do not think this “improv-ing” to be meaningful. Other parametric wind models (such as Holland 1980) were also tested for example, but the ob-servations did not show any evidence that they lead to better results than the formulation of Emanuel and Rotunno (2011). Another hypothesis was that some of the observations in-cluded a portion of the tidal signal. However, the maximum surges for hurricane HUGO occurred very close to mid-tide, with differences of a few centimetres at most compared to mean sea level.
Systematic measurement of water levels all along the shore for a future event will be critical to be able to fur-ther validate storm surge models. However, these preliminary tests seem to show that the predicted levels are of the correct order of magnitude, and that we capture the main features of storm surges along the coasts of Guadeloupe.
5 Results
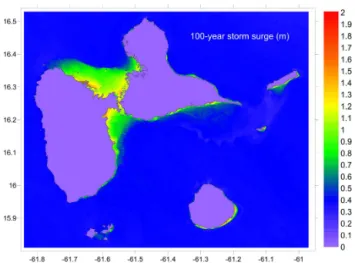
The estimated 100-year return levels of the storm surge in Guadeloupe are displayed in Fig. 7. They range from about 40 cm offshore to almost 2 m in coastal areas, with the high-est surges essentially found in the bays of GCSM and PCSM. A comparison with results of Météo France (2002) shows a relatively good agreement in these areas where the water is mostly driven by the blowing wind (Table 3). Differences are found to be very low at the mouth of PCSM and GCSM (a few centimetres at most), and found to amount to only 10– 25 cm generally at the head (in Jarry and Baie Mahault, for example). However, larger differences can be found locally, especially in mangrove areas where the water can penetrate great distances (several kilometres) and where the assump-tion made by previous models that the normal component of velocity at shoreline is zero is no longer acceptable. This is the case south of Petit-Canal for example, where the 100-year storm surge hardly exceeds 1 m whilst results from Meteo-France (2002) displayed surge heights higher than 1.6 m.
Figure 7.100-year surge levels in Guadeloupe (in metres)
Discrepancies are even more significant in areas exposed to waves. In Capesterre (Marie Galante) for instance, the surge is found to be about 1 m higher than estimated before. The same order of magnitude is obtained in Saint-François, Petite-Terre or la Desirade. Such differences are due to the fact that we take wave setup into account here: when the waves break, they exert a stress on the water column that can increase water levels up to dozens of centimetres or more at the shoreline.
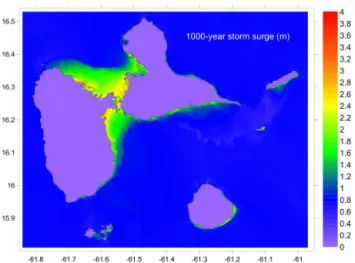
The calculated 1000-year storm surge is depicted in Fig. 8. We find the same features as before: the most exposed areas are located along the shores of GCSM and PCSM, where the large and shallow island shelf allows the wind to drive large amounts of water into the bays. Water levels can increase as high as 3 m or more, resulting in widespread flooding, espe-cially in the low-lying mangrove areas, where the water can penetrate several kilometres inland, threatening urban centres such as Morne-à-l’Eau. The south of Grande-Terre, La De-sirade and the east of Marie Galante experience lower 1000-year surges because of a narrower shelf, but the surges are still significant (around 2 m), due to an important contribu-tion of wave setup to water elevacontribu-tion. The western coast of Basse-Terre, characterized by very steep sloping shelves and not directly exposed to the waves driven by most of the hur-ricanes, is much less affected, with surges of 1 m at most.
6 Conclusions and discussion
Figure 8.1000-year surge levels in Guadeloupe (in metres).
(ADCIRC–SWAN) and a large database of synthetic storms, taking into account the natural variability in hurricane fre-quency, size, intensity and track (Emanuel et al., 2006), and representing thousands of years of cyclonic activity in the vicinity of Guadeloupe. The method developed by Emanuel et al. (2006) is found to generate storm tracks with rela-tively little variability compared to what can be obtained at higher latitudes, and to match the tracks of past events such as HUGO or DAVID. The method is therefore expected to give good results for Guadeloupe.
Storm surges are found to be highest at the head of PCSM and GCSM bays, where the large and shallow island shelf allows the wind to push large amounts of water inland, as stated before. In these areas, the 1000-year surges can exceed 3 m. However we find that they are also quite significant as well (2 m or more for the 1000-year return period) south of Grande-Terre and east of Marie-Galante, because of the wa-ter rise associated with waves breaking. The west coast of Basse-Terre remains much less affected.
Another finding is that water can penetrate several kilo-metres inland, especially in the western part of Grande-Terre in the low-lying coastal areas. Fortunately, these regions are mostly constituted of mangroves which have been found to be efficient in reducing water levels by slowing the flow of water (Zhang et al., 2012), and prevent the flooding of urban centres such as Morne-à-l’Eau even in the case of a 1000-year return period.
The predicting power of the model is assessed here by comparing results with high-water marks observed during hurricanes HUGO (1989), ALLEN (1980) and DAVID (1979). Good agreements are found. However, ob-served data are still scarce, and systematic measurements of water levels should be performed in the future whenever a storm occurs to validate the model further. Higher resolu-tions might also be necessary in some areas. Although a res-olution of 40–50 m should be sufficient in relatively flat areas such as mangrove forests, it is no longer the case to represent
only a few decades of reanalyses data could be used. This might cast doubts on its ability to adequately reproduce rare events such as hurricanes travelling long distances west-to-east, as has been observed in the past for LENNY (1999). This kind of event might be difficult to be captured satisfac-torily by the models, and should be investigated more specif-ically in the future in terms of probability of occurrence and damage potential. It must be noted however that a few syn-thetic hurricanes travelling to the east/north-east are included in the database, and are taken into account in the results pre-sented here.
Despite these uncertainties, the results presented here are found to be very close to those obtained by earlier stud-ies with very different models, methods and data (Table 3, Sect. 5) in the areas where the surge is essentially wind-dominated (Baie Mahault, Jarry and the mouth of PCSM and GCSM), with differences lower than 15 % in general for the 100-year water levels. This strongly suggests that the com-puted surges are relatively robust. To confirm this further, we computed the 1000-year surges with only half the number of events in the second data set and found differences gener-ally lower than 10–15 %. Hence only extremely large errors in our data sets are expected to induce significant changes in our results.
The approach described here can be applied to other places in the West Indies or beyond, although it might be quite de-manding in terms of computational power for large study ar-eas. We conducted a similar work for the island of Martinique for example, whose results will be presented in a future pa-per.
Acknowledgements. This work is supported by the the INTERREG IV–TSUNAHOULE project as well as the Guadeloupe region. We would like to thank Kerry Emanuel from Massachusetts Institute of Technology for providing the synthetic storm data sets, as well as Claude Cayol from Météo France for detailed information relative to hurricane HUGO. Many thanks also to Raphaël Pasquier and Jacques Laminie (UAG) for the computing cluster setup, as well as two anonymous reviewers for their comments which were of great help to improve the paper.
Edited by: I. Didenkulova
References
Bhaskaran, P. K., Nayak, S., Bonthu, S. R., Murty, P. L. N., and Sen, D.: Performance and validation of a coupled parallel ADCIRC-SWAN model for THANE cyclone in the Bay of Bengal, Envi-ron. Fluid Mech. 13, 601–623, doi:10.1007/s10652-013-9284-5, 2013.
Bhaskaran, P. K, Gayathri, R., Murty, P. L. N., Bonthu, S., and Sen, D.: A numerical study of coastal inundation and its validation for Thane cyclone in the Bay of Bengal, Coast. Eng., 83, 108–118, 2014.
Bouchon, C., Bouchon-Navaro, Y., and Louis, M.: Changes in the coastal fish communities following hurricane Hugo in Guade-loupe Island (French West Indies), Atoll Research Bulletin, 422, 1–13, 1994.
CETMEF: Vulnerabilite du territoire national aux risques littoraux-Outre Mer, report, CETMEF, France, ISBN978-2-11-129365-6, 160 pp., 2012.
Chauvet, M. and Joseph, B.: Caracterisation des impacts de la houle liee à l’ouragan Omar sur la Cote Sous le Vent de la Guadeloupe (Octobre 2008), Rapport BRGM/RP-56869-FR, 40 pp., 2008. Chauvet, M., Bodere, G., Mompelat, J. M., Oliveros, C., and
Bozor-gan, A.: Caracterisation des impacts de la houle sur les rivages de la Guadeloupe au passage de l’ouragan Dean (aout 2007)-Phase I and II. Rapport BRGM/RP-55911-FR, BRGM, 44 pp., 2007. Daniel, P.: A real-time system for forecasting hurricane storm
surges over the French Antilles, Coast. Estuar. Stud., 51, 146– 156, 1996.
Daniel, P., Haie, B., and Aubail, X.: Operational Forecasting of Tropical Cyclones Storm Surges at Météo France, Mar. Geod., 32, 233–242, 2009.
Dawson, C. N., Westerink, J. J., Feyen, J. C., and Pothina, D.: Con-tinuous, discontinuous and coupled discontinuous–continuous Galerkin finite element methods for the shallow water equations, Int. J. Numer. Methods Fluids, 52, 63–88, 2006.
DEAL Guadeloupe: Evaluation Preliminaire des Risques d’Inondation, Rapport Janvier 2012, DEAL Guadeloupe, 104 pp., 2012.
Depradine, C. A.: Pre-1900 severe hurricanes in the Caribbean, Notes compiled for the Caribbean Meteorological Institute, St. James, Barbados, 1989.
Dietrich, J. C., Zijlema, M., Westerink, J. J., Holthuijsen, L. H., Dawson, C., Luettich, R. A., Jensen, R. E., Smith, J. M., Stelling, G. S., and Stone, G. W.: Modeling hurricane waves and storm surge using integrally-coupled scalable computations, Coast. Eng., 58, 45–65, 2011a.
Dietrich, J. C., Westerink, J. J., Kennedy, A. B., Smith, J. M., Jensen, R. E., Zijlema, M., Holthuijsen, L. H., Dawson, C. N., Luettich Jr., R. A., Powell, M. D., Cardone, V. J., Cox, A. T., Stone, G. W., Pourtaheri, H., Hope, M. E., Tanaka, S., Westerink, L. G., Westerink, H. J., and Cobell, Z.: Hurricane Gustav (2008) waves and storm surge: hindcast, synoptic analysis, and valida-tion in Southern Louisiana, Mon. Weather Rev., 139, 2488–2522, 2011b.
Dietrich, J. C., Tanaka, S., Westerink, J. J., Dawson, C. N., Luettich Jr., R. A., Zijlema, M., Holthuijsen, L. H., Smith, J. M., Westerink, L. G., and Westerink, H. J.: Performance of the Unstructured-Mesh, SWAN+ADCIRC Model in Computing Hurricane Waves and Surge, J. Sci. Comput., 52, 468-497, 2012.
Dorville, J.-F. M. and Zahibo, N.: Hurricane Omar Waves Impact on the West Coast of the Guadeloupe Island, October 2008, Open Oceanography Journal, 4, 83–91, 2010.
Emanuel, K. and Rotunno, R.: Self-stratification of tropical cyclone outflow. Part I: Implications for storm structure, J. Atmos. Sci., 68, 2236–2249, 2011.
Emanuel, K., DesAutels, C., Holloway, C., and Korty, R.: Environ-mental control of tropical cyclone intensity, J. Atmos. Sci., 61, 843–858, 2004.
Emanuel, K., Ravela, S., Vivant, E., and Risi, C.: A statistical deter-ministic approach to hurricane risk assessment, Bull. Am. Mete-orol. Soc., 87, 299–314, 2006.
Emanuel, K., Sundararajan, R., and Williams, J.: Hurricanes and global warming: Results from downscaling IPCC AR4 simula-tions, B. Am. Meteorol. Soc., 89, 347–367, doi:10.1175/BAMS-89-3-347, 2008.
Francis, J. K. and Gillespie, A. J. R.: Relating gust speed to tree damage in hurricane Hugo, 1989, J. Arboriculture, 19, 368–373, 1993.
Holland, G. J.: An analytic model of the wind and pressure profiles in hurricanes, Mon. Weather. Rev., 108, 1212–1218, 1980. Hope, M. E., Westerink, J. J., Kennedy, A. B., Kerr, P. C.,
Diet-rich, J. C., Dawson, C., Bender, C.,Smith, J. M., Jensen, R. E., Zijlema, M., Holthuijsen, L. H., Luettich, R. A., Powell, M. D., Cardone, V. J., Cox, A. T., Pourtahen, H., Roberts, H. J., Atkin-son, J. H., Tanaka, S., Westerink, H. J., and Westerink, L. G.: Hindcast and validation of Hurricane Ike (2008): waves, forerun-ner, and stormsurge, J. Geophys. Res.-Oceans, 118, 4424–4460, 2013.
Imbert, D., Labbé, P., and Rousteau, A.: Hurricane damage and for-est structure in Guadeloupe, French Wfor-est Indies, J. Trop. Ecol., 12, 663–680, 1996.
Kennedy, A. B., Gravois, U., Zachry, B. C., Westerink, J. J., Hope, M. E., Dietrich, J. C., Powell, M. D., Cox, A. T., Luettich Jr., R. A., and Dean, R. G.: Origin of the Hurri-cane Ike forerunner surge, Geophys. Res. Lett., 38, L08608, doi:10.1029/2011GL047090, 2011.
Lecacheux, S., Muller, H., Pedreros, R., Thiebot, J., Ouriqua, J., and Reveillere, A.: Etude probabiliste des vagues cycloniques le long du littoral Guadeloupeen, XIIeme Journees Nationales Genie Cotier-Genie Civil, 12–14 June, doi:10.5150/jngcgc.2012.104-L, 949–956, 2012.
Lefevre, J. M.: High swell warnings in the Caribbean Islands during March 2008, Nat. Hazards, 49, 361–370, 2009.
Lin, N. and Chavas, D.: On hurricane parametric wind and applica-tions in storm surge modeling, J. Geophys. Res., 117, D09120, doi:10.1029/2011JD017126, 2012.
Lin, N., Emanuel, K. A., Smith, J. A., and Vanmarcke, E.: Risk as-sessment of hurricane storm surge for New York City, J. Geo-phys. Res.-Atmos., 115, D18121, doi:10.1029/2009JD013630, 2010.
Lin, N., Emanuel, K., Oppenheimer, M., and Vanmarcke, E.: Phys-ically based assessment of hurricane surge threat under climate change, Nature Climate Change, 2, 462–467, 2012.
Luettich, R. A. and Westerink, J. J.: Formulation and numerical im-plementation of the 2D/3D ADCIRC finite element model ver-sion 44.XX, University of North Carolina, 74 pp., 2004. Martin, R. and Mompellat, J. M.: Les conséquences de la houle
R., Balakrishnan Nair, T. M., Srinivasa Kumar, T., and Shenoi, S. S. C.: A coupled hydrodynamic modeling system for PHAILIN cyclone in the Bay of Bengal, Coast. Eng., 93, 71–81, 2014. Neumann, J. E., Emanuel, K. A., Ravela, S., Ludwig, L. C., and
Verly, C.: Risks of Coastal Storm Surge and the Effect of Sea Level Rise in the Red River Delta, Vietnam. UNU-WIDER Working Paper No. 2012/81, September 2012, UNU-WIDER, 24 pp., 2012.
Neumann, J. E., Emanuel, K. A., Ravela, S., Ludwig, L. C., and Verly, C.: Assessing the risk of cyclone-induced storm surge and sea level rise in Mozambique, UNU-WIDER Working Paper No. 2013/03, UNU-WIDER, 18 pp., 2013.
Sebastian, A., Proft, J., Dietrich, J. C., Du, W., Bedient, P. B., and Dawson, C. N.: Characterizing hurricane storm surge behavior in Galveston Bay using the SWAN+ADCIRC model, Coast. Eng., 88, 171–181, 2014.
Union Europeenne: SoeS CORINE Land Cover, UE, 2006. Zahibo, N., Pelinovsky, E., Talipova, T., Rabinovich, A., Kurkin,
A., and Nikolkina, I.: Statistical analysis of cyclone hazard for Guadeloupe, Lesser Antilles, Atmos. Res., 84, 13–29, 2007. Zhang, K., Liu, H., Li, Y., Xu, H., Shen, J., Rhome, J., and Smith,