AR
TICLE
1 Instituto Federal Catarinense. R. Cruz e Souza 100, Centro. 89580-000 Fraiburgo SC Brasil. vladimirschuindt@ hotmail.com 2 Instituto Federal de Educação, Ciência e Tecnologia do Rio de Janeiro. Rio de Janeiro RJ Brasil.
3 Departamento de Educação Física, Universidade Federal de Santa Catarina. Florianópolis SC Brasil. 4 Departamento de Epidemiologia e Métodos Quantitativos em Saúde, Escola Nacional de Saúde Pública, Fundação Oswaldo Cruz. Rio de Janeiro RJ Brasil.
Trends and association of BMI between sociodemographic
and living conditions variables in the Brazilian elderly:
2002/03-2008/09
Abstract This study aimed to describe BMI’s short-term trends and analyze the association between the Body Mass Index (BMI) and the so-ciodemographic variables and variables of family perception of the sufficiency and type of food con-sumed by Brazilian elderly of both sexes. The au-thors used data from the Household Budget Sur-veys (HBS) collected by the Brazilian Institute of Geography and Statistics (IBGE) in 2002/03 and 2008/09. The prevalence of overweight and obesi-ty increased, whereas normal and low weight de-creased. Multinomial regression models were used for 2008/09 to analyze the association between BMI and sociodemographic variables and vari-ables of family perception of the sufficiency and type of food intake. Income and age were more associated with BMI. We suggest that health and nutrition prevention and monitoring measures be implemented through public policies, considering multifactorial overweight in the Brazilian elderly.
Key words Nutritional status, Elderly,
Epidemi-ological surveys, Body Mass Index
Vladimir Schuindt da Silva 1
Israel Souza 2
Diego Augusto Santos Silva 3
Aline Rodrigues Barbosa 3
Sil
va V
Introduction
Population ageing causes changes in the nutri-tional and epidemiological profile worldwide, with a predominance of non-transmissible dis-eases1, which can lead the elderly to a quicker loss
of autonomy and quality of life. Metabolic, phys-iological, psychological and biochemical changes are the most common events and directly affect the nutritional status2.
The nutritional status is the physiological state of an individual, which results from the relationship between nutrient intake and the body’s need and ability to digest, absorb and use these nutrients3, and its analysis in the elderly, by
means of epidemiological studies, can be per-formed by anthropometry, which is a simple-use harmless method that is easy to interpret and has less cultural restrictions.
The anthropometric body mass and height variables favor the evaluation of the nutrition and health process4, with frequent use of the
body mass index (BMI) to evaluate the nutri-tional status5.
High prevalence of underweight and over-weight / obesity in elderly of both sexes were re-corded in high and middle-income countries6-8.
In Brazil, national surveys from 1977 to 20139-13
show that there was an increased prevalence of overweight associated with sociodemographic conditions.
Overweight is related to increased chronic noncommunicable diseases (CNCD), which are the main causes of disease and mortality burden in Brazil, with 72.4% of total deaths14, and more
than half of these deaths are food-related15. One
of the main factors related to the ageing process, which can even contribute to healthy ageing, is food consumption2.
Food consumption can be estimated through subjective assessment of living conditions, fam-ily perception of sufficiency and type of food consumed11,12, surveyed in each household
inter-viewed in the Family Budget Surveys (POFs) of 2002/2003 and 2008/2009.
Family perception of the adequacy and type of food consumed is part of the “access”3 to food
realm, from the wide range of food and nutri-tional security (FNS)16. In addition, they are
generally used to analyze the subjective poverty through specific methods to identify monetary poverty17,18. Thus, it can contribute to identify
groups at risk of inadequate consumption and help to better understand the current panorama
of the nutritional status of the elderly population aged 60 years or older in the country.
The subjective assessment of living condi-tions are based on World Bank (WB) studies on this specific area19, and, in Brazil, they were
ini-tially used by the Brazilian Institute of Geogra-phy and Statistics (IBGE) from the Living Stan-dards Survey (PPV/1996)20 in agreement with
the WB, and incorporated into the topic from the POF 2002/0311, with the construction of
ques-tions and “POF 6” questionnaires based on the “Living Standards Measurement Study” (LSMS) methodology carried out by the WB in different countries of the world21.
This study aims to analyze the association between BMI and sufficiency and type of food consumed in the Brazilian population of elderly aged 60 years and over from 2002/03 to 2008/09.
Methods
Sampling
This study used public domain secondary data from 2002/03 and 2008/09 POFs, both with national coverage and comparable methodol-ogies, conducted by IBGE in two periods: from June 2002 to July 2003 and from May 2008 to May 200911,12.
aúd
e C
ole
tiv
a,
23(3):891-901,
2018
Target population and sample
The target population of this study was the elderly aged 60 years and older, of both sexes, liv-ing in the five Brazilian regions of the country. The total sample was 19,189 (POF 2002/03) and 27,891 (POF 2008/09), however, considering the expanded sample, was 15,581,735 and 19,633,067 individuals, by 2002/03 and 2008/09 POFs, re-spectively, after the exclusion of incomplete data from the elderly (2.5%).
Study variables
The dependent variable analyzed was the classification of nutritional status based on BMI [BMI = body mass (kg)/height (m2)]. The cut-off
values adopted to assess nutritional status were proposed by WHO: low weight (BMI ≤ 18.5 kg/ m2); adequate weight (18.5 <BMI <25 kg/m2);
overweight (25 ≤ BMI <30 kg/m2) and obesity
(BMI ≥ 30.00 kg/m2)22.
Body mass and height were measured using a portable electronic scale for adults (mark not specified by the IBGE), with a sensitivity of at least 100 g, maximum capacity of 150 kg, and KaWe PERSON-CHECK® portable adult stadi-ometer (KaWe, Germany) with a precision of 0.1 cm and extension of up to 200 cm, respectively, as per recommendations of the Research Agent Manuals11,12.
The independent variables of the study were: Living conditions: family perception of suf-ficiency (usually insufficient, sometimes insuffi-cient, always sufficient) and type (always as de-sired, not always as dede-sired, rarely as desired) of food consumed.
The potential confounding variables of the study were:
Demographic characteristics: age group (60-64, 65-69, 70-74, 75-79, and 80 years and over - for simple and continuous analysis in multiple analysis), gender (male, female), self-reported skin color/ethnicity (white, black and brown - yellow and indigenous were suppressed due to low percentage of Brazilian elderly self-classified in these categories);
Socioeconomic characteristics: large regions (north, northeast, southeast, south and mid-west), schooling (0-5, 6-9, 10-12, and 13 years or more of schooling - for simple and continuous analysis in multiple analysis), low monthly family income (percentile ≤ 25); middle (25 <percentile <75); high (percentile ≥ 75), from the equiva-lent amounts in Federal Minimum Wages (SM)
for the 2002/03 and 2008/09 periods, of R$ 200 and R$ 415, respectively. All the 2002/2003 POF income was inflated, based on the accumulated variation of the Broad National Consumer Price Index of 39.37%, in order to represent values compatible with those obtained in the 2008/09 survey.
Data review
Comparisons between the prevalence surveys of the categories of variables in the nutritional status classification were performed using the Pearson Chi-square test to verify significant dif-ferences in the period studied.
Multinomial regression models (reference category was the eutrophic classification of nu-tritional status) were obtained by stepwise for-ward Wald, non-automatic, starting with the variables “year + type of food consumed + suffi-ciency of food consumed”, and at each stage the other variables were added one by one, adopting the following order: skin color/ethnicity; age group; schooling; income; region. The associ-ation was quantified by the odds ratio and the respective 95% confidence intervals in the peri-od from 2002/03 to 2008/09. All variables with p value < 0.05 in any of the nutritional status clas-sifications were maintained in the final multino-mial analysis model. The significance of variables and models was evaluated. The existence of con-founders was considered when the unadjusted estimate of probability differed from the adjust-ed estimate, promoting a change in the status of the association, but did not show results different from those found for the final models (data not shown). In addition, we evaluated the increment in the explanation of the model due to the en-try of each variable with the use of Nagelkerke Pseudo R2. Such a test is an approximation of the
coefficient of determination of linear regression. In the multinomial regression, however, no co-efficient can accurately explain the variation in the statistical model by including or removing a predictor as proposed by the coefficient of deter-mination. Thus, in this study, we evaluated how much each predictor affects the dependent vari-able when included in the regression model23.
All the analytical procedures of this study were performed with the Statistical Package for the Social Sciences (SPSS) 20.0™ 24 and
Sil
va V
The Research Ethics Committee of the Na-tional School of Public Health/Oswaldo Cruz Foundation approved this study, filed under No. 13/2013, which follows the requirements and procedures of Resolution No. 466/12 of the Na-tional Health Council, which regulates human research25.
Results
Of the 35,214,802 elderly individuals aged 60 years or older studied (considering sample ex-pansion), most were female (55.3%). The prev-alence of low weight, overweight and obesity was 5.2%, 33.2% and 14.0% for 2002/2003, and 3.2%, 37.4% and 18.2% for 2008/2009, respectively. The comparison between the surveys, accord-ing to socioeconomic variables and variables of family perception about the sufficiency and type of food consumed showed that the prevalence of low weight decreased and overweight and obesity increased in men (Table 1) and women (Table 2) .
For males, the highest increases in the preva-lence of overweight were observed in browns aged from 65 to 69 years, with 13 years of schooling or more, low and middle income, of the North Re-gion, with sufficiency and type of food consumed reported as “sometimes insufficient” and “not al-ways as desired”, respectively. As for obesity, they were found in blacks, in the last age range, with 6 to 9 years of schooling, middle-income level, of the Southern Region, with sufficiency and type of food consumed reported as “not usually suf-ficient” and “not always as desired”, respectively. However, there was a reduced prevalence of over-weight in blacks with 6 to 12 years of schooling.
As for women, the largest increases in the prevalence of overweight were observed in whites aged from 70 to 74 years, with 10-12 years of schooling, high income level, of the North Re-gion, with sufficiency and type of food consumed reported “sometimes insufficient” and “always as desired/not always as desired”, respectively. More-over, for obesity, they were found in blacks aged from 65 to 69 years, with 6 to 9 years of school-ing, high-income, of the Midwest Region, with sufficiency and type of food consumed reported as “always sufficient” and “not always as desired”, respectively. However, reduced overweight prev-alence was observed in black elderly women with 6 to 9 years of schooling.
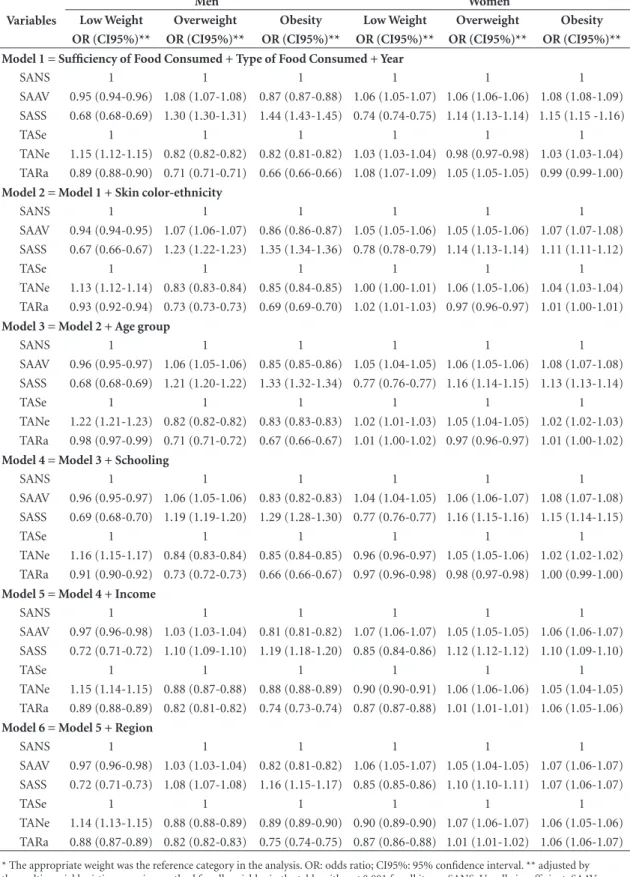
In Table 3, the first model showed that the el-derly who reported sufficiency of food consumed as “always sufficient” were 30% more likely to
be overweight and 44% to be obese than those of adequate weight, and among the elderly, the magnitude was about 15% for the two categories of BMI. However, in relation to the type of food consumed, the elderly who reported “not always as desired” (men) and “rarely as desired” (wom-en) were more likely to be underweight.
After adjusting for skin color/ethnicity, age group, schooling, income and region, between the variables of family perception about suffi-ciency and type of food consumed and the cat-egories of BMI analyzed, the other associations remained in the direction and magnitude close to the model 1 (Table 3). Thus, it is observed that variables used in the analysis were not identified as confounding factors.
The input of each variable was significant, with all variables remaining in the final model and with increasing explanatory power at each step of the stepwise forward Wald method, by the Nagelkerke Pseudo R2 values, highlighting the
largest increments in the inclusion of age group [model 3; 5.7% (men) and 2.9% (women)] and income [model 5; 7.5% (men) and 4.0% (wom-en)] variables.
Discussion
The results of this study evidenced an increased prevalence of overweight and obesity and de-creased underweight among Brazilian elderly people aged 60 years or over, of both sexes, in the period from 2002/03 to 2008/09, reinforcing the nutritional transition in Brazil. In addition, overweight and obesity were more likely to be found among the elderly who reported that food consumed was always sufficient, and low weight were more likely to be found among those who reported that food type consumed was “not al-ways as desired” (men) and “rarely as desired” (women). Moreover, age group and income were the variables that contributed the most to explain associations between BMI and sociodemograph-ic variables and variables of suffsociodemograph-iciency and type of food consumed.
The literature indicates that factors associat-ed with overweight and obesity are different be-tween genders, data similar to that observed in this study6-8,22,26.
aúd
e C
ole
tiv
a,
23(3):891-901,
2018
automation of daily activities and the low rates of physical activity practice27,28. However, low weight
should be a focus of continuous interest of the public health bodies, even showing a decrease in the period investigated, since studies showed that lower quality of life and higher mortality from all causes were associated with this condition of nutritional status29-31.
Some authors argue that variables analyzed on a subjective basis on living conditions can be used to show individuals’ real perception of
ac-cess to food32,33 and, in association with other
in-formation contained in the 2002/03 and 2008/09 POFs, provide a set of information that enriches the understanding of health problems in the Bra-zilian elderly population.
Thus, this study found that elderly who re-ported “usually insufficient” and “sometimes in-sufficient” consumption of food were more likely to be underweight, perhaps due to the difficulty of access to food because of issues related to so-cial exclusion, indicating that the problem of low Table 1. Prevalence of low weight (LW), overweight (OW) and obesity (O), by sociodemographic variables and variable of family perception on the sufficiency and type of food consumed by the elderly (men). Brazil, 2002/03-2008/09. *
Variables
2002/03 (A) 2008/09 (B) Variation (B-A)**
LW OW O LW OW O LW OW O
% % % % % % % % %
Skin color/ethnicity
White 4.8 35.6 10.4 2.3 41.5 15.1 -2.5 5.9 4.7
Black 7.1 36.5 6.6 3.2 30.8 12.5 -3.9 -5.7 5.9
Brown 4.5 29.6 6.7 3.0 35.8 11.0 -1.5 6.2 4.3
Age group (years)
60 to 64 2.2 38.8 10.0 2.5 41.7 15.3 0.3 2.9 5.3
65 to 69 3.8 30.5 11.3 1.9 40.4 12.4 -1.9 9.9 1.1
70 to 74 4.1 36.5 8.3 3.3 39.0 12.9 -0.8 2.5 4.6
75 to 79 7.8 27.6 7.7 3.1 33.2 14.1 -4.7 5.6 6.4
≥ 80 12.8 27.1 2.7 2.9 30.2 9.7 -9.9 3.1 7.0
Schooling (years)
0 to 5 5.4 32.3 8.1 3.1 36.9 12.4 -2.3 4.6 4.3
6 to 9 2.8 40.9 6.8 1.0 37.0 16.3 -1.8 -3.9 9.5
10 to 12 1.2 42.5 16.0 1.9 39.5 18.6 0.7 -3.0 2.6
≥ 13 2.3 39.5 14.7 1.0 50.2 11.0 -1.3 10.7 -3.7
Income
Low 7.4 24.0 6.6 3.6 30.2 9.4 -3.8 6.2 2.8
Middle 5.3 31.5 7.4 2.7 37.7 13.5 -2.6 6.2 6.1
High 2.8 42.2 12.4 1.9 44.7 15.4 -0.9 2.5 3.0
Region
North 5.6 30.4 7.8 2.1 38.1 9.6 -3.5 7.7 1.8
Northeast 5.8 27.7 5.9 3.9 33.9 9.9 -1.9 6.2 4.0
Southeast 4.4 36.2 10.1 2.3 39.4 14.4 -2.1 3.2 4.3
South 4.5 37.1 10.9 1.4 44.1 16.8 -3.1 7.0 5.9
Midwest 4.1 35.5 8.9 3.2 37.2 14.1 -0.9 1.7 5.2
Sufficiency of Food Consumed
Usually insufficient 6.4 30.9 6.1 3.7 30.3 12.4 -2.7 -0.6 6.3
Sometimes insufficient 6.3 28.8 7.0 3.6 38.2 9.1 -2.7 9.4 2.1
Always sufficient 3.7 37.1 10.6 2.2 39.5 14.8 -1.5 2.4 4.2
Type of Food Consumed
Always as desired 3.3 39.0 12.8 2.0 41.4 14.3 -1.3 2.4 1.5
Not always as desired 5.6 31.8 7.6 3.0 37.5 13.1 -2.6 5.7 5.5
Rarely as desired 4.9 30.5 6.4 3.1 32.5 10.8 -1.8 2.0 4.4
Sil
va V
weight would still be socioeconomic in Brazil34.
However, it is known that moderate food inse-curity can be associated with overweight and obesity16, and it is not ruled out that elderly who
reported “always sufficient” food consumption and that food type was “always as desired” or “not always a desired”, which were more likely to be overweight and obese, could be food insecure.
This study did not analyze the characteristics of the eating habits of the elderly for more
accu-rate inferences about food intake. However, it can be speculated that overweight elderly people who eat food as desired may opt for food rich in sim-ple carbohydrates and fats, consequently adopt-ing a monotonous diet, and evidencadopt-ing depletion of essential nutrients for health maintenance and disease control35. Evidence regarding the
inade-quate diet of the Brazilian elderly for vitamins A, C, D, E, thiamine, pyridoxine, calcium, magne-sium, zinc and copper minerals and customary Table 2. Prevalence of low weight (LW), overweight (OW) and obesity (O), by sociodemographic variables and variable of family perception on the sufficiency and type of food consumed by the elderly (women). Brazil, 2002/03-2008/09. *
Variables
2002/03 (A) 2008/09 (B) Variation (B-A)**
LW OW O LW OW O LW OW O
% % % % % % % % %
Skin color/ethnicity
White 4.7 32.0 19.7 3.2 36.8 23.0 -1.5 4.8 3.3
Black 5.2 37.5 15.5 3.5 34.3 21.1 -1.7 -3.2 5.6
Brown 7.4 33.5 15.7 4.5 36.8 20.9 -2.9 3.3 5.2
Age group (years)
60 to 64 3.8 34.5 22.8 2.1 38.4 24.8 -1.7 3.9 2.0
65 to 69 4.7 36.6 16.3 3.2 37.2 22.7 -1.5 0.6 6.4
70 to 74 5.9 32.8 17.3 4.5 37.0 22.2 -1.4 4.2 4.9
75 to 79 6.4 31.7 14.1 4.2 35.5 22.6 -2.2 3.8 8.5
≥ 80 9.4 24.7 15.6 6.5 32.2 14.7 -2.9 7.5 -0.9
Schooling (years)
0 to 5 6.0 32.6 18.2 3.9 36.1 22.1 -2.1 3.5 3.9
6 to 9 2.5 45.2 21.1 1.8 34.4 28.6 -0.7 -10.8 7.5
10 to 12 2.1 29.9 16.2 3.3 38.6 22.2 1.2 8.7 6.0
≥ 13 1.5 32.6 14.9 2.2 40.0 19.4 0.7 7.4 4.5
Income
Low 9.0 28.8 15.9 5.6 32.2 19.8 -3.4 3.4 3.9
Middle 5.6 34.9 17.4 3.9 37.9 21.8 -1.7 3.0 4.4
High 7.3 32.0 14.6 3.6 37.5 20.5 -3.7 5.5 5.9
Region
North 7.3 32.0 14.6 3.6 37.5 20.5 -3.7 5.5 5.9
Northeast 7.8 32.2 15.7 4.7 35.6 19.3 -3.1 3.4 3.6
Southeast 4.2 31.8 19.0 3.3 37.2 22.3 -0.9 5.4 3.3
South 4.1 36.4 22.1 2.7 36.9 27.1 -1.4 0.5 5.0
Midwest 8.6 37.1 14.1 4.7 34.2 20.9 -3.9 -2.9 6.8
Sufficiency of Food Consumed
Usually insufficient 6.6 34.2 16.9 4.8 30.5 21.1 -1.8 -3.7 4.2
Sometimes insufficient 7.0 30.8 19.2 4.3 37.2 20.1 -2.7 6.4 0.9
Always sufficient 4.4 33.9 17.8 3.4 37.1 22.9 -1.0 3.2 5.1
Type of Food Consumed
Always as desired 4.5 32.7 18.8 3.5 36.8 22.2 -1.0 4.1 3.4
Not always as desired 5.6 33.1 17.8 3.8 37.2 22.2 -1.8 4.1 4.4
Rarely as desired 7.2 32.7 17.9 3.5 32.9 21.3 -3.7 0.2 3.4
aúd
e C
ole
tiv
a,
23(3):891-901,
2018
Table 3. Association between body mass index (kg/m2) and sociodemographic variables and variable of family perception on the sufficiency and type of food consumed by the elderly of both sexes. Brazil, 2008/09.*
Men Women
Variables Low Weight Overweight Obesity Low Weight Overweight Obesity OR (CI95%)** OR (CI95%)** OR (CI95%)** OR (CI95%)** OR (CI95%)** OR (CI95%)** Model 1 = Sufficiency of Food Consumed + Type of Food Consumed + Year
SANS 1 1 1 1 1 1
SAAV 0.95 (0.94-0.96) 1.08 (1.07-1.08) 0.87 (0.87-0.88) 1.06 (1.05-1.07) 1.06 (1.06-1.06) 1.08 (1.08-1.09) SASS 0.68 (0.68-0.69) 1.30 (1.30-1.31) 1.44 (1.43-1.45) 0.74 (0.74-0.75) 1.14 (1.13-1.14) 1.15 (1.15 -1.16)
TASe 1 1 1 1 1 1
TANe 1.15 (1.12-1.15) 0.82 (0.82-0.82) 0.82 (0.81-0.82) 1.03 (1.03-1.04) 0.98 (0.97-0.98) 1.03 (1.03-1.04) TARa 0.89 (0.88-0.90) 0.71 (0.71-0.71) 0.66 (0.66-0.66) 1.08 (1.07-1.09) 1.05 (1.05-1.05) 0.99 (0.99-1.00)
Model 2 = Model 1 + Skin color-ethnicity
SANS 1 1 1 1 1 1
SAAV 0.94 (0.94-0.95) 1.07 (1.06-1.07) 0.86 (0.86-0.87) 1.05 (1.05-1.06) 1.05 (1.05-1.06) 1.07 (1.07-1.08) SASS 0.67 (0.66-0.67) 1.23 (1.22-1.23) 1.35 (1.34-1.36) 0.78 (0.78-0.79) 1.14 (1.13-1.14) 1.11 (1.11-1.12)
TASe 1 1 1 1 1 1
TANe 1.13 (1.12-1.14) 0.83 (0.83-0.84) 0.85 (0.84-0.85) 1.00 (1.00-1.01) 1.06 (1.05-1.06) 1.04 (1.03-1.04) TARa 0.93 (0.92-0.94) 0.73 (0.73-0.73) 0.69 (0.69-0.70) 1.02 (1.01-1.03) 0.97 (0.96-0.97) 1.01 (1.00-1.01)
Model 3 = Model 2 + Age group
SANS 1 1 1 1 1 1
SAAV 0.96 (0.95-0.97) 1.06 (1.05-1.06) 0.85 (0.85-0.86) 1.05 (1.04-1.05) 1.06 (1.05-1.06) 1.08 (1.07-1.08) SASS 0.68 (0.68-0.69) 1.21 (1.20-1.22) 1.33 (1.32-1.34) 0.77 (0.76-0.77) 1.16 (1.14-1.15) 1.13 (1.13-1.14)
TASe 1 1 1 1 1 1
TANe 1.22 (1.21-1.23) 0.82 (0.82-0.82) 0.83 (0.83-0.83) 1.02 (1.01-1.03) 1.05 (1.04-1.05) 1.02 (1.02-1.03) TARa 0.98 (0.97-0.99) 0.71 (0.71-0.72) 0.67 (0.66-0.67) 1.01 (1.00-1.02) 0.97 (0.96-0.97) 1.01 (1.00-1.02)
Model 4 = Model 3 + Schooling
SANS 1 1 1 1 1 1
SAAV 0.96 (0.95-0.97) 1.06 (1.05-1.06) 0.83 (0.82-0.83) 1.04 (1.04-1.05) 1.06 (1.06-1.07) 1.08 (1.07-1.08) SASS 0.69 (0.68-0.70) 1.19 (1.19-1.20) 1.29 (1.28-1.30) 0.77 (0.76-0.77) 1.16 (1.15-1.16) 1.15 (1.14-1.15)
TASe 1 1 1 1 1 1
TANe 1.16 (1.15-1.17) 0.84 (0.83-0.84) 0.85 (0.84-0.85) 0.96 (0.96-0.97) 1.05 (1.05-1.06) 1.02 (1.02-1.02) TARa 0.91 (0.90-0.92) 0.73 (0.72-0.73) 0.66 (0.66-0.67) 0.97 (0.96-0.98) 0.98 (0.97-0.98) 1.00 (0.99-1.00)
Model 5 = Model 4 + Income
SANS 1 1 1 1 1 1
SAAV 0.97 (0.96-0.98) 1.03 (1.03-1.04) 0.81 (0.81-0.82) 1.07 (1.06-1.07) 1.05 (1.05-1.05) 1.06 (1.06-1.07) SASS 0.72 (0.71-0.72) 1.10 (1.09-1.10) 1.19 (1.18-1.20) 0.85 (0.84-0.86) 1.12 (1.12-1.12) 1.10 (1.09-1.10)
TASe 1 1 1 1 1 1
TANe 1.15 (1.14-1.15) 0.88 (0.87-0.88) 0.88 (0.88-0.89) 0.90 (0.90-0.91) 1.06 (1.06-1.06) 1.05 (1.04-1.05) TARa 0.89 (0.88-0.89) 0.82 (0.81-0.82) 0.74 (0.73-0.74) 0.87 (0.87-0.88) 1.01 (1.01-1.01) 1.06 (1.05-1.06)
Model 6 = Model 5 + Region
SANS 1 1 1 1 1 1
SAAV 0.97 (0.96-0.98) 1.03 (1.03-1.04) 0.82 (0.81-0.82) 1.06 (1.05-1.07) 1.05 (1.04-1.05) 1.07 (1.06-1.07) SASS 0.72 (0.71-0.73) 1.08 (1.07-1.08) 1.16 (1.15-1.17) 0.85 (0.85-0.86) 1.10 (1.10-1.11) 1.07 (1.06-1.07)
TASe 1 1 1 1 1 1
TANe 1.14 (1.13-1.15) 0.88 (0.88-0.89) 0.89 (0.89-0.90) 0.90 (0.89-0.90) 1.07 (1.06-1.07) 1.06 (1.05-1.06) TARa 0.88 (0.87-0.89) 0.82 (0.82-0.83) 0.75 (0.74-0.75) 0.87 (0.86-0.88) 1.01 (1.01-1.02) 1.06 (1.06-1.07)
Sil
va V
excessive sodium intake for both sexes reinforce these speculations36.
Younger adults with higher income were more likely to be overweight and obese in this study, although for both sexes, blacks with 6-12 years of schooling showed a slight reduced prev-alence of overweight. A possible explanation for this effect would be the adoption of daily habits that they had in adulthood, such as work-related stress, since people retire on average three years after the minimum age in Brazil37. Thus, these
elderly may have commitments with work sched-ules and daily tasks that prevent greater health care. However, a natural loss of muscle mass occurs with age, which may also reflect reduced overweight and obesity38.
The effect of income could be related to the fact that elderly people with high income, while with higher access conditions to health services, healthy food purchase and levels of physical ac-tivity during leisure in paid environments39, do
not show a healthy weight status, perhaps due to the high consumption of ultra-high-calorie processed food, sugar-added beverages and in-sufficient physical activity in their daily routine40.
While data from the National Food Survey (INA) have pointed to older people as the only group to include more fruits and vegetables among the most prevalent food, it is known that the prev-alence of oil, fat and other ingredients used in food preparation may have been underestimat-ed, as these items were not reported in isolation when they were part of a dish41.
In Brazil, in the end, those with low-income levels face both malnutrition and overweight and obesity42. A meta-analysis, including 32 studies,
with 197,940 elderly people aged 65 years and over pointed to the greatest increase in mortality risk to those with 20 ≤ BMI <20.9 kg/m2 43. Thus,
government actions underway in the country are increasingly important to minimize acute mal-nutrition, allowing access to better nutrition by the most vulnerable subpopulations28.
This study has some limitations, such as the non-use of cutoff values adopted by the Food and Nutrition Surveillance System (SISVAN) to classify the nutritional status of the elderly in the Country2, which were tested but did not show
results different than those found in this study. Therefore, we chose the WHO cutoff values22, for
further comparisons with data available in the literature.
POFs were not designed with the sole objec-tive of studying determinants of nutritional sta-tus and we should consider the lack of a broader
set of covariables that could better describe the pattern of this outcome, such as lifestyle, physical activity practice and the very preventive health care, which influence weight status44,45. However,
we highlight the relevance of this study, which analyzed the association of BMI and sociode-mographic variables and variables of living con-ditions, sufficiency and type of food consumed, using anthropometric variables measured, in a national sample of Brazilian elderly people aged 60 years or over, with scarce literature’s informa-tion on the subject.
It is important to note that there is no con-sensus among researchers as to how much sub-jective information correlates with the reality of individuals46 and that such information expresses
the respondent’s perception as indicated by the families as the most appropriate respondent. Thus, same situation of living conditions may be considered extremely favorable to a particu-lar person or family group, as opposed to others, with different histories, desires, aspirations or culture, who see them as unfavorable11,12.
The selected variables of family perception about the adequacy and type of food consumed are insufficient to fully comprehend the problem of FNS16. Nonetheless, debates on the subject
have become increasingly intense and broad in recent years and the demands regarding the pro-duction of knowledge that has the potential to contribute to this field of interest are increasing47.
However, it helps to understand the quality of life of the Brazilian population, which was historical-ly based on objective living conditions concepts, such as per capita income, private consumption or household’s infrastructure46,48.
The sectional design does not allow estab-lishing the cause-effect relationship between the studied variables, since exposure and outcome information were obtained at the same time. The information provided refers to changes in the population over time, not in the individual. The possible underestimating biases are the exclusion of institutionalized individuals and survival. In addition, we should take into account that mul-tinomial regression, with OR measure of effect may overestimate findings.
dif-aúd
e C
ole
tiv
a,
23(3):891-901,
2018
ferent levels of economic development and less favorable sufficiency and type of food consumed conditions reported. Age and income highly contributed to explain associations between the BMI and the sociodemographic variables and variables of sufficiency and the type of food con-sumed.
Finally, strategic public health actions are suggested, with a focus on health promotion and prevention, and aimed at the Brazilian elderly population, with a view to interrupting and/or reversing the trend of the epidemic outbreak of overweight in the country, mainly due to its con-dition as a risk factor for several health problems.
Collaborations
Sil
va V
References
1. Chaimowicz F. A saúde dos idosos brasileiros às véspe-ras do século XXI: problemas, projeções e alternativas.
Rev Saude Publica 1997; 31(2):184-200.
2. Brasil. Ministério da Saúde (MS). Orientações para a coleta e análise de dados antropométricos em serviços de saúde: Norma Técnica do Sistema de Vigilância Alimen-tar e Nutricional - SISVAN. Brasília: MS; 2011. [aces-sado 2015 Jun 05]. Disponível em: http://bvsms.saude. gov.br/bvs/publicacoes/orientacoes_coleta_analise_ dados_antropometricos.pdf
3. Food and Agriculture Organization of the United Na-tions (FAO). International Fund for Agricultural De-velopment. World Food Programme. The state of food insecurity in the world 2014: strengthening the enabling environment to improve food security and nutrition. Rome: FAO; 2014. [acessado 2015 Jun 05]. Disponível em: https://reliefweb.int/sites/reliefweb.int/files/resour-ces /a-i4030e.pdf
4. Guedes DP. Procedimentos clínicos utilizados para análise da composição corporal. Rev Bras Cineantro-pom Desempenho Hum 2013; 15(1):113-129.
5. Perissinotto E, Pisent C, Sergi G, Grigoletto F, Enzi G. Anthropometric measurements in the elderly: Age and gender differences. Br J Nutr 2002; 87(2):177-186. 6. Mathus-Vliegen E. Obesity and the elderly. J Clin
Gas-troenterol 2012; 46(7):533-544.
7. Schienkiewitz A, Mensink GBM, Scheidt-Nave C. Co-morbidity of overweight and obesity in a nationally representative sample of German adults aged 18-79 years. BMC Public Health (Online) 2012; 12:658. 8. Silva VS, Souza I, Petroski EL, Silva DAS. Prevalência e
fatores associados ao excesso de peso em idosos brasi-leiros. Rev Bras Ativ Fis Saude 2011; 16(4):289-294. 9. Brasil. Ministério da Saúde (MS). Vigitel Brasil 2012:
vigilância de fatores de risco e proteção para doenças crônicas por inquérito telefônico. Brasília: MS; 2013. [acessado 2015 Jun 05]. Disponível em: http://bvsms. saude.gov.br/bvs/publicacoes/vigitel_brasil_2012_vi-gilancia_risco.pdf
10. Instituto Brasileiro de Geografia e Estatística (IBGE).
Estudo nacional da despesa familiar; dados preliminares: consumo alimentar; antropometria. Parte 1: Região I; III; Parte 2: Região V. Rio de Janeiro: IBGE; 1977. [acessa-do 2015 Jun 05]. Disponível em: http://189.28.128.100/ dab/docs/portaldab/documentos/endef_consumo_ali-mentar_antropometria_regiao2_regiao4.pdf
11. Instituto Brasileiro de Geografia e Estatística (IBGE).
Pesquisa de orçamentos familiares 2002-2003: análise da disponibilidade domiciliar de alimentos e do estado nu-tricional no Brasil. Rio de Janeiro: IBGE; 2004 [acessado 2015 Maio 31]. Disponível em: http://www.abeso.org. br/uploads/downloads/70/553a2408c2702.pdf 12. Instituto Brasileiro de Geografia e Estatística (IBGE).
Pesquisa de orçamentos familiares 2008-2009: antropo-metria e estado nutricional de crianças, adolescentes e adultos no Brasil. Rio de Janeiro: IBGE; 2010 [acessado 2015 Mai 31]. Disponível em: http://www.abeso.org. br/uploads/downloads/71/553a23f27da68.pdf
13. Instituto Nacional de Alimentação e Nutrição (INAN).
Pesquisa nacional sobre saúde e nutrição: condições nu-tricionais da população brasileira: adultos e idosos. Bra-sília: INAN; 1991 [acessado 2015 Maio 15]. Disponível em: http://189.28.128.100/dab/docs/portaldab/docu-mentos/boletimSisvan/pnsn2.pdf
14. Schmidt MI, Duncan BB, Silva GA, Menezes AM, Mon-teiro CA, Barreto SM, et al. Chronic non-communica-ble diseases in Brazil: burden and current challenges.
Lancet 2011; 377(9781):1949-1961.
15. Duncan BB, Chor D, Aquino EML, Bensenor IM, Mill JG, Schmidt MI, Lotufo PA, Vigo A, Barreto SM. Do-enças crônicas não transmissíveis no Brasil: prioridade para enfrentamento e investigação. Rev Saude Publica
2012; 46(Supl. 1):126-134.
16. Kepple AW, Segall-Corrêa AM. Conceituando e medin-do segurança alimentar e nutricional. Cien Saude Colet
2011; 16(1):187-199.
17. Maia GA. Relative income, inequality and subjec-tive wellbeing: evidence for Brazil. Soc Indic Res 2013; 113(3):1193-1204.
18. Soares SSD. Metodologias para estabelecer a linha de pobreza: objetivas, subjetivas, relativas, multidimen-sionais. Texto para discussão [periódico Internet]. 2009 Fev [acessado 2015 Mai 10]; 1381. [cerca de 102 p.]. Disponível em: https://www.econstor.eu/bitstre-am/10419/91156/1/59826129X.pdf
19. Grosh ME, Glewwe P. The world bank’s living stan-dards measurement study household surveys. J Econ Perspect 1998; 12(1):187-196.
20. Instituto Brasileiro de Geografia e Estatística (IBGE).
Pesquisa sobre padrões de vida 1996-1997. Rio de Janei-ro: IBGE; 1998 [acessado 2015 Jun 10]. Disponível em: https://biblioteca.ibge.gov.br/visualizacao/livros/liv6642. pdf
21. Chander R, Grootaert C, Pyatt G. Living standards surveys in developing countries. Living standards mea-surement study (LSMS) working paper. [serial on the Internet] 1980 Oct [cited 2015 Jun 10]; 1: [about 36 p.]. Available from: http://documents.worldbank.org/ curated/en/223501468765889699/pdf/multi0page.pdf 22. World Health Organization (WHO). Physical status:
the use and interpretation of antropometry. Report of a WHO Expert Commitee. WHO Technical Report Se-ries, 854. Geneve: WHO; 1995 [acessado 2015 Mar 20]. Disponível em: http://whqlibdoc.who.int/trs/WHO_ TRS_854.pdf?ua=1. Acesso em 20 mar. 2015. 23. Field A . Discovering statistics using SPSS statistics. 4th
ed. London: Sage; 2013.
24. Statistical Package for the Social Sciences [computer program]. Version 20. Chicago: IBM SPSS statistics 20 core system user´s guide; 2011.
25. Brasil. Conselho Nacional de Saúde (CNS). Resolução nº 466, de 12 de dezembro de 2012. Diário Oficial da União 2013; 13 jun
aúd
e C
ole
tiv
a,
23(3):891-901,
2018
27. Bezerra IN, Souza AM, Pereira RA, Sichieri R. Consu-mo de alimentos fora do domicílio. Rev Saude Publica
2013; 47(Supl. 1):200-211.
28. Oliveira LDS, Watanabe EAM, Lima-Filho DO, Spro-esser RL. Avaliação de políticas públicas de segurança alimentar em países com diferentes níveis de desenvol-vimento. Agroalim 2010; 16(31):15-29.
29. Coqueiro RS, Barbosa AR, Borgatto AF. Nutritional status, health conditions and socio-demographic fac-tors in the elderly of Havana, Cuba: data from SABE survey. J Nutr Health Aging 2010; 14(10):803-808. 30. Ford DW, Hartman TJ, Still C, Wood C, Mitchell DC,
Erickson P, Bailey R, Smiciklas-Wright H, Coffman DL, Jensen GL. Body mass index, poor diet quality, and health-related quality of life are associated with mor-tality in rural older adults. J Nutr Gerontol Geriatr 2014; 33(1):23-34.
31. Tarqui-Mamani C, Alvarez-Dongo D, Espinoza-Ori-undo P, Gomez-Guizado G. Nutritional status asso-ciated with demographic characteristics in older Pe-ruvian adults. Rev Peru Med Exp Salud Pública 2014; 31(3):467-472.
32. Attanasio OP. Expectations and perceptions in devel-oping countries: their measurement and their use. Am Econ Rev 2009; 99(2):87-92.
33. Pessoa MS, Silveira MAC. Indicadores objetivos e sub-jetivos de qualidade de vida das famílias brasileiras se-gundo a POF de 2002-2003: um estudo sobre seus de-terminantes demográficos, sociais e econômicos. Texto para discussão [periódico Internet]. 2009 Nov [acessado 2015 Maio 05]; 1437. [cerca de 102 p.]. Disponível em: http://www.ipea.gov.br/portal/images/stories/PDFs/ TDs/td_1437.pdf
34. Batista Filho M, Rissin A. A transição nutricional no Brasil: tendências regionais e temporais. Cad Saude Pu-blica 2003; 19(Supl. 1):181-191.
35. Inzitari M, Doets E, Bartali B, Benetou V, Di Bari M, Visser M, Volpato S, Gambassi G, Topinkova E, De Groot L, Salva A; International Association Of Geron-tology And Geriatrics (IAGG) Task Force For Nutrition In The Elderly. Nutrition in the age-related disable-ment process. J Nutr Health Aging 2011; 15(8):599-604. 36. Fisberg RM, Marchioni DML, Castro MA, Verly Junior E, Araújo MC, Bezerra IN, Pereira RA, Sichieri R. In-gestão inadequada de nutrientes na população de ido-sos do Brasil: Inquérito Nacional de Alimentação 2008-2009. Rev Saude Publica 2013; 47(Supl. 1):222-230. 37. Camarano AA, Kanso S, Fernandes D. Saída do
mer-cado de trabalho: qual é a idade? Boletim Mercado de trabalho: conjuntura e análise [periódico Internet]. 2012 Mai [acessado 2015 Mai 05]; 51: [cerca de 10 p.]. Disponível em: http://www.ipea.gov.br/portal/images/ stories/PDFs/mercadodetrabalho/bmt51_nt01_saida-domercado.pdf
38. Edwards MH, Dennison EM, Aihie Sayer A, Fielding R, Cooper C. Osteoporosis and sarcopenia in older age.
Bone 2015; 80:126-130.
39. González D, Nazmi A, Victora CG. Childhood poverty and abdominal obesity in adulthood: a systematic re-view. Cad Saude Publica 2009; 25(Supl. 3):427-440. 40. Wells JC, Marphatia AA, Cole TJ, McCoy D.
Associa-tions of economic and gender inequality with global obesity prevalence: understanding the female excess.
Soc Sci Med 2012; 75(3):482-490.
41. Souza AM, Pereira RA, Yokko EM, Levy RB, Sichieri R. Most consumed foods in Brazil: National Dietary Survey 2008-2009. Rev Saude Publica 2013; 47(Supl. 1):190-199.
42. World Health Organization (WHO). Globalization, food and nutrition transitions. WHO Commission on so-cial determinants of health. Ottawa: WHO; 2007 [aces-sado 2015 Jun 05]. Disponível em: http://www.who.int/ social_determinants/resources/gkn_hawkes.pdf 43. Winter JE, Maclnnis RJ, Wattanapenpaiboon N,
Nowson CA. BMI and all-cause mortality in older adults: a meta-analysis. Am J Clin Nutr 2014; 99(4):875-890.
44. Iser BP, Claro RM, de Moura EC, Malta DC, Morais Neto OL. Risk and protection factors for chronic non communicable diseases by telephone survey – VIGI-TEL-2009. Rev Bras Epidemiol 2011; 14(Supl. 1):90-102.
45. Toneli MJF, Souza MGC, Muller RCF. Masculinidades e práticas de saúde: retratos da experiência de pesquisa em Florianópolis/SC. Physis (Rio J) 2010; 20(3):973-994.
46. Monte PA, Cruz MS. As percepções dos indivíduos das áreas urbana e rural sobre suas condições de vida. Re-vista Econômica do Nordeste 2012; 43(4):51-59. 47. Prado SD, Gugelmin AS, Mattos RA, Silva JK, Olivares
PSG. A pesquisa sobre segurança alimentar e nutricio-nal no Brasil de 2000 a 2005: tendências e desafios. Cien Saude Colet 2010; 15(1):7-18.
48. Hoffmann R. Desigualdade da renda e das despesas per capita no Brasil, em 2002-2003 e 2008-2009, e avaliação do grau de progressividade ou regressividade de par-celas da renda familiar. Econ Soc 2010; 19(3):647-661.
Article submitted 25/11/2015 Approved 24/05/2016
Final version submitted 26/05/2016
This is an Open Access article distributed under the terms of the Creative Commons Attribution License