Digestible Amino Acid Profile: An Exploratory
Analysis
Daniel Emygdio de Faria Filho Unesp / FCAV
Via de acesso Paulo Donato Castellane, km 5 Zona rural
14.884-900. Jaboticabal, SP, Brazil.
Email: [email protected]
Broiler chicken, cluster analysis, ideal protein, ingredients, principal component analysis.
Mail Address
Keywords Author(s)
Arrived: may / 2005 Approved: july / 2005
ABSTRACT
This study aimed: 1) to classify ingredients according to the digestible amino acid (AA) profile; 2) to determine ingredients with AA profile closer to the ideal for broiler chickens; and 3) to compare digestible AA profiles from simulated diets with the ideal protein profile. The digestible AA levels of 30 ingredients were compiled from the literature and presented as percentages of lysine according to the ideal protein concept. Cluster and principal component analyses (exploratory analyses) were used to compose and describe groups of ingredients according to AA profiles. Four ingredient groups were identified by cluster analysis, and the classification of the ingredients within each of these groups was obtained from a principal component analysis, showing 11 classes of ingredients with similar digestible AA profiles. The ingredients with AA profiles closer to the ideal protein were meat and bone meal 45, fish meal 60 and wheat germ meal, all of them constituting Class 1; the ingredients from the other classes gradually diverged from the ideal protein. Soybean meal, which is the main protein source for poultry, showed good AA balance since it was included in Class 3. On the contrary, corn, which is the main energy source in poultry diets, was classified in Class 8. Dietary AA profiles were improved when corn and/ or soybean meal were partially or totally replaced in the simulations by ingredients with better AA balance.
INTRODUCTION
Protein and amino acids (AA) are important determinants of diet
production costs, and also affect animal production (Bregendahl et al.,
2002) and carcass characteristics of broiler chickens (Kerr & Kidd, 1999). The ideal protein concept has emerged from this context, and means the use of essential AA to supply the exact requirements of the animals in terms of maintenance and protein accretion (neither exceeding nor lacking amounts) (Emmert & Baker, 1997). For practical purposes, the concept of ideal protein refers to the establishment of digestible essential AA requirements as percentages of digestible lysine (Baker & Han, 1994;
Baker et al., 2002). However, diets formulated with ingredients
commonly used for birds have an excess of non-limiting essential AA. Thus, the classification of ingredients according to the digestible AA patterns may indicate which ingredients would compose diets with the best AA balance.
For this proposal, exploratory statistical analyses might be useful. The multivariate techniques of cluster and principal component analyses allow the evaluation of sample similarities according to determined variables (Moita Neto & Moita, 1998). For instance, the ingredients (samples) can be studied considering all the essential AA together (variables). The cluster analysis classifies the samples according to some
Faria Filho DE1
Torres KAA1
Campos DMB1
Vieira BS2
Urbano T1
Rosa PS1,3
Ferraudo AS4
1 Graduate Student in Animal Science
Departamento de Morfologia e Fisiologia Animal/FCAV/UNESP
2 Undergraduate Student in Veterinary
Medicine Departamento de Morfologia e Fisiologia Animal/FCAV/UNESP
3 Embrapa Suínos e Aves and Professor of
UnC Concórdia, SC
4 Professor of Departmento de Ciências
variables so that homogeneity within groups and heterogeneity among groups are obtained (Sneath & Sokal, 1973). The principal component analysis linearly transforms the original variables, and thus compose a new set of independent variables (components) (Jackson, 1991). The principal components that retain a significant amount of information about the original data set can be used to identify the important variables that explain sample grouping. Hence, clustering analysis can be complemented by the principal component analysis to explain the group structures.
In this context, this present study aimed:
To classify ingredients according to the digestible AA profile.
To determine ingredients with AA profile close to the ideal for broiler chicken.
To compare the digestible AA profiles of diet simulations with the ideal protein profile.
MATERIAL AND METHODS
Data collection
Data on crude protein (CP), nitrogen-corrected apparent metabolizable energy (ME), and digestible AA (as-fed basis) of 30 ingredients suitable for poultry diets
were obtained from Rostagno et al. (2000) and Lesson
et al. (2000). The levels of digestible methionine +cystine, tryptophan, threonine, arginine, isoleucine, valine, leucine, histidine and phenylalanine of the ingredients were expressed as percentages of digestible lysine (Table 1). In this data matrix, a vector representing the ideal AA profile for broiler chickens at the initial phase (from 1 to 21 days) was inserted, presenting the following composition (percentage in relation to lysine): 72% methionine+cystine, 105% arginine, 109% leucine, 32% histidine and 65% phenylalanine according to Baker & Han (1994); and 16.6% tryptophan, 55.7% threonine, 61.4% isoleucine
and 77.5% valine as suggested by Baker et al.(2002).
Lysine was not added because it is the reference AA (100%).
Cluster Analysis
For cluster analyses, the matrix of the digestible AA of the ingredients listed in Table 1 was used in addition to the vector of the ideal protein profile. The clustering process involves three steps: data standardization; assessment of a dissimilarity measure among samples; and the use of a grouping technique. In the present study, data standardization was not necessary because the AA were expressed in a same unit (% lysine). The
Euclidean distance was used as dissimilarity distance (Sneath & Sokal, 1973). Wards method was used as the grouping technique (Ward, 1963).
Principal Component Analysis
Principal component analyses were used within the groups determined previously. Both matrix data related to the composition of digestible AA (% lysine) of the ingredients within each group and the ideal protein profile vector were used. The principal components were obtained by computing the eigenvalues and eigenvectors of data correlation matrix (Jackson, 1991). A bi-dimensional representation of this m-multidimensional set was made for the principal components that accumulated a significant percentage of original information. The principal components with significant contribution were those with eigenvalues greater than 1 (StatSoft, 2001). The correlation between each AA and the principal component was calculated. This procedure allowed the identification of the role of each AA in the classification. Only correlations with module equal or greater than 0.6 were discussed.
Simulations
Eight starter diets for broiler chickens were formulated based on the results of cluster and principal component analyses. The diets had the following nutritional levels: 3000 kcal/kg ME; 0.96% calcium; 0.45% available phosphorus; 0.22% sodium; 21.5%
crude protein; 1.14% digestible lysine (Rostagno et al.,
2000). The digestible AA levels were at least as
suggested by Baker & Han (1994) and Baker et al.
(2002). For presentation purposes the diets are shown
in the Results after definition and characterization of the ingredient groups. The matrix of dietary digestible AA profile (% lysine) and the vector of the ideal protein profile were used for cluster and principal component analyses, as described above. Because methionine+ cystine levels were similar among diets (72% of lysine), these AA were not used in the analysis.
Statistics
Cluster and principal component analyses were run
in the software Statistica 6.0® (StatSoft, 2001).
RESULTS
Cluster Analysis
dissimilarities. Considering in the dendogram a break point at the linkage distance around 600 (Figure 1), four ingredient groups with similar digestible AA profiles were identified. The AA profile of ingredients in group A was closer to ideal protein. In groups B, C and D, the AA balance of the ingredients gradually decreased.
Principal component analysis
The interpretations of the results obtained by principal component analysis were based on some presuppositions. Firstly, the principal component 1 was always represented on the abscissa, while the components 2 and 3 were on the ordinates. Thus, comparisons to the principal component 1 were made horizontally, whereas comparisons to components 2 and 3 were made only vertically. Another statement concerned the plus or minus signs of the coefficients of correlation, i.e., direct or inverse relationship between variables, respectively (Bussad & Morettin, 1987). Therefore, a positive correlation between an AA and component 1 means that all the ingredients
plotted in the graph areas with positive values on the abscissa (horizontal comparison) would present higher amounts of that AA, while the ingredients in the negative graph areas would have lesser amounts of this AA. Similarly, a negative correlation between the AA and the principal component 1 means that the ingredients situated in the negative areas (horizontal comparison) present larger amounts of this AA, while those in the positive areas have low AA contents. It is important to stress that the principal component 1 always contained the largest set of information about the original values of digestible AA, and thus this component accounts for the most relevant results.
Group A
The principal component analysis within group A showed that the eigenvalues of the three first components were greater than 1 and accounted for 87.7% of the variability of the original values of digestible AA (Table 2). In this group, methionine +cystine was correlated positively with the principal
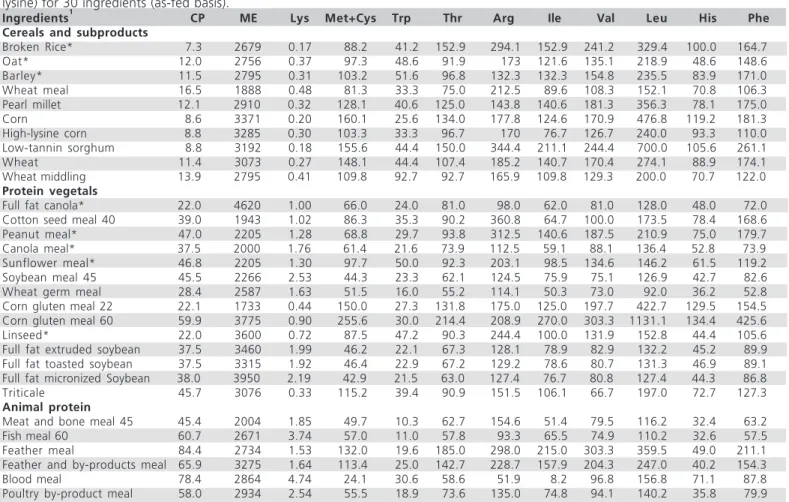
Table 1 Crude protein (CP, %), nitrogen-corrected apparent metabolizable energy (ME; kcal/kg), digestible lysine (%) and AA (as % of
lysine) for 30 ingredients (as-fed basis).
Ingredients1 CP ME Lys Met+Cys Trp Thr Arg Ile Val Leu His Phe
Cereals and subproducts
Broken Rice* 7.3 2679 0.17 88.2 41.2 152.9 294.1 152.9 241.2 329.4 100.0 164.7
Oat* 12.0 2756 0.37 97.3 48.6 91.9 173 121.6 135.1 218.9 48.6 148.6
Barley* 11.5 2795 0.31 103.2 51.6 96.8 132.3 132.3 154.8 235.5 83.9 171.0
Wheat meal 16.5 1888 0.48 81.3 33.3 75.0 212.5 89.6 108.3 152.1 70.8 106.3
Pearl millet 12.1 2910 0.32 128.1 40.6 125.0 143.8 140.6 181.3 356.3 78.1 175.0
Corn 8.6 3371 0.20 160.1 25.6 134.0 177.8 124.6 170.9 476.8 119.2 181.3
High-lysine corn 8.8 3285 0.30 103.3 33.3 96.7 170 76.7 126.7 240.0 93.3 110.0
Low-tannin sorghum 8.8 3192 0.18 155.6 44.4 150.0 344.4 211.1 244.4 700.0 105.6 261.1
Wheat 11.4 3073 0.27 148.1 44.4 107.4 185.2 140.7 170.4 274.1 88.9 174.1
Wheat middling 13.9 2795 0.41 109.8 92.7 92.7 165.9 109.8 129.3 200.0 70.7 122.0
Protein vegetals
Full fat canola* 22.0 4620 1.00 66.0 24.0 81.0 98.0 62.0 81.0 128.0 48.0 72.0
Cotton seed meal 40 39.0 1943 1.02 86.3 35.3 90.2 360.8 64.7 100.0 173.5 78.4 168.6
Peanut meal* 47.0 2205 1.28 68.8 29.7 93.8 312.5 140.6 187.5 210.9 75.0 179.7
Canola meal* 37.5 2000 1.76 61.4 21.6 73.9 112.5 59.1 88.1 136.4 52.8 73.9
Sunflower meal* 46.8 2205 1.30 97.7 50.0 92.3 203.1 98.5 134.6 146.2 61.5 119.2
Soybean meal 45 45.5 2266 2.53 44.3 23.3 62.1 124.5 75.9 75.1 126.9 42.7 82.6
Wheat germ meal 28.4 2587 1.63 51.5 16.0 55.2 114.1 50.3 73.0 92.0 36.2 52.8
Corn gluten meal 22 22.1 1733 0.44 150.0 27.3 131.8 175.0 125.0 197.7 422.7 129.5 154.5
Corn gluten meal 60 59.9 3775 0.90 255.6 30.0 214.4 208.9 270.0 303.3 1131.1 134.4 425.6
Linseed* 22.0 3600 0.72 87.5 47.2 90.3 244.4 100.0 131.9 152.8 44.4 105.6
Full fat extruded soybean 37.5 3460 1.99 46.2 22.1 67.3 128.1 78.9 82.9 132.2 45.2 89.9
Full fat toasted soybean 37.5 3315 1.92 46.4 22.9 67.2 129.2 78.6 80.7 131.3 46.9 89.1
Full fat micronized Soybean 38.0 3950 2.19 42.9 21.5 63.0 127.4 76.7 80.8 127.4 44.3 86.8
Triticale 45.7 3076 0.33 115.2 39.4 90.9 151.5 106.1 66.7 197.0 72.7 127.3
Animal protein
Meat and bone meal 45 45.4 2004 1.85 49.7 10.3 62.7 154.6 51.4 79.5 116.2 32.4 63.2
Fish meal 60 60.7 2671 3.74 57.0 11.0 57.8 93.3 65.5 74.9 110.2 32.6 57.5
Feather meal 84.4 2734 1.53 132.0 19.6 185.0 298.0 215.0 303.3 359.5 49.0 211.1
Feather and by-products meal 65.9 3275 1.64 113.4 25.0 142.7 228.7 157.9 204.3 247.0 40.2 154.3
Blood meal 78.4 2864 4.74 24.1 30.6 58.6 51.9 8.2 96.8 156.8 71.1 87.8
Poultry by-product meal 58.0 2934 2.54 55.5 18.9 73.6 135.0 74.8 94.1 140.2 35.8 79.9
1 - Ingredients marked with an asterisk* were obtained from Lesson et al. (2000); the other ingredients were obtained from Rostagno et al.
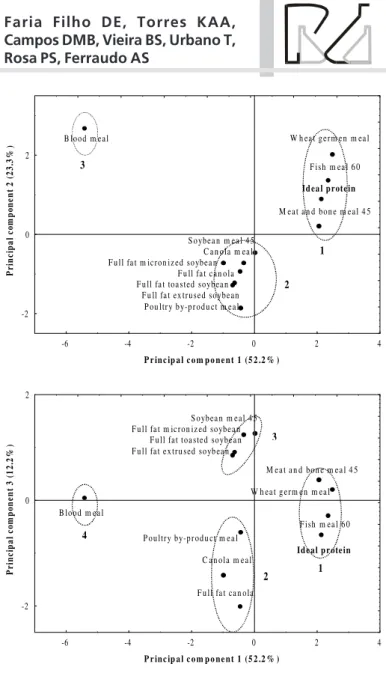
component 1, but tryptophan, valine, leucine, histidine and phenylalanine were correlated negatively with this component (Table 2). Figure 2a shows that the principal component 1 (horizontal comparison) distinguished 3 classes of ingredients (1, 2 and 3). Class 1 contained ingredients with AA profile close to the ideal: meat and bone meal 45, fish meal 60 and wheat germ meal. Class 2 was composed of full fat canola, canola meal, poultry by-product meal and soybean derivatives. Blood meal was categorized into Class 3. The cluster analysis dendogram (Figure 1) shows the tendency toward
formation of sub-groups within Group A. Class 2 and especially class 3 were characterized by containing ingredients with greater quantities of AA that were correlated negatively with the principal component 1. Blood meal presented the lowest concentration of methionine+cystine.
Threonine, arginine and isoleucine were correlated negatively with the principal component 2 (Table 2). Figure 2a shows an excess of these AA in the ingredients from Class 2 as compared with Class 1 (vertical comparison). Blood meal (Class 3) was deficient in these AA compared to both Class 1 and 2.
C o rn g lu te n m ea l 6 0 L o w -ta nn in s o rg
hum Corn
C o rn g lu te n m ea l 2 2 Pe a rl m ill et W heat B roke n r ic e F eat her m ea l Pe an ut m ea l F ea th er a n d b y-p ro d uc ts m ea l C o tt o n s e ed me a l 4 0 L in seed S un flowe r m ea l W hea t m eal T ri tical e H igh-ly si ne c o rn Ba rl ey Oa t Wh e at m id d lin g B loo d m ea l Po ul tr y b y-p ro d u ct m ea l F ul l f at ex tr ud ed s o yb e an F ul l f at t o as te d s o yb e an S o yb ean m ea l 4 5 Fu ll f at m ic ro ni ze d So yb e an F ull f at c a no la Ca no la m ea l M eat an d b o ne m ea l 4 5 Wh ea t ge rm en m ea l Fi sh m e al 6 0 Id e a l Pr o te in 0 5 0 0 1 0 0 0 1 5 0 0 2 0 0 0 2 5 0 0
Li n k a g e D is ta n ce
Figure 1 Groups of ingredients determined by the cluster analysis according to digestible AA profiles.
Table 2 Eigenvalues and variances (%) of the principal components and correlation coefficient between each AA and the principal
components.
Group A Group B Group C Group D Simulations
Principal Component 1 2 3 1 2 1 2 3 1 2 1 2
Eingenvalue 4.7 2.1 1.1 5.1 1.5 4.5 1.9 1.5 7.7 1.3 5.2 1.5
Variance (%) 52.2 23.3 12.2 56.7 16.7 50.0 21.1 16.6 85.0 14.0 65.0 18.8
Correlation coefficient1
Methionine+cystine 0.65 -0.27 -0.64 -0.83 -0.34 -0.66 -0.61 -0.23 -0.94 -0.33 -
-Tryptophan -0.89 -0.10 0.02 -0.67 0.30 -0.21 -0.22 0.79 -0.71 0.71 -0.30 -0.92
Threonine -0.28 -0.75 -0.52 -0.93 0.10 -0.92 0.21 -0.19 -0.98 -0.18 -0.88 0.24
rginine 0.53 -0.65 0.34 -0.13 0.81 -0.23 0.69 0.58 -0.67 0.74 -0.87 -0.07
Isoleucine 0.46 -0.79 0.23 -0.83 0.17 -0.85 0.37 -0.24 -1.00 -0.04 -0.90 -0.25
Valine -0.81 -0.12 -0.25 -0.65 0.52 -0.88 0.37 -0.18 -1.00 -0.02 -0.54 0.60
Leucine -0.92 -0.29 -0.04 -0.86 -0.35 -0.83 -0.48 -0.12 -0.98 -0.19 -0.89 0.31
Histidine -0.94 0.16 -0.06 -0.67 -0.41 -0.45 -0.67 0.43 -1.00 -0.04 -0.84 -0.06
Phenylalanine -0.75 -0.49 0.39 -0.90 -0.03 -0.85 0.19 0.34 -0.97 -0.23 -0.95 -0.21
1 - Only correlations with module = 0.6 were considered.
-6 -4 -2 0 2 4
P r in c ip a l c o m p o n e n t 1 (5 2 .2 % )
-2 0 2
P
ri
n
ci
pa
l
co
m
p
o
n
ent
3
(
1
2
.2
%
)
S oybea n m e a l 4 5 F u ll fa t m ic ron iz ed soybe a n F u ll fa t toa ste d soybe a n F u ll fa t e x tru sed soyb ea n
B lood m ea l
P ou ltry by-p r od u ct m e a l
C a n ola m e a l
F u ll fa t ca n ola
M e a t a n d bon e m e a l 4 5
W h ea t g e rm e n m ea l
F ish m ea l 6 0
Id e al p r ote in 3
4
2 1
-6 -4 -2 0 2 4
P r in c ip a l c o m p o n e n t 1 (5 2 .2 % )
-2 0 2
P
ri
n
ci
pa
l
co
m
p
o
n
ent
2
(
2
3
.3
%
) B lood m e a l
S oybe a n m ea l 4 5 C a n ola m ea l F u ll fa t m ic ron iz ed soybe a n F u ll fa t c a n ola F u ll fa t toa sted soybea n F u ll fa t ex tru se d soybe a n P ou ltr y by-p r od u ct m e a l
W h ea t g e rm e n m ea l
F ish m ea l 6 0
Id ea l p rotein
M e a t a n d bon e m e a l 4 5
2 3
1
Figure 2 Principal components of Group A ingredients
according to digestible AA profiles.
Figure 2b shows the classification obtained from the correlation between the AA and the principal components 1 and 3. Methionine+cystine were negatively correlated with the principal component 3, and the values of these AA in full-fat canola, canola meal and poultry by-product meal were greater than those of soybean derivatives from Class 2 (Figure 2a). Because methionine+cystine are limiting elements in most poultry diets, the ingredients with greater values of these AA composed Class 2 (Figure 2b). Therefore, soybean derivates were included into Class 3 and blood meal into Class 4.
Group B
For Group B, the two first principal components showed eigenvalues greater than 1 and accounted for 73.4% of the variability of the original data on digestible
AA (Table 2). All the essential AA were correlated negatively with the principal component 1. However, a positive correlation was found between arginine and the principal component 2 (Table 2). Figure 3 shows that, considering the principal component 1 (horizontal comparison), wheat meal, linseed and sunflower meal were the closest to the ideal protein profile, which agrees with the cluster analysis for Group B (Figure 1). These ingredients constituted Class 5, and the others composed Class 6 (Figure 3). The principal component 2 (vertical comparison) was also important to differentiate the ingredients in terms of digestible arginine, and those ingredients positioned in the upper graph area presented the greater arginine contents while arginine levels decreased in ingredients located in the lower graph area. Thus, Class 5 had arginine in excess compared to the ideal protein pattern.
Figure 3 Principal components of Group B ingredients
according to digestible AA profiles.
Group C
The three first principal components showed eigenvalues greater than 1 and accounted for 87.7% from the original information on digestible AA values (Table 2). Figure 4a shows three classes (7, 8 and 9) within Group C. Class 7 was composed of cotton seed meal, peanut meal, feather and by-products meal and broken rice. Pearl millet, wheat, corn gluten meal 22 and corn constituted Class 8. Feather meal was isolated in Class 9. This sub-structure was similar to the dendogram obtained from cluster analysis (Figure 1).
-4 -2 0 2 4 6
P r inc ip a l co m p o ne nt 1 (5 6 .7 % )
-2 0 2
Pr
in
ci
p
al
c
om
p
on
en
t 2 (
16.
7%
)
L in seed
S un flow er m eal
W h ea t m eal
Ideal protein
O at
W h eat m id d lin g
B arley
H ig h -lysin e corn
T r iticale
6
Considering the principal component 1 (horizontal comparison), Class 7 ingredients were closest to the ideal protein, while Class 8 and 9 ingredients gradually diverged from that. The AA that most influenced distribution of ingredients in relation to the principal component 1 (methionine+cystine, threonine, isoleucine, valine, leucine and phenylalanine; Table 2) were those correlated negatively with this component. The principal component 2 (vertical comparison) allowed ingredient differentiation in relation to methionine+cystine and histidine (negative correlation) and to arginine (positive correlation). Thus, ingredients located in the lower graph area tended to present higher values of methionine+cystine and histidine and lower levels of arginine. An inverse response was found for ingredients in the upper graph area (Figure 4a).
Principal component 3 differentiated the ingredients mainly as a function of the positive correlation with
tryptophan. Ingredients in the upper graph area tended to show higher levels of this AA (Figure 4b).
Group D
The two first principal components showed eigenvalues higher than 1 and accounted for 99% of the original information on digestible AA content (Table 2). Considering the principal component 1 (horizontal comparison), low-tannin sorghum was closer to the ideal protein and thus presented a better AA profile compared to corn gluten meal 60. However, these two ingredients were far from the ideal protein. Even so, sorghum was classified in Class 10 and corn gluten meal 60 in Class 11. All the AA studied influenced the distribution of the ingredients in relation to the principal component 1 (negative correlation). Principal component 2 was important to distinguish the ingredients in relation to tryptophan and arginine levels, with sorghum showing stronger relation with these AA (upper graph area in Figure 5).
Figure 5 Principal components of Group D ingredients
according to digestible AA profiles.
Simulations
Eight diets were formulated based on the ingredient classification obtained from cluster and principal component analyses. The first was a conventional corn-soybean diet (Corn-Soy). In two diets, corn was replaced by either high-lysine corn (Corn-Lys) or wheat middling, both of them with better AA profiles. Since sorghum was the cereal with the worst AA profile, a diet based on this ingredient was formulated to investigate its impact on diet AA profile. Afterwards,
-4 -2 0 2 4 6
P r in c ip a l c o m p o n e n t 1 ( 5 0 .0 % )
-2 0 2
P
r
in
ci
pa
l
co
m
p
o
n
ent
3
(
1
6
.6
%
)
Id e a l p r ote in
B rok e n R ice W h ea t P ea n u t m e a l
P ea r l m illet
C orn g lu te n m ea l 2 2 C orn
F ea th er a n d by-p r od u cts m e a l
F e a th er m ea l
C otton see d m ea l 4 0
-4 -2 0 2 4 6
P r in c ip a l c o m p o n e n t 1 (5 0 .0 % )
-2 0 2
P
r
in
c
ip
al
c
o
m
p
o
n
e
n
t 2 (
2
1.
1%
)
P e a rl m ille t W h e a t
C orn g lu te n m ea l 2 2 C orn F ea th er m ea l
P ea n u t m e a l F ea th er a n d by-p r od u cts m e a l
B rok en R ice
C otton see d m ea l 4 0
7
8 9
Id e a l P r ot e in
Figure 4 Principal components of Group C ingredients
according to digestible AA profiles.
-2 0 2 4
P r in c ip a l c o m p o n e n t 1 (8 5 .0 % )
-1 .5 0 .0 1 .5
P
ri
n
c
ip
a
l co
m
p
o
n
en
t
2
(
1
4
.0
%
)
L ow -ta n n in sor g h u m
Id e a l p r ote in
C o rn g lu te n m e a l 6 0
1 0
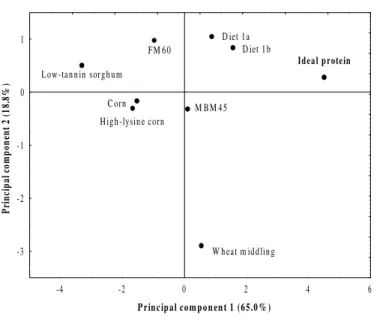
two diets were formulated, one including meat and bone meal 45 (MBM45) and the other with fish meal 60 (FM60). Two other diets containing the ingredients with profiles closer to that of the ideal protein (Class 1) were formulated. These diets contained MBM45, FM60 and either 20% or 30% wheat germ meal (Diets 1a and 1b, respectively). All diets are shown in Table 4. Principal component analysis was applied to the matrix of the values of digestible AA (% lysine) in these diets and the vector of ideal AA profile.
The results showed that the eigenvalues of the two first principal components were greater than 1 and accounted for 83.8% of the original information on digestible AA content (Table 2). Threonine, arginine, isoleucine, leucine, histidine and phenylalanine were the AA that determined diet distribution in relation to the principal component 1 (negative correlation). The principal component 2 allowed the differentiation of the diets in relation to tryptophan (negative correlation) and valine (positive correlation). Thus, diets in the upper graph area have greater valine levels, whereas those in the lower area show greater tryptophan contents. Considering the principal component 1, the AA profiles of Diets 1a, 1b, MBM45 and wheat middling were closer to the ideal protein.
DISCUSSION
The structure obtained from cluster (Groups) and principal component (Classes) analyses allowed the determination of 11 classes of ingredients with similar digestible AA profiles (Table 3). Class 1 ingredients presented AA profiles closer to the ideal, and balance quality decreased gradually in the other classes.
According to the classification presented, soybean meal, which is the main protein source for poultry, has a good AA balance since it was included in Class 3. However, its partial replacement by Class 1 ingredients (MBM45, FM60 and wheat germ meal) improved the diet profile of AA, as evidenced from the simulations. Class 2 ingredients (Table 3) differed from Class 3 ingredients especially because they presented a greater digestible methionine + cystine profile. This is a desired characteristic, since these limiting AA are usually added in synthetic form to poultry diets and increase production cost.
Corn, the main energy source in poultry diets, was included in Class 8, i.e., one of the ingredients with the worst AA balance. Although energetic ingredients have low protein and AA levels, they are added to the diets in high amounts (about 60%), and thus may bring
AA imbalance. The cereals with better AA balance than corn were broken rice (Class 7), high-lysine corn, wheat middling, oat and barley (Class 6). However, the replacement of corn by high-lysine corn did not improve the diet profile of AA (Figure 6) because the only difference in AA between these ingredients was related to lysine. Thus, supplementation of corn diet with synthetic lysine (Table 4) abolished these differences. The addition of wheat middling in the diet improved AA balance in relation to corn, except for tryptophan which was in excess.
Table 3 Groups of ingredients determined by cluster analyses
and classes identified by principal component analysis.
Groups Classes1 Ingredients
A 1 Meat and bone meal45
Fish meal 60 Wheat germ meal
2 Canola meal
Full fat canola
Poultry by-product meal
3 Full fat extruded soybean
Full fat micronized soybean Full fat toasted soybean Soybean meal 45
4 Blood meal
B 5 Linseed
Sunflower meal Wheat meal
6 Barley
High-lysine corn Oat
Triticale Wheat middling
C 7 Broken rice
Cotton seed meal 40 Feather and by-products meal Peanut meal
8 Corn
Corn gluten meal 22 Pearl millet
Wheat
9 Feather meal
D 10 Low-tannin sorghum
11 Corn gluten meal 60
1 - The AA profile of Class 1 ingredients were the closest to the ideal protein profile, and the AA profiles were gradually poorer in the following classes.
CONCLUSION
Table 4 Simulations of starter diets for broiler chickens.
Ingredients (%) Diets
Corn-soy Corn-Lys Wheat middling Sorghum FP60 FCO45 Diet 1a Diet 1b
Corn 56.77 - - - 64.49 61.26 54.56 47.64
High-lysine corn - 56.17 - - -
-Wheat middling - - 58.31 - - - -
-Low-tannin sorghum - - - 54.77 - - -
-Soybean meal 45 36.31 36.09 29.44 36.41 24.19 29.65 13.34 11.04
Wheat germ meal - - - 20.00 30.00
Fish meal 60 - - - - 8.00 - 6.20 3.74
Meat and bone meal 45 - - - 5.83 2.90 3.57
Soybean oil 3.00 3.84 8.00 4.85 0.73 1.66 1.33 2.24
Dicalcium phosphate 1.81 1.85 1.69 1.79 0.86 - -
-Calcitic limestone 0.99 0.96 1.01 0.99 0.76 0.50 0.73 0.83
Salt 0.45 0.48 0.47 0.46 0.36 0.35 0.36 0.38
DL-methionine 98 0.23 0.25 0.23 0.26 0.17 0.24 0.17 0.18
L-lysine 78 0.14 0.07 0.55 0.15 0.13 0.20 0.10 0.09
Supplement (3kg/ton) 0.30 0.30 0.30 0.30 0.30 0.30 0.30 0.30
TOTAL 100.0 100.0 100.0 100.0 100.0 100.0 100.0 100.0
Digestible AA (% of digestible lysine)1
Lysine 100.0 100.0 100.0 100.0 100.0 100.0 100.0 100.0
Methionine+cystine 72.0 72.0 72.0 72.0 72.0 72.0 72.0 72.0
Tryptophan 21.4 23.6 34.8 22.7 18.3 19.1 16.7 16.7
Threonine 63.6 64.0 59.6 63.1 64.0 61.5 62.0 61.0
Arginine 118.3 124.8 115.3 130.4 111.7 116.0 113.0 114.9
Isoleucine 73.7 72.1 72.1 79.6 72.2 68.4 64.7 61.8
Valine 77.8 78.9 75.8 81.8 79.6 75.6 78.7 78.0
Leucine 150.4 137.1 124.1 163.1 151.8 146.5 138.1 131.3
Histidine 46.4 48.0 42.5 43.6 45.2 44.2 42.7 42.0
Phenylalanine 84.9 82.4 79.0 89.3 80.3 80.1 71.8 69.0
1 - The AA profile was used for principal component analysis, except for lysine and methionine + cystine, which were equal among diets.
-4 -2 0 2 4 6
P rin c ip a l co m p o n en t 1 (6 5 .0 % )
-3 -2 -1 0 1
P
ri
n
ci
p
al
c
o
m
p
on
en
t 2 (
1
8.
8%
)
W h ea t m id d lin g
Idea l p rotein
D iet 1a D iet 1 b
M BM 4 5 C orn
H ig h -lysin e corn FM 6 0
L ow -ta n n in sor g h u m
Figure 6 Principal components of the diets (simulations)
according to digestible AA profiles.
REFERENCES
Baker DH, Batal AB, Parr TM, Augspurger, NR, Parsons CM. Ideal ratio (relative to lysine) of tryptophan, threonine, isoleucine and valine for chicks during the second and third weeks posthatch. Poultry Science 2002; 81:485-494.
Baker DH, Han Y. Ideal amino acid profile for chicks during the first three weeks posthatching. Poultry Science 1994; 73:1441-1447.
Bregendahl K, Sell JL, Zimmerman DR. Effect of low-protein diets on growth performance and body composition of broiler chicks. Poultry Science 2002; 81:1156-1167.
Bussad WO, Morretin PA. Estatística básica. 4. ed. São Paulo: Atual; 1987.
Emmert JL, Baker DH. Use of the ideal protein concept for precision formulation of amino acid levels in broilers diets. Journal Applied Poultry Research 1997; 6:462-470.
Jackson JE. A users to principal components. New York: John Wiley & Sons; 1991.
Kerr BJ, Kidd MT. Amino acid supplementation of low-protein broiler diets: 2. Formulation on an ideal amino acid basis. Journal of Applied Poultry Research 1999; 8:310-320.
Moita Neto JM, Moita GC. Introdução à análise exploratória de dados multivariados. Química Nova 1998; 21:467-469.
Rostagno HS, Albino LFT, Donzele JL, Gomes PC, Ferreira AS, Oliveira RF, Lopes DC. Tabelas brasileiras para aves e suínos: composição de alimentos e exigências nutricionais. Viçosa: UFV; 2000.
StatSoft. STATISTICA (data analysis software system), version 6; 2001. Available from: URL: www.statsoft.com.
Sneath PHA, Sokal RR. Numerical taxonomy. San Francisco: Freeman; 1973.