http://dx.doi.org/10.1590/1516-635x1703381-386
Conditions
Author(s)
Mushtaq MMHI
Ahmad GII
Parvin RI
I Poultry Feed and Nutrition Lab, Poultry
Science Division, National Institute of Animal Science, RDA, Seonghwan, Cheonan 301-800, Republic of Korea
II Sadiq Feeds (Private) Limited, Rawalpindi
46300, Pakistan
Mail Address
Corresponding author e-mail address M. M. H. Mushtaq
Poultry Feed and Nutrition Lab, Poultry Science Division National Institute of Animal Science, RDA, Seonghwan, Cheonan 301-800 Republic of Korea Phone: +82 41 580 6728
Fax: +82 41 5806719 E-mail: [email protected]
Keywords
Broiler; digestible lysine; energy to protein ratio; growth performance; subtropical summer conditions.
Submitted: September/2014 Approved: March/2015
ABSTRACT
The digestible lysine requirement for the growth performance of broilers fed diets with decreasing energy to protein ratio and reared under subtropical summer conditions were determined. Treatments consisted of five wheat-based diets with five levels (0.90, 0.95, 1.00, 1.05 and 1.10%) of digestible lysine (DL) and lowering energy to protein ratio (EPR; 13.6, 12.8, 12.0, 11.4 and 11.0), with five replicates of 80 birds each (n = 2000). Body weight gain (BWG) significantly increased by increasing DL levels during wk 1 (p<0.001), while 1.05% DL promoted the highest BWG during the whole experimental period (p<0.01). Increasing DL level resulted in significant reduction in feed intake (FI) and BWG to DL intake ratio (BWG:DLI) during wk 1-3 (p<0.05). Feed:gain ratio (FGR) significantly (p<0.01) improved with DL levels up to 1.05% during the whole experimental period, except for wk 5. The increasing ambient temperature had a linear effect on the all growth parameters. It is inferred that best growth performance can be obtained at 1.05% DL, maintaining all other AA constant under subtropical summer conditions.
INTRODUCTION
Several studies have been carried out to establish total amino acid (AA) requirements of modern fast-growing broiler chickens. Amino acids in nearly all feed ingredients are not completely digested, and knowledge on the efficiency of AA utilization is imperative for the formulation of broiler diets (Leeson & Summers, 2001). This knowledge can also be used to reduce absorption efficiency differences among feedstuff sources (Emmert & Baker, 1997). Feed formulation based on digestible AA provides a more satisfactory basis for formulating poultry diets than on the total AA basis, as it has been shown to increase body weight gain (BWG) and feed intake (FI) and improve body composition in broilers (Fernandez et al., 1995; Rostagno et al., 1995).
Lysine is the reference AA to determine ideal AA ratios for chickens (Baker & Han, 1994). Holsheimer & Ruesink (1993) reported that feeding levels higher than 1.15% dietary lysine in the starter period (from zero to 14 d) resulted in higher breast muscle yield at 49 d of age, irrespective of dietary lysine level fed (1.10 to 1.30%) from 15 to 49 d of age. Sklan & Noy (2003) estimated digestible lysine (DL) requirements of 0.92 and 0.96% for BWG and feed efficiency, respectively, for 7-d-old broilers. However, Mushtaq et al. (2007) suggested that DL can be lowered to 0.8% when the other AA were in definite ratio to DL, according to the ideal AA ratio, in canola meal based diets.
inhibitors), environmental aspects (e.g., disease, crowding, feeder space, and heat or cold stress), genetic aspects (e.g., sex and capacity for lean vs. fat growth), and age (Baker, 1997; Batal & Parsons, 2002; Ishibashi & Ohta, 1999; Kidd et al., 2005; Rose et al., 2001, 2001a; Shelton et al., 2003; Skland & Noy, 2004). Therefore, AA requirements cannot be applied to all birds under all dietary, environmental, and body composition conditions (Baker & Han, 1994). Therefore, the objective of the present study was to evaluate the effects of wheat-based diets with graded levels of DL supplementation and lowering energy to protein ratio on the growth performance of one- to 35-old broilers reared under subtropical summer conditions.
MATERIALS AND METHODS
Husbandry and housing
A total of 2000 straight-run day-old Hubbard chicks (Hubbard × Hubbard) was allocated to five dietary treatments, with five replicates of 80 birds each. Birds were housed in an open sided house in floor pens with floor space of 0.08 m2 per bird. Each
pen was equipped with two separate tube feeders and two manual small-size drinkers. On d 14, tube feeders and small-sized
manual drinkers were replaced with pan feeders and large-sized drinkers, respectively. Birds were vaccinated against infectious bronchitis (IB) and Newcastle disease (ND) on d 1, against infectious bursal disease (IBD) on d 8, and against hydropericardium syndrome on d 19. Birds were re-vaccinated for ND on d 15 and IBD on d 29. A lighting period of 24 hours of light was provided throughout the experiment. Maximum ambient temperature at midday was recorded and considered as the maximum temperature and at midnight as the minimum temperature during summer season. The experiment was terminated on day 35. All the experimental procedures were in compliance with Industrial Research Committee, Lahore, Pakistan.
Diet plan and data collection
Five levels (0.90, 0.95, 1.00, 1.05, and 1.10%) of DL were supplemented to five wheat-based diets containing decreasing energy to protein ratio (E:P) (Table 1). The ratio among different limiting AA (methionine,
threonine, and tryptophan) was maintained constant in the five dietary treatments, using DL as reference AA (Table 2). Total and digestible AA were calculated from analyzed dry matter (DM) and crude protein (CP) contents of each ingredient using AminoDat 3.0™ Platinum version (Degussa AG, Hanau-Wolfgang, Germany). Feed ingredients were analyzed for DM, CP, ether extract, and crude fiber, as suggested by AOAC (2007). The metabolizable energy (ME) value of each ingredient was calculated by the regression equation published by the National Research Council (NRC, 1994). Diets were formulated by a linear formulation method using Mill Mix as feed formulation software.
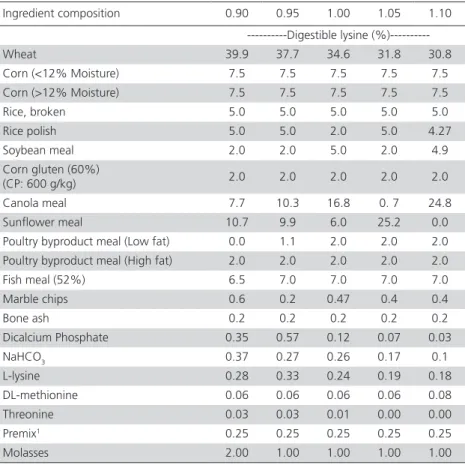
Weekly body weight gain (BWG), feed intake (FI), feed:gain ratio (FGR), and daily mortality were recorded. The BWG:DL intake ratio was calculated by multiplying DL percentage by feed intake and this value was used as a dividend of BWG to calculate this ratio. Birds that died during the experiment were weighed and their weight was used to correct FI and FGR (Table 6). Table 1 – Ingredient composition of the experimental diets (%)
Ingredient composition 0.90 0.95 1.00 1.05 1.10
---Digestible lysine
(%)---Wheat 39.9 37.7 34.6 31.8 30.8
Corn (<12% Moisture) 7.5 7.5 7.5 7.5 7.5
Corn (>12% Moisture) 7.5 7.5 7.5 7.5 7.5
Rice, broken 5.0 5.0 5.0 5.0 5.0
Rice polish 5.0 5.0 2.0 5.0 4.27
Soybean meal 2.0 2.0 5.0 2.0 4.9
Corn gluten (60%)
(CP: 600 g/kg) 2.0 2.0 2.0 2.0 2.0
Canola meal 7.7 10.3 16.8 0. 7 24.8
Sunflower meal 10.7 9.9 6.0 25.2 0.0
Poultry byproduct meal (Low fat) 0.0 1.1 2.0 2.0 2.0
Poultry byproduct meal (High fat) 2.0 2.0 2.0 2.0 2.0
Fish meal (52%) 6.5 7.0 7.0 7.0 7.0
Marble chips 0.6 0.2 0.47 0.4 0.4
Bone ash 0.2 0.2 0.2 0.2 0.2
Dicalcium Phosphate 0.35 0.57 0.12 0.07 0.03
NaHCO3 0.37 0.27 0.26 0.17 0.1
L-lysine 0.28 0.33 0.24 0.19 0.18
DL-methionine 0.06 0.06 0.06 0.06 0.08
Threonine 0.03 0.03 0.01 0.00 0.00
Premix1 0.25 0.25 0.25 0.25 0.25
Molasses 2.00 1.00 1.00 1.00 1.00
1Supplied per kilogram of finished diet: vitamin A (as vitamin A acetate), 15,000 IU; vitamin D 3 (as
chole-calciferol), 3000 IU; vitamin E (as DL-a-tocopheryle acetate), 54 IU; vitamin K3 (as menadione nicotinamide
bisulphite), 3 mg; thiamine (as thiamine mononitrate), 2.94 mg; riboflavin, 8 mg; B6 (as pyridoxine hydro-chloride), 3.92 mg; B12, 20 µg; folic acid, 1.52 mg; calcium-D-pantothenate, 15 mg; niacin (as nicotinic acid), 60 mg; biotin, 200 µg; choline chloride 60%, 600 mg; Se, 0.2 mg; Zn (as ZnSO4.H2O), 110 mg; Cu
Experimental design and data analyses
A completely randomized experimental design was applied, in which pen mean was an experimental unit. The effects of the five graded levels of DL (from 0.90 to 1.10%) were statistically analyzed by the GLM procedure of ANOVA, using Minitab 13.2 (Minitab Inc., State College, PA). The level of significance was 0.05 unless or otherwise stated.
RESULTS
The analyzed nutrients, particularly amino acids, were in close agreement with the calculated values (AOAC, 2005). Range of maximum ambient temperature was between 94 to 99 oF (34.5 to 37.2
oC).
Body weight gain (BWG) results are shown in Table 3. During wk 1, a significant linear increase in BWG was observed as dietary DL level increased (p<0.001). Considering the period of wk 1 to 4, 1.05% DL promoted the highest BWG, which was reduced when 1.10% was fed (p<0.05). During the last week (wk 5), BWG was not affected by DL level (p>0.05). The highest BWG was observed with 1.05% DL level when wk 1 to 3 data were pooled (p<0.001). However, during wk 4 to 5, DL levels did not affect BWG (p>0.05). Considering the entire experimental period (wk 1 to 5), the highest BWG was obtained when the diet contained 1.05% DL (p<0.001).
The FI data obtained during each week are shown in Table 4. Feed intake decreased with increasing DL levels during first 3 wks of age, with the most significant response obtained in wk 1 (p<0.001), followed by wk 2 (p<0.05) and wk 3 (p<0.10). Feed intake was not influenced by dietary DL levels in wk 4 and 5 or when the data was pooled for the whole experimental period (wk 1-5; p>0.05).
A FGR significant improvement (p<0.01) was observed between wk 1-5 (Table 5). A highly significant reduction in FGR was observed with increasing DL levels (p<0.001) in wk 1. After that, 1.05% DL promoted the best FGR from wk 2 to 4 (p<0.001), whereas during last week, DL did not affect FGR (p>0.05). Highly significant FGR responses to DL supplementation was observed when data were pooled for wk 1-3 (p<0.001), wk 4-5 (p<0.02) and wk 1-5 (p<0.02).
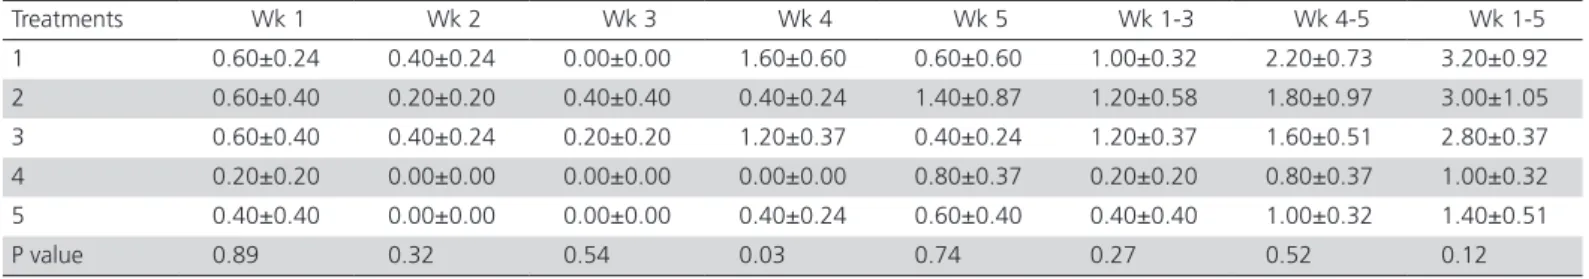
Mortality was not different (p>0.05; Table 6) among dietary treatments during the whole experimental period (wk 1-5), except for wk 4 (p<0.05), during which the broilers fed 1.05% DL presented the least mortality.
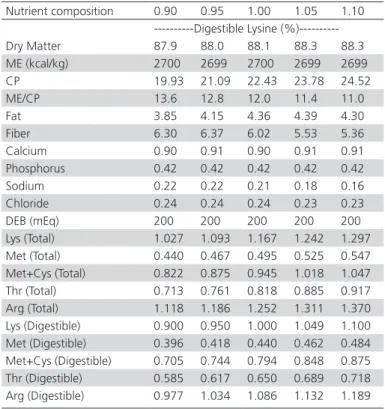
The BWG:DLI ratio was influenced by increasing DL levels during the first 3 wks (p<0.05), no significant response was observed thereafter (p>0.05; Table 7). Table 2 – Nutrient composition of the experimental diets
(%, or otherwise stated)
Nutrient composition 0.90 0.95 1.00 1.05 1.10
---Digestible Lysine (%)---Dry Matter 87.9 88.0 88.1 88.3 88.3
ME (kcal/kg) 2700 2699 2700 2699 2699
CP 19.93 21.09 22.43 23.78 24.52
ME/CP 13.6 12.8 12.0 11.4 11.0
Fat 3.85 4.15 4.36 4.39 4.30
Fiber 6.30 6.37 6.02 5.53 5.36
Calcium 0.90 0.91 0.90 0.91 0.91
Phosphorus 0.42 0.42 0.42 0.42 0.42
Sodium 0.22 0.22 0.21 0.18 0.16
Chloride 0.24 0.24 0.24 0.23 0.23
DEB (mEq) 200 200 200 200 200
Lys (Total) 1.027 1.093 1.167 1.242 1.297
Met (Total) 0.440 0.467 0.495 0.525 0.547
Met+Cys (Total) 0.822 0.875 0.945 1.018 1.047
Thr (Total) 0.713 0.761 0.818 0.885 0.917
Arg (Total) 1.118 1.186 1.252 1.311 1.370
Lys (Digestible) 0.900 0.950 1.000 1.049 1.100 Met (Digestible) 0.396 0.418 0.440 0.462 0.484
Met+Cys (Digestible) 0.705 0.744 0.794 0.848 0.875
Thr (Digestible) 0.585 0.617 0.650 0.689 0.718 Arg (Digestible) 0.977 1.034 1.086 1.132 1.189
Table 3 – Effect of digestible lysine on the body weight gain of broiler chickens reared under subtropical summer conditions from d 1-35 (Mean±SEM)
Treatments Wk 1 Wk 2 Wk 3 Wk 4 Wk 5 Wk 1-3 Wk 4-5 Wk 1-5
————————— g —————————
1 98±1.1 178±2.7 189±7.2 174±14.4 310±14.4 466±5.4 483±12.7 949±15.9
2 97±2.4 178±4.0 189±3.0 168±10.8 316±32.7 464±4.3 484±37.8 948±38.7
3 107±1.4 189±3.0 190±3.3 190±4.2 326±2.2 486±3.4 515±5.5 1002±8.7
4 114±0.5 195±2.0 200±2.2 225±5.3 322±10.9 508±3.8 547±14.4 1055±12.8
5 117±2.0 185±3.1 200±1.9 205±10.3 274±17.3 502±4.9 479±16.8 981±19.8
P value <0.001 <0.001 0.13 <0.001 0.31 <0.001 0.13 0.01
DISCUSSION
The overall weekly body weight was much lower than that expected owing to severe heat stress birds suffered during the experiment. Amino acid requirements were expected to be higher during the first week and then to progressively decline as birds aged, partly owing to the development of the digestive tract, as observed in the present study, with consequent improvement of growth performance during wk 1. Labadan et al. (2001) and Sklan & Noy (2003) reported DL dietary requirements of 1.14% and 0.92% for BWG from day 0 to 14 and day 0 to 7, respectively, in corn-soy based diets. The difference from the present results might be due to the decreasing EPR along with the hot summer conditions in the present study.
The best BWG response was obtained at 1.05% DL, which was in accordance with the results of Baker & Han (1994), who suggested a DL requirement of 1.07% for 21-d-old broilers. Sklan & Noy (2003) also observed a plateau in BWG at 1.10% DL dietary level. The results of the present study showed that excessive lysine is not properly digested. When dietary lysine was low, BWG increased with increasing dietary lysine levels and then decreased after dietary lysine exceeded the birds’ requirement at all CP levels (Ishibashi & Ohta, 1999).
Feed intake increases with as birds age, and the higher FI may compensate amino acid deficiencies by increasing the ingestion of under-provided amino acids. However, a linear decreasing pattern was observed in FI, with the lowest intake and BWG obtained when the diet contained 1.10% DL during first 3 weeks. This response numerically changed after wk 4. This same trend is seen in BWG and DL intake (BWG: DLI) ratio, with a significant increase up to first three weeks. These observed changes are related to the varying levels of DL and not to the high temperatures observed during the experiment per se. The lowest feed intake was obtained with the highest level of DL (1.10%), which resulted in low BWG, and ultimately poor FGR (1.92 when compared with 1.79 with the 1.05% DL diet from d 1 to 35).
The reduced intake observed with the 1.10% DL diet seems to be a result of the interaction between DL and arginine. Leeson & Summers (2001) anticipated that the level of the enzyme arginase may increase when chicks are fed excessive dietary lysine, arginine, or other AA. Therefore, small excesses of lysine in a diet can cause arginine breakdown and ultimately growth depression. The lowest mortality was also observed in broilers fed the 1.05% DL diet when compared with other DL levels; therefore, livability also improved with this DL (1.05%) level, where all other parameters showed better performance.
Table 4 – Effect of digestible lysine on the feed intake of broiler chickens reared under subtropical summer conditions between d 1-35 (Mean±SEM)
Treatments Wk 1 Wk 2 Wk 3 Wk 4 Wk 5 Wk 1-3 Wk 4-5 Wk 1-5
————————— g —————————
1 137±0.2 314±9.5 312±10.3 452±5.0 713±9.6 764±19.8 1165±12.7 1929±23.7
2 136±0.4 297±2.7 299±3.6 453±5.1 728±9.1 731±6.6 1181±12.6 1912±18.8
3 135±0.5 307±1.3 308±1.5 450±3.6 713±4.6 750±2.4 1162±8.0 1912±10.3
4 135±0.2 299±1.4 299.4±1.4 445±1.0 709±2.8 733±3.0 1154±3.0 1887±4.2
5 134±0.4 291±5.3 291±5.3 448±2.06 713±4.6 717±11.1 1161±6.1 1878±7.8
P value <0.001 0.04 0.08 0.61 0.34 0.05 0.36 0.14
1Means of five replicates with 80 birds each (400 birds per treatment, n = 2000)
Table 5 – Effect of digestible lysine on the feed: gain ratio of broiler chickens reared under subtropical summer conditions between d 1-35 (Mean±SEM)
Treatments Wk 1 Wk 2 Wk 3 Wk 4 Wk 5 Wk 1-3 Wk 4-5 Wk 1-5
————————— g : g —————————
1 1.39±0.01 1.77±0.08 1.66±0.02 2.67±0.21 2.33±0.13 1.64±0.02 2.42±0.06 2.03±0.03
2 1.40±0.04 1.67±0.03 1.58±0.02 2.74±0.18 2.45±0.36 1.57±0.01 2.52±0.24 2.03±0.09
3 1.27±0.01 1.62±0.03 1.62±0.02 2.37±0.06 2.19±0.02 1.54±0.01 2.26±0.02 1.91±0.01
4 1.18±0.01 1.54±0.01 1.50±0.02 1.98±0.05 2.21±0.07 1.44±0.01 2.12±0.06 1.79±0.02
5 1.14±0.02 1.58±0.04 1.45±0.04 2.21±0.11 2.64±0.16 1.43±0.03 2.44±0.08 1.92±0.04
P value <0.001 0.01 <0.001 <0.001 0.44 <0.001 0.02 0.01
Labadan et al. (2001) and Sklan & Noy (2003) reported dietary DL requirements of 1.07% and 0.96% for FGR from days 0 to 14 and from days 0 to 7, respectively, in corn-soy based diets. Mushtaq et al. (2007) recommended 0.80% DL, according to the ideal AA ratio, in corn-canola meal based diets. The difference between these results and those obtained in the present study are probably due to the fact that the ideal AA ratio was not obtained in the present study. Leeson & Summers (2001) proposed that the excess of AA beyond the metabolic needs for protein synthesis are broken down and the resulting nitrogen is incorporated into uric acid. It is also speculated that high dietary AA levels induce the production of enzymes responsible for the degradation of these AA.
It can be concluded from the results of the present study that the growth performance of broilers may be improved by increasing digestible lysine levels, allowing reducing the dietary energy: protein ratio under subtropical summer conditions. The best results were obtained with the level of 1.05% DL. However, the final growth was in fact retarded by severe heat stress. Nonetheless, the results showed that digestible lysine requirements are reduced as broilers age when wheat-based diets are fed. The high cost of supplementing lysine and nitrogen excretion could be considered as additional factors in practical formulations.
REFERENCES
Association of Official Analytical Chemists. Official methods of analysis. 18th
ed. Washington: Association of Official Analytical Chemists; 2005.
Baker DH. Ideal amino acid profiles for swine and poultry and their applications in feed formulation. BioKyowa Technology Reviews 1997;9:1–24.
Baker DH, Han Y. Ideal amino acid profile for chickens during the first three weeks of growth. Poultry Science 1994;73:1441-1447.
Batal AB, Parsons, CM. Effects of age on nutrient digestibility in chicks fed different diets. Poultry Science 2002;81:400-407.
Emmert JL, Baker DH. Use of the ideal protein concept for precision formulation of amino acid levels in broiler diets. Journal of Applied Poultry Research 1997;6:462–470.
Fernandez SR, Zhang Y, Parsons CM. Dietary formulation with cottonseed meal on a total amino acid versus a digestible amino acid basis. Poultry Science 1995;74:1168–1179.
Garcia A, Batal AB. Changes in the digestible lysine and sulfur amino acid needs of broiler chicks during the first three weeks posthatching. Poultry Science 2005;84:1350–1355.
Holsheimer JP, Ruesink EW. Effect on performance, carcass composition, yield, and financial return of dietary energy and lysine levels in starter and finisher diets fed to broilers. Poultry Science 1993;72:806–815.
Ishibashi T, Ohta Y. Recent advances in amino acid nutrition for efficient poultry production. Asian-Austral. Journal of Animal Science 1999;12:1298–1309.
Kidd MT, Corzo A, Hoehler D, Miller ER, Dozier III WA. Broiler responsiveness (Ross x 708) to diets varying in amino acid density. Poultry Science 2005;84:1389-1396.
Table 6 – Effect of digestible lysine on the mortality (%) of broiler chickens reared under subtropical summer conditions between d 1-35 (Mean±SEM)
Treatments Wk 1 Wk 2 Wk 3 Wk 4 Wk 5 Wk 1-3 Wk 4-5 Wk 1-5
1 0.60±0.24 0.40±0.24 0.00±0.00 1.60±0.60 0.60±0.60 1.00±0.32 2.20±0.73 3.20±0.92
2 0.60±0.40 0.20±0.20 0.40±0.40 0.40±0.24 1.40±0.87 1.20±0.58 1.80±0.97 3.00±1.05
3 0.60±0.40 0.40±0.24 0.20±0.20 1.20±0.37 0.40±0.24 1.20±0.37 1.60±0.51 2.80±0.37
4 0.20±0.20 0.00±0.00 0.00±0.00 0.00±0.00 0.80±0.37 0.20±0.20 0.80±0.37 1.00±0.32
5 0.40±0.40 0.00±0.00 0.00±0.00 0.40±0.24 0.60±0.40 0.40±0.40 1.00±0.32 1.40±0.51
P value 0.89 0.32 0.54 0.03 0.74 0.27 0.52 0.12
1Means of five replicates with 80 birds each (400 birds per treatment, n = 2000)
Table 7 – Effect of digestible lysine on the body weight gain to digestible lysine intake ratio of broiler chickens reared under subtropical summer conditions between d 1-35
Treatments Wk 1 Wk 2 Wk 3 Wk 4 Wk 5 Wk 1-3 Wk 4-5 Wk 1-5
————————— g:g —————————
0.90 0.80 0.64 0.67 0.43 0.48 0.68 0.46 0.55
0.95 0.79 0.66 0.70 0.41 0.48 0.70 0.46 0.55
1.00 0.87 0.69 0.69 0.47 0.50 0.72 0.49 0.58
1.05 0.93 0.72 0.74 0.56 0.50 0.77 0.53 0.62
1.10 0.95 0.70 0.76 0.51 0.43 0.77 0.46 0.58
P value 0.01 0.04 0.02 0.10 0.46 0.007 0.55 0.18
Labadan MC, Hsu KN Jr, Austic RE. Lysine and arginine requirements of broiler chickens at two- to three-week intervals to eight weeks of age. Poultry Science 2001;80:599–606.
Leeson S, Summers JD. Scott´s nutrition of the chicken. 4th ed. Guelph;
2001.
Mushtaq T, Sarwar M, Ahmad G, Mahr-un-Nisa, Mirza MA, Mushtaq MMH. Influence of canola meal based diets supplemented with exogenous enzyme and digestible lysine on performance, digestibility, carcass and immunity responses of broiler chickens. Poultry Science 2007;86:2144- 2151.
National Research Council. Nutrient requirements of poultry. 9th ed.
Washington: National Academy Press;1994.
Rosa AP, Pesti GM, Edwards HM Jr, Bakalli RI. Tryptophan requirements of different broiler genotypes. Poultry Science 2001;80:1718-1722.
Rosa AP, Pesti GM, Edwards HM Jr, Bakalli RI. Threonine requirement of different broiler genotypes. Poultry Science 2001a;80:1710–1717.
Rostagno HS, Pupa JMR, Pack M. Diet formulation for broilers based on total versus digestible amino acids. Journal of Applied Poultry Research 1995;4:293–299.
Shelton JL, Mavromichalis I, Payne RL, Southern LL, Baker DH. Growth performance of different breed crosses of chicks fed diets with different protein and energy source. Poultry Science 2003;82:272-278.
Sklan D, Noy Y. Crude protein and essential amino acid requirements in chicks during the first week post-hatch. British Poultry Science 2003;44:266–274.