Journal of Nuclear Materials 200 (1993) 144-148 North-Holland
jog .rnalof
flUClgr
materials
Letter to the Editors
Cation self-diffusion in
( T h - 5 % U ) O 2
A.C.S. Sabioni a, F.S. Lameiras b, P.E. Cardoso b
a Departamento de Ffsica, Unirersidade Federal de Ouro Preto, 35400 Ouro Preto, MG, Brazil
b Centro de Desem,oh,imeto da Tecnologia Nuclear (CDTN), ComissJo Nacional de Energia Nuclear (CNEN), Caixa Postal 1941, 30161 Belo Horizonte, MG, Brazil
Received 2 October 1992; accepted 14 December 1992
The utilization of thoria-based materials as nuclear fuels for pressurized water reactors was investigated in a joint Brazilian-German programme [1]. The present work was realized in the framework of that programme for the purpose of the determination of the cation volume self-diffusion in the nuclear fuel (Th-5%U)Oz. In the actinide ,.,~ides of the fluorite type structure as ThO 2, UO2, PuO2, etc., the cation is the more slowly moving species and is rate-determining in diffu- sion-controlled high temperature kinetic processes. In order to interpret the processes such as creep, grain growth, sintering and in-reactor densification it is nee- essary to know the cation diffusion coefficients in those oxides.
In (Th-5%U)O 2 there are two cations: thorium and uranium. According to the data published by Matzke [2] and King [3], the Th and U volume diffusion coeffi- cients measured in ThO 2 single crystals have approxi-
mately the same values. Thus, in this work, the diffu- sion coefficients of Th and U in ( T h - 5 % U ) O 2 are assumed to have also the same values.
The Th and U volume diffusion coefficients were measured in ( T h - 5 % U ) O 2 polyerystals using Assmann and Stehle's model [4] for the thermal densification in the final-stage sintering, which is given by
A V 6 y O D t
Vo
kT E(P°'Ir3')"
(1)
i
where A V / V o is the relative volume change of a sin- tcred sample after a resintering test, Y the surface tension, n the vacancy volume, D the volume diffusion coefficient of the more slowly moving species, k Boltz- mann's constant, t the annealing time of the resinter- ing, T the absolute temperature, roi the initial radius of the ith class of pores in the sintered sample, and P0i
e/
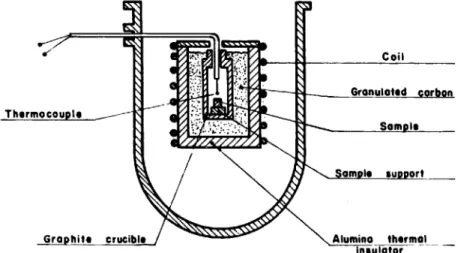
Thermocouple
~
Sample
Graphite crucible /
~
~A!umino thermal
insulator
Fig. 1. Scheme of the heat-treatment arrangement used for resintering tests.
Coil
SUDDOrt
A.CS. Sabioni et aL / Cation self-diffusion in (Th-5%U)O z 145 the volume fraction of the ith class of pores in the
sintered sample.
In this model, described in detail in ref. [4], the basic mechanisms for shrinkage of the residual porosity are the generation of an excess vacancy concentration around the pores and the migration of vacancies to the grain boundaries by volume diffusion. This model was
successfully used by Assmann and Stehle [4] to evalu- ate the thermal densification in U P 2 pellets.
To determine the volume self-diffusion coefficient of the cations in ( T h - 5 % U ) O , , using eq. (1), the factor Ei(Poi/r3t) was calculated from the spatial pore distri- bution measured in the sintered samples through Saltykov's method [5]; the surface tension 3' was tal~en
~ e (a)
i!
i!
~ J ~ c . . . . Resintered sample at - - 0 . 6 ~ ; " - ~ , ~ 16000C, 5h, vocuum0.5
0.4
i
0.3
0.2 ~.
i
I'o
i o oPore diameter (.~Lm)
0.6i
~ 0,7 (b) Sintered sample
0.5 1700°C, 4 h , vacuum
~
o.4]
:~ :
"".'~ ',
~o~
0.3t
~_j
0 i
'~__
. 0.2
?" o., .
i
10
t O0
Pore
diameter (p.m}
°.. I
O.7do.G
(el
I
~ , $intered sample ~x~ ' - - - Rusinteroecl sample at
• ~x, 1800C, 1.5h, vacuum
' 1'o t ~
Pore
diameter |/u. m)
146 A.C.X Sabioni et al. / Cation self.diffusion in (Th-5%U)O z
" ~ 30-
" ~ " 25"
u 20.
, , . ~ 15.
"~ t 0
| =
Sintered somple
- - - Resintered somple ot ~
Groin d i o m e t e r ( ~ m )
Fig. 3. Grain size distributions in a (Th-5%U)O 2 pellet as-sintered and after resintering annealing at 1800°C, 5 h under vacuum.
equal to 1.15 J / m 2 [6]; the vacancy volume ,Q for (Th-5%U)O2 is equal to 4.37 × 10 -23 cm 3 [7] and the thermal densification data A V / V o were obtained by subjecting sintered ( T h - 5 % U ) O 2 samples to resinter- ing tests. The relative volume changes were calculated through the expression
AV/Vo = pjp~- ',
where Ps and Pr are the dcnsities of the sample as- sintered and after the resintering test, respectively, both measured by means of the penetration-immer- sion method [8].
The sintered ( T h - 5 % U ) O 2 samples used in this study were produced by pressing and sintcring micro- spheres obtained by means of a gel precipitation tech- nique [1]. The purity of the samples was superior to 99.9%; the densities were equal to 95% of the theoreti- cal value and the grain size was about 13 ~m. These samples were resintered in an induction furnace be- tween 1600 and 1800°C under vacuum (1.3 x 10 -2 Pa). The scheme of the experimental arrangement used for the resintering heat treatments is shown in fig. 1. The experimental results obtained for the thermal densifi- cation of the (Th-5%U)O 2 pellets are listed in table 1.
Table 1
Experimental results of the resintering tests
Sample Temperature (°C) Time (h) Densification (%)
1 1600 5.0 0.126
2 1600 5.0 0.113
3 1700 4.0 0.270
4 1700 4.0 0.361
5 1700 5.0 0.377
6 1800 1.5 0.360
7 1800 5.0 0.614
Figs. 2a-2c show typical pore size distributions in ( T h - 5 % U ) O 2 before and after thermal densification from 1600 to 1800°C. No significant grain growth was observed during the resintering tests as shown in fig. 3. The cation volume diffusion coefficients in ( T h - 5%U)O 2 determined by means of eq. (1), using the data described above, can be expressed by the Arrhe- nius equation
D ( c m 2 / s )
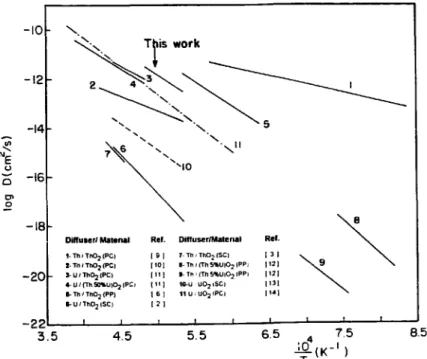
= 5.47 × 10 -3 exp( -367.36 kJ m o l - l i f T ) . (2) The previous data for the Th and U volume diffu- sion in ThO2-based materials are resumed in table 2. These data present large scatter as shown in fig. 4, where are represented also our results and the U volume diffusion coefficients measured in U O 2 single crystals [13] and polycrystals [14].
Our results are about 4 to 5 orders of magnitude higher than the U and Th volume diffusion coefficients measured in ThO 2 single crystals, but fall within the range of the measured values in polycrystalline sam- ples. Discrepancies between the results obtained in single crystals and polycrystals can be observed also for the U volume diffusion in UO 2 as shown in fig. 4.
A.C.S. Sabioni et at / Cation self-diffusion in ( T h - 5 % U ) O z
Table 2
Parameters of cation lattice self-diffusion in thoria-based materials
Material a) Diffusing Temperature Atmosphere Do (cm2/s) Activation element range (°C) energy
(kJ/mol)
Method c) Ref. 147 ThO 2 (SC) U 1600-2000 Vacuum 0.5 627.9 A [2] ThO 2 (SC) Th 1924-2045 Ar 0.35 625.807 D + E ]3]
ThO 2 (PP) Th 1300-1600 Air 1.3 x 10-~ 389.298 B [6] THO2-2.31% CaO (PP) Th 1300-1600 Air 4.02x 10 -6 234.416 B [6] 1"1102-4.25% CaO (PP) Th 1300-1600 Air 4.35 x 10 -? 196.742 B [6] THO2-8.8% CaO (PP) Th 1300-1600 Air 3.43 x 10 -? 188.370 B [6] ThO2 (PC) Th 925-1480 - 4 x 10 - s 133.022 C [9] ThO 2 (PC) Th 1600-2100 b) 1.25 X 10 - 7 246.137 D [10] ThO 2 (PC) U 1800-2000 Ar 1.1 x 10 - 4 319.577 E [11] ThO 2-50% UO2 (PC) U 1800-2300 Ar 7 . 5 9 x 10 - 4 359.577 E [11]
T H O 2 - 5 % U O 2 (PP) Th 950-1075 Air 7.26x 10 . 2 528.025 F [12]
THO2-5% UO 2 (PP) Th 1050-1175 A r + 4 % H 2 8.88× 10 - s 449.155 F [12]
a) SC = single crystal; PC = polycrystal and PP = pressed powder.
b) The experiments were conduced under air, C O / C O 2, vacuum and H 2. The Th diffusion in ThO 2 was found to be independent on oxygen pressure (10 -20 to 0.2 atm) in the temperature range investigated.
c) Experimental methods:
A: a-energy degradation method.
B: Coble's model of intermediate stage sintering kinetics.
C: Determination of isotopic concentration gradients by mass spectrometry analysis. D: e-ray spectrometry.
E: Sectioning method.
F: Johnson's model of initial stage sintering kinetics.
~E
o
o
- I 0
-12
-14
-16
-18
- 2 0
~
" ~ " ~ 1 1R l l . D i l t u s e r / M a l e roll g e l . Diffuser/ IVlaMrk~l
t"Tfl~ T~q~2(PC) J ~* ] 7-Th~Th02|SC) { 3 I ~ . ~
1- Tn I ThO2 (PC) [101 ll- Th t (3~ 5%U)O2 IPP] 112 ]
3- U I YhO2 (PC) 111) I- Tt~ ' ~'h sqbuIO2 IPP~ 112)
41- U/(~hSO~lU~L2 JpC ~ (11) IO-U UO2tSC) I 13 ]
II- Th t ThO2 (PP) 1 6 ] 11 U. UO2 IPC) 114]
i - u l t ~ 2 1 s c ) [ :~ 1
I I t l I
4.5 5,5
-221 I I T t
3 . 5 6.5 7.5 8.5
Fig. 4. Arrhenius plot of the Th and U diffusion coefficients D of the present results and the data of other authors. The solid lines are concerned to volume diffusion in ThOe-based materials; ( . . . ) U volume diffusion in U O 2 single crystals and ( . . . ) U
148 A.C.S. Sabioni et aL / Cation self-diffusion in (Th-5%U)02 References
[1] KFA, NUCLEBRAS, KWU, NUKEM - Program of Research and Development on the Thorium Utilization in PWRs, Final Report (1979-1988)JiiI-Spez. 488 (1988). [2] Hi. Matzke, J. Phys. Colloque C7, 37 (1976) 452. [3] A.D. King, J. Nucl. Mater. 38 (197i) 347.
[4] H. Assmann and H. Stehle, Nuc. Eng. Des. 48 (1978) 49. [5] S.A. Saltykov, Stereometrische Metallographie (VEB Deutscher Verlag f'fir Grundstoffindustrie, Leipzig, 1974). [6] S.N. Laha and A.R. Das, J. Nucl. Mater. 39 (1971) 285. [7] A.C.S. Sabioni, M.S. Thesis, Univ. Fed. de Minas Gerais,
Brazil, 1985.
[8] W. D6rr, H. Assmann, G. Mayer and J. Steven, J. Nucl. Mater. 81 (1979) 135.
[9] C.S. Morgan and C.S. Yust, USAEC Rep. ORNL-3313 (1962) p. 142.
[10] RJ. Hawkins and C.B. AIcock, J. Nucl. Mater. 26 (1968) 112.
[11] H. Furuya, J. Nucl. Mater. 26 (1968) 123.
[12] W.B. Ferraz, P.E. Cardoso and F.S. Lameiras, Anais do 34 ° Congresso Brasileiro de Cerfimica, May 1990, Biume- nau, Brazil.
[13] D.K. Reimann and T.S. Lundy, J. Am. Ceram. Soc. 52 (1969) 511.