Mercedes Concórdia Carrão‑Panizzi(1), Prachuab Kwanyuen(2), Sevim Zeynep Erhan(3) and Ivani de Oliveira Negrão Lopes(1)
(1)Embrapa Soja, Rodovia Carlos João Strass, Distrito de Warta, CEP 86001‑970 Londrina, PR, Brazil. E‑mail: mercedes@cnpso.embrapa.br, negrao@cnpso.embrapa.br (2)North Carolina State University, Crop Science Department, Zip Code 27695 Raleigh, NC, USA. E‑mail: prachuab‑kwanyuen@nscu.edu (3)United States Department of Agriculture, Agricultural Research Service, National Center for Agricultural Utilization Research, Food and Industrial Oil Unit, Zip Code 61604 Peoria, IL, USA. E‑mail: sevim.erhan@ars.usda.gov
Abstract – The objective of this work was to determine genetic and environmental effects on beta-conglycinin and glycinin content in Brazilian soybean cultivars. The concentrations of these protein fractions were analyzed by scanning densitometry after electrophoresis, in 90 Brazilian soybean cultivars sown in Ponta Grossa, PR, in 2001. The effects of the sowing location were determined in the cultivar MG/BR 46 (Conquista), sown in 16 locations of Goiás and Minas Gerais states (Central Brazil), and in the cultivar IAS 5, sown in 12 locations of Paraná and São Paulo states (Southern Brazil), in 2002 soybean season. A significant variability for beta‑conglycinin (7S) and glycinin (11S) protein fractions ratio was observed among the 90 Brazilian soybean cultivars. 'MS/BRS 169' (Bacuri) and 'BR-8' (Pelotas) presented the highest and the lowest 11S/7S ratios (2.76 and 1.17, respectively). Beta-conglycinin protein fractions presented more variability than glycinin protein fractions. Grouping test classified 7S proteins in seven groups, 11S proteins in four groups, and protein fraction ratios (11S/7S) in nine groups. Significant effect of sowing locations was also observed on protein fractions contents. There is a good possibility of breeding for individual protein fractions, and their subunits, without affecting protein content.
Index terms: eletrophoresis, nutraceutic properties, protein fractions, seed, sowing location.
Variação genética e ambiental e teores de beta‑conglicinina
e glicinina em cultivares de soja brasileiras
Resumo – O objetivo deste trabalho foi avaliar os efeitos da variação genética e ambiental sobre os teores de beta-conglicinina e glicinina em cultivares de soja brasileiras. A concentração dessas frações protéicas foi determinada por densitometria após eletroforese, em 90 cultivares de soja, semeadas em Ponta Grossa, PR, em 2001. Os efeitos dos locais de semeadura foram determinados na cultivar MG/BR 46 (Conquista), semeada em 16 locais de Goiás e Minas Gerais, e na cultivar IAS 5, semeada em 12 locais no Paraná e em São Paulo, em 2002. Foi observada variabilidade significativa quanto à razão entre as frações protéicas da beta‑conglicinina (7S) e da glicinina (11S), entre as 90 cultivares avaliadas, em que a 'MG/BR 169' (Bacuri) apresentou a maior razão 11S/7S (2,76) e a 'BR-8' (Pelotas) a menor (1,17). As frações protéicas de beta-conglicinina apresentaram maior varibilidade do que as de glicinina. A análise de agrupamento discriminou as proteínas 7S em sete grupos, as 11S em quatro, e as razões 11S/7S em nove. Efeito significativo dos locais de semeadura também foi observado sobre os teores das frações protéicas. Existe uma boa possibilidade de melhoramento para as frações individuais de proteínas e suas subunidades, sem que o teor de proteína seja alterado.
Termos para indexação: eletroforese, propriedades nutracêuticas, frações protéicas, semente, local de semeadura.
Introduction
The major storage proteins of soybean seeds are beta-conglycinin (7S globulin) and glycinin (11S globulin). Beta-conglycinin is a trimeric protein composed of three subunits alpha', alpha and beta (Thanh & Shibasaki, 1977). Glycinin is a hexameric
protein composed of five subunits A1aB1b, A1bB2,
A1B1a, A3B4 and A5A4B3, and each subunit is composed of acidic and basic polypeptides, which are
linked together by a disulfide bond (Kitamura et al.,
1976; Staswick et al., 1984). Protein fractions have different functional properties, related to gel formation,
1997). Heat and calcium-induced coagulum (tofu gel) made from high content glycinin (11S) soybean is harder than with higher 7S fraction soybean (Saio
et al., 1969). The large number of disulfide bonds
(–SH), due to more methionine and cystein in glycinin fraction, improves gel formation capacity (Yamauchi et al., 1981) making glycinin gel harder and more turbid than beta-conglycinin gel. However, the higher hydrophobicity, the easy unfolded structure, and less thermally stable properties of beta-conglycinin make its emulsifying ability stronger than that of glycinin (Fukushima, 2001).
Genetic studies revealed variation on protein fractions and subunits, and cultivars with high levels of 7S or 11S fractions are available (Tsukada et al., 1986; Takahashi et al., 2000; Ogawa et al., 1989).The cultivar Tohoku 124 presents high ratio of glycinin to beta-conglycinin (Takahashi et al., 2000), while the
cultivar Kyu‑kei 305 contains only glycinin as storage
proteins and lacks the three major allergenic proteins
of 28K, alpha and beta subunits (Takahashi et al., 2000). Kyu‑kei is the cultivar with the least quantities
of allergens. Protein contents of these cultivars were the same as the recurrent parents. This tendency was also observed by Harada et al. (1983), who reported no correlation between 11S/7S ratio and seed protein
content, observing no significant differences in
protein content among three genotypes. Yaklich (2001), however, reported that high-protein lines appear to contain more beta-conglycinin and glycinin than normal-protein soybean lines, and the amount of subunits and polypeptides was different among lines. These conclusions were observed from data of
several breeding lines evaluated for five years. Moraes
et al. (2006) observed, in two high protein soybean isolines, increasing of 11S proteins and no changes in 7S proteins, which consequently promoted higher 11S/7S ratio.
Environmental effects on these protein fractions have been reported (Murphy & Ressureccion, 1984; Fehr et al., 2003). In a study of interaction between genotype and environment, Fehr et al. (2003) observed
significant differences among all traits (protein
fractions), except for the A3 subunit of glycinin, in 14 genotypes grown in 8 locations for three years. They
observed no significant interactions between genotypes
and years or locations. Murphy & Ressureccion (1984) reported differences for glycinin contents within years.
Helms et al. (1998) found a genotype x environment interaction for protein content and 11S/7S ratio. The magnitude of the differences between the two cultivars for 11S/7S ratio varied among locations within year.
Soybean proteins have also been claimed to be effective in the prevention of cardiovascular diseases
(USFDA, 1999), and beta‑conglycinin (7S) has a role in the upregulation of liver high‑affinity LDL receptors (Lovati et al., 1998). Duranti et al. (2004), investigating
the effect of daily administration of isolated soybean 7S globulin alpha', observed a significant reduction on plasma cholesterol and triglycerides levels in hypercholesterolemic rats. The same authors showed that it is possible to enhance the lipid lowering effects by further increases in the alpha' subunit doses. Estimated amounts of alpha' subunit in the 7S globulin trimer is about one third of the total globulin weight
(Duranti et al., 2004).
In Brazil, soybean is grown in a wide range of environments, and differences for protein fractions among Brazilian cultivars have not been analyzed. Information about differences in the amount of protein fractions among soybean cultivars could aim
at processors interested in specific products, which
need emulsifying or gel formation properties. Those information could also be interesting to process functional foods, since there is a promise of biological effects on lipid-lowering therapy.
The objective of this work was to determine genetic and environmental effects on beta-conglycinin – 7S (alpha', alpha, and beta subunits) and glycinin – 11S (acidic and basic subunits) contents in Brazilian soybean cultivars.
Materials and Methods
In a first experiment, 90 Brazilian soybean cultivars
were analyzed to determine genetic differences on contents of protein fractions. They were sown in plots of 4 rows (5 m length), in fertile soil, in Ponta Grossa, Paraná state (25º5'S), in 2001 crop season.
In a second experiment, effects of the sowing location were determined in the cultivar MG/BR 46 (Conquista), sown in 16 locations (Anápolis, Cerrados, Senador Canedo, Alvorada, Cristalina-1, São Miguel
do Passa Quatro, Rio Verde, Uberaba, Conquista, Uberlândia, Luziana, Sacramento, Buritis, Iraí de
and Minas Gerais states (Central Brazil), in 2002 crop season. Cristalina-1 and Cristalina-2 locations
are different fields of the same location, and it was observed a high infestation of nematodes in the field
Cristalina-2. Effects of the sowing location was also determined in cultivar IAS 5, sown in 12 locations
(Guaíra, Pedrinhas Paulista, Pirassununga, Londrina,
Morro Agudo, Cambará, Ibirarema, Ponta Grossa,
Mandaguaçu, Cascavel, Luiziana and Nuporanga) of
Paraná and São Paulo states (Southern Brazil), in 2002 crop season. For chemical analysis, grains of the three
replications of the experiment carried out in field were
mixed in same proportion to form a compost sample. The analysis in laboratory was conducted according to a complete randomized design with two replications (compost sample divided in two).
Ten grams of soybean seeds were ground in a centrifugal grinding mill, equipped with 24-tooth rotor and 0.5 mm stainless steel ring sieve, with the motor speed set at 15,000 rpm. This setting produced soybean
flour with a uniform particle size of less than 0.25 mm.
Soluble protein was extracted for 1 hour at room temperature, while stirring a gram of full fat soybean
flour in a 1:15 (w/v) ratio with 0.2 M Tris‑HCl buffer,
pH 8, that contained 0.1 M beta-mercaptoethanol. The mixture was centrifuged at 10,000 g for 10 min at 4ºC.
After the fat layer was removed, an aliquot of 1 mL of
the protein crude extract or supernatant was taken from each sample. Total protein concentration of each sample was determined by the method of Bradford (1976). Storage proteins and their polypeptides in the crude extract were dissociated by adding an equal volume
of 5% SDS solution and 0.1 M beta‑mercaptoethanol
to each sample; then, samples were placed in boiling water bath for 10 min for complete dissociation. Glycerol and bromophenol blue were added to each
sample to the final concentration of 10 and 0.025%,
respectively.
Proteins and their polypeptides were separated in a vertical slab gel apparatus, according to Chua (1980), with modifications. Each sample, containing
approximately 80–100 μg proteins or 10 μL of
protein sample, was loaded onto the gel. Proteins and polypeptides were separated using a linear gradient of 10 to 20% polyacrylamide gel. The dimension of the separating gels was 14x16x0.15 cm, with 15 sample wells in stacking gel. Blank sample wells were left between loaded samples to prevent
protein cross-contamination during electrophoresis
and to facilitate accurate quantification by scanning
densitometry after electrophoresis. Since more than one gel was required for these protein samples, and it was necessary to obtain the same polyacrylamide composition throughout the entire experiment, identical gradient gels were cast from the same polyacrylamide solution and from the same gradient-production condition. Electrophoresis of each protein sample was carried out in duplicate, at a constant current of 10 mA per gel at room temperature, until bromophenol blue or tracking dye reached the bottom of the gel.
Gels were stained in freshly prepared dye containing 0.25% coomassie brilliant blue (w/v), 40% (v/v) methanol and 10% (v/v) acetic acid, and were destained in 40% (v/v) methanol and 10% (v/v) acetic acid.
Destained gels were soaked in deionized water for at
least 5 min. Each gel was compressed and dried in a
dryer. Dried gels were scanned as previously described by Kwanyuen et al. (1997), with a molecular dynamics
personal densitometer equipped with a HeNe laser light
source. ImageQuant software for volume integration was used in data analysis, to determine total absorbance of entire protein bands. Apparent absorbance of each protein was obtained by subtracting the background absorbance from the total absorbance of the protein bands within the same gel volume. The relative amount of each protein or polypeptide was expressed as a percentage of total protein in the same gel lane. All data were reported as means of two replications.
A completely randomized design was used to evaluate protein fraction composition of soybean,
in both experiments. In the experiment 1, ANOVA
and Scott & Knott (1974) cluster analysis, at 5% of probability, was used for grouping means of the 90 cultivars. Principal component analysis (PCA) (Johnson & Wichern, 2007) was applied in order to have a more synthetic and informative description of the data set. The retained components consist of weighted sum of original variables in the following mathematical model: PCil = AilXl + ... + AinXn i = 1, 2,..., n, with nine variables (alpha', alpha, beta, total 7S, acidic, basic, total 11S, 11S/7S ratio and total fractions = 11S+7S). The
coefficients were chosen in such a way that the first
matrix among the variables of the protein fractions was
also calculated. In the experiment 2, ANOVA andTukey
test, at 5% of probability, were used for comparing data from different sowing locations of the cultivars MG/BR 46 and IAS 5.
Results and Discussion
A significant variability for the 11S/7S ratio was
observed among the 90 Brazilian soybean cultivars, and the values ranged from 2.76 ('MS/BRS 169' –
Bacuri) to 1.17 ('BR-8' – Pelotas) (Table 1). The observed differences for protein fractions among cultivars make possible genetic manipulation to improve protein quality of soybean cultivars. Since glycinin (11S fraction) contains higher content of sulfur amino acids than beta-conglycinin (7S), it is possible to improve the amino acid balance of soybean protein. Therefore, different concentrations of protein fractions may enhance the nutritional
value of soybean, as well as its properties for specific
protein functionalities.
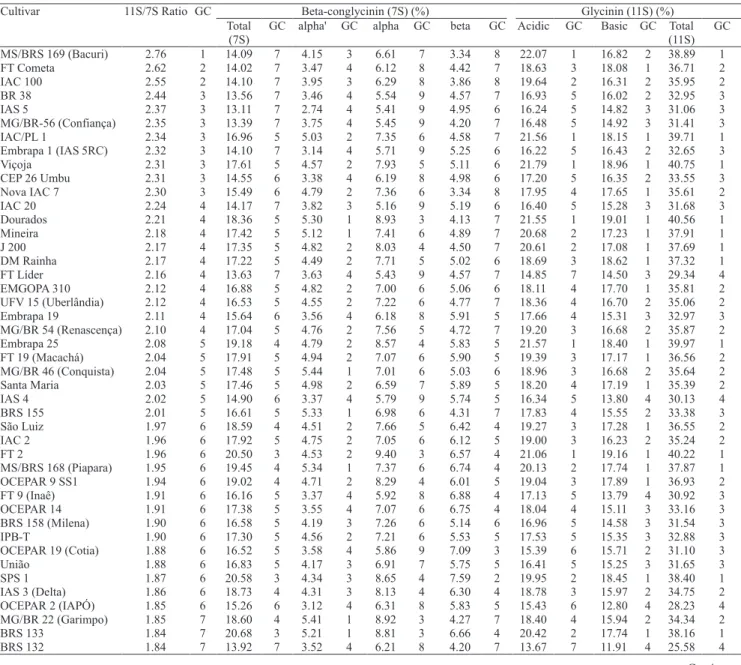
Beta-conglycinin (7S) (%) Glycinin (11S) (%) Cultivar 11S/7S Ratio GC
Total (7S)
GC alpha' GC alpha GC beta GC Acidic GC Basic GC Total (11S)
GC
MS/BRS 169 (Bacuri) 2.76 1 14.09 7 4.15 3 6.61 7 3.34 8 22.07 1 16.82 2 38.89 1 FT Cometa 2.62 2 14.02 7 3.47 4 6.12 8 4.42 7 18.63 3 18.08 1 36.71 2 IAC 100 2.55 2 14.10 7 3.95 3 6.29 8 3.86 8 19.64 2 16.31 2 35.95 2 BR 38 2.44 3 13.56 7 3.46 4 5.54 9 4.57 7 16.93 5 16.02 2 32.95 3 IAS 5 2.37 3 13.11 7 2.74 4 5.41 9 4.95 6 16.24 5 14.82 3 31.06 3 MG/BR-56 (Confiança) 2.35 3 13.39 7 3.75 4 5.45 9 4.20 7 16.48 5 14.92 3 31.41 3 IAC/PL 1 2.34 3 16.96 5 5.03 2 7.35 6 4.58 7 21.56 1 18.15 1 39.71 1 Embrapa 1 (IAS 5RC) 2.32 3 14.10 7 3.14 4 5.71 9 5.25 6 16.22 5 16.43 2 32.65 3 Viçoja 2.31 3 17.61 5 4.57 2 7.93 5 5.11 6 21.79 1 18.96 1 40.75 1 CEP 26 Umbu 2.31 3 14.55 6 3.38 4 6.19 8 4.98 6 17.20 5 16.35 2 33.55 3 Nova IAC 7 2.30 3 15.49 6 4.79 2 7.36 6 3.34 8 17.95 4 17.65 1 35.61 2 IAC 20 2.24 4 14.17 7 3.82 3 5.16 9 5.19 6 16.40 5 15.28 3 31.68 3 Dourados 2.21 4 18.36 5 5.30 1 8.93 3 4.13 7 21.55 1 19.01 1 40.56 1 Mineira 2.18 4 17.42 5 5.12 1 7.41 6 4.89 7 20.68 2 17.23 1 37.91 1 J 200 2.17 4 17.35 5 4.82 2 8.03 4 4.50 7 20.61 2 17.08 1 37.69 1 DM Rainha 2.17 4 17.22 5 4.49 2 7.71 5 5.02 6 18.69 3 18.62 1 37.32 1 FT Líder 2.16 4 13.63 7 3.63 4 5.43 9 4.57 7 14.85 7 14.50 3 29.34 4 EMGOPA 310 2.12 4 16.88 5 4.82 2 7.00 6 5.06 6 18.11 4 17.70 1 35.81 2 UFV 15 (Uberlândia) 2.12 4 16.53 5 4.55 2 7.22 6 4.77 7 18.36 4 16.70 2 35.06 2 Embrapa 19 2.11 4 15.64 6 3.56 4 6.18 8 5.91 5 17.66 4 15.31 3 32.97 3 MG/BR 54 (Renascença) 2.10 4 17.04 5 4.76 2 7.56 5 4.72 7 19.20 3 16.68 2 35.87 2 Embrapa 25 2.08 5 19.18 4 4.79 2 8.57 4 5.83 5 21.57 1 18.40 1 39.97 1 FT 19 (Macachá) 2.04 5 17.91 5 4.94 2 7.07 6 5.90 5 19.39 3 17.17 1 36.56 2 MG/BR 46 (Conquista) 2.04 5 17.48 5 5.44 1 7.01 6 5.03 6 18.96 3 16.68 2 35.64 2 Santa Maria 2.03 5 17.46 5 4.98 2 6.59 7 5.89 5 18.20 4 17.19 1 35.39 2 IAS 4 2.02 5 14.90 6 3.37 4 5.79 9 5.74 5 16.34 5 13.80 4 30.13 4 BRS 155 2.01 5 16.61 5 5.33 1 6.98 6 4.31 7 17.83 4 15.55 2 33.38 3 São Luiz 1.97 6 18.59 4 4.51 2 7.66 5 6.42 4 19.27 3 17.28 1 36.55 2 IAC 2 1.96 6 17.92 5 4.75 2 7.05 6 6.12 5 19.00 3 16.23 2 35.24 2 FT 2 1.96 6 20.50 3 4.53 2 9.40 3 6.57 4 21.06 1 19.16 1 40.22 1 MS/BRS 168 (Piapara) 1.95 6 19.45 4 5.34 1 7.37 6 6.74 4 20.13 2 17.74 1 37.87 1 OCEPAR 9 SS1 1.94 6 19.02 4 4.71 2 8.29 4 6.01 5 19.04 3 17.89 1 36.93 2 FT 9 (Inaê) 1.91 6 16.16 5 3.37 4 5.92 8 6.88 4 17.13 5 13.79 4 30.92 3 OCEPAR 14 1.91 6 17.38 5 3.55 4 7.07 6 6.75 4 18.04 4 15.11 3 33.16 3 BRS 158 (Milena) 1.90 6 16.58 5 4.19 3 7.26 6 5.14 6 16.96 5 14.58 3 31.54 3 IPB-T 1.90 6 17.30 5 4.56 2 7.21 6 5.53 5 17.53 5 15.35 3 32.88 3 OCEPAR 19 (Cotia) 1.88 6 16.52 5 3.58 4 5.86 9 7.09 3 15.39 6 15.71 2 31.10 3 União 1.88 6 16.83 5 4.17 3 6.91 7 5.75 5 16.41 5 15.25 3 31.65 3 SPS 1 1.87 6 20.58 3 4.34 3 8.65 4 7.59 2 19.95 2 18.45 1 38.40 1 IAS 3 (Delta) 1.86 6 18.73 4 4.31 3 8.13 4 6.30 4 18.78 3 15.97 2 34.75 2 OCEPAR 2 (IAPÓ) 1.85 6 15.26 6 3.12 4 6.31 8 5.83 5 15.43 6 12.80 4 28.23 4 MG/BR 22 (Garimpo) 1.85 7 18.60 4 5.41 1 8.92 3 4.27 7 18.40 4 15.94 2 34.34 2 BRS 133 1.84 7 20.68 3 5.21 1 8.81 3 6.66 4 20.42 2 17.74 1 38.16 1 BRS 132 1.84 7 13.92 7 3.52 4 6.21 8 4.20 7 13.67 7 11.91 4 25.58 4
Table 1. Mean values of protein components (%), in seeds of 90 soybean Brazilian cultivars, and group classification (GC) by Scott‑Knott test(1).
In soybean breeding programs, whose main objective is to obtain high quality protein, the 11S/7S ratio has been a criterion of indirect selection for this trait. Through the analysis of 11S/7S ratio data, it is possible to select high or low 11S or 7S lines or cultivars. Cultivar MS/BRS 169 (Bacuri) presented 11S/7S ratio of 2.76, which is relevant, when compared
with observations of Kitamura & Kaizuma (1981),
who reported 11S/7S ratio of 2.59 for the genotype Mo-shi-dou, which is the germplasm source for high
levels of the 11S protein fractions. The same authors observed a ratio of 11S/7S of 1.12 for normal strains. Therefore, 'MS/BRS 169'(Bacuri) could be a genetic source to increase glycinin content for Brazilian soybean breeding programs.
'MS-BRS 169' (Bacuri) and 'BR-8' (Pelotas) presented the highest and the lowest 11S/7S ratios (2.76 and 1.17, respectively), among all the 90 genotypes. Content of beta-conglycinin (7S) protein subfractions alpha', alpha, and beta were, respectively, 4.1, 6.6, and
Beta-conglycinin (7S) (%) Glycinin (11S) (%) Cultivar 11S/7S Ratio GC
Total (7S)
GC alpha' GC alpha GC beta GC Acidic GC Basic GC Total (11S)
GC
Santa Rosa 1.84 7 20.37 3 5.53 1 7.84 5 7.01 3 20.02 2 17.42 1 37.44 1
DM Soberana 1.83 7 20.46 3 5.02 2 8.30 4 7.14 3 20.50 2 17.06 1 37.56 1
Embrapa 26 1.83 7 19.16 4 4.39 2 7.83 5 6.94 3 17.87 4 17.20 1 35.07 2
BR 6 (Nova Bragg) 1.81 7 20.77 3 4.97 2 8.05 4 7.75 2 20.18 2 17.47 1 37.66 1
BR 14 (Modelo) 1.81 7 18.78 4 5.12 1 7.26 6 6.40 4 18.92 3 15.07 3 33.99 2
BRS 138 1.80 7 18.15 5 4.35 3 8.12 4 5.68 5 16.46 5 16.28 2 32.74 3
RS 5 (Esmeralda) 1.79 7 20.00 3 5.85 1 8.18 4 5.96 5 18.96 3 16.92 2 35.88 2
CEP 10 1.79 7 15.93 5 3.44 4 6.53 7 5.95 5 15.54 6 13.03 4 28.56 4
Embrapa 48 1.79 7 15.23 6 3.64 4 5.84 9 5.75 5 13.86 7 13.41 4 27.26 4
IAC Holambra Stwart 1 1.78 7 21.22 3 5.00 2 7.98 5 8.25 2 20.48 2 17.37 1 37.85 1
EMGOPA 311 1.78 7 19.15 4 5.14 1 8.16 4 5.85 5 18.30 4 15.83 2 34.14 2
BRS 153 1.78 7 17.96 5 3.97 3 7.74 5 6.25 4 15.74 6 16.14 2 31.89 3
Davis 1.78 7 16.43 5 3.30 4 6.34 8 6.80 4 15.93 5 13.26 4 29.19 4
OCEPAR 15 (Paracatu) 1.78 7 20.79 3 5.37 1 8.88 3 6.53 4 19.29 3 17.63 1 36.92 2
BR 4 1.77 7 16.54 5 3.32 4 6.07 8 7.15 3 15.64 6 13.60 4 29.24 4
CD 202 1.76 7 15.24 6 3.50 4 6.13 8 5.61 5 14.90 7 11.97 4 26.87 4
BRS 135 1.76 7 20.75 3 4.98 2 7.89 5 7.88 2 19.37 3 17.22 1 36.59 2
Campos Gerais 1.73 7 17.46 5 4.12 3 6.42 8 6.92 3 15.43 6 14.69 3 30.12 4
MG/BR 58 (Segurança) 1.71 7 20.62 3 4.60 2 7.93 5 8.09 2 18.31 4 16.96 2 35.27 2
Bienville 1.71 7 21.25 3 5.02 2 8.84 3 7.39 3 19.68 2 16.61 2 36.29 2
FT 6 (Veneza) 1.69 8 17.94 5 3.32 4 6.63 7 7.98 2 17.54 5 12.72 4 30.27 4
MS/BR20 (Ipê) 1.68 8 21.46 3 5.14 1 9.06 3 7.26 3 19.82 2 16.25 2 36.07 2
MG/BR 66 (Liderança) 1.68 8 20.85 3 5.26 1 7.55 5 8.04 2 18.70 3 16.35 2 35.05 2 MS/BRS 170 (Taquari) 1.65 8 20.79 3 4.29 3 8.28 4 8.21 2 18.22 4 16.09 2 34.31 2
BRS 134 1.65 8 19.77 4 4.21 3 8.06 4 7.50 3 18.04 4 14.52 3 32.57 3
IAC 1 1.64 8 21.32 3 4.93 2 9.86 2 6.53 4 19.18 3 15.91 2 35.09 2
Ivaí 1.64 8 20.71 3 5.02 2 8.38 4 7.32 3 18.82 3 15.07 3 33.89 2
Ivorá 1.63 8 17.83 5 3.69 4 6.89 7 7.25 3 15.37 6 13.73 4 29.10 4
OCEPAR 6 1.62 8 18.63 4 4.27 3 7.74 5 6.62 4 16.98 5 13.19 4 30.17 4
IAC 16 1.62 8 18.20 5 3.80 3 6.63 7 7.78 2 14.93 7 14.54 3 29.47 4
BRS 156 1.62 8 17.90 5 4.01 3 7.32 6 6.58 4 15.77 6 13.17 4 28.94 4
KI-S 702 1.60 8 21.03 3 4.30 3 9.31 3 7.42 3 17.80 4 15.59 2 33.39 3
Cobb 1.59 8 21.25 3 4.11 3 7.63 5 9.51 1 17.90 4 15.93 2 33.83 2
Vila Rica 1.59 8 23.00 2 6.07 1 9.38 3 7.55 2 20.06 2 16.34 2 36.40 2
Embrapa 4 (BR 4 RC) 1.58 8 20.60 3 4.55 2 8.31 4 7.75 2 17.23 5 15.41 3 32.64 3
FT Jatobá 1.54 8 23.20 2 5.11 1 10.38 1 7.71 2 19.83 2 15.90 2 35.73 2
BRS 137 1.53 8 18.63 4 4.57 2 6.77 7 7.29 3 14.74 7 13.77 4 28.51 4
BR 23 1.52 8 21.76 2 4.71 2 9.16 3 7.88 2 18.12 4 14.95 3 33.06 3
BRS 62 1.50 9 25.42 1 5.52 1 10.73 1 9.18 1 20.42 2 17.78 1 38.20 1
OCEPAR 16 1.47 9 20.23 3 4.79 2 8.87 3 6.58 4 15.76 6 14.02 4 29.78 4
FT 14 (Piracema) 1.46 9 20.17 3 4.14 3 9.02 3 7.00 3 16.14 5 13.36 4 29.49 4
BR 36 1.46 9 23.39 2 4.98 2 9.28 3 9.12 1 18.45 4 15.71 2 34.15 2
FT 4 1.44 9 20.55 3 4.68 2 8.41 4 7.47 3 16.35 5 13.26 4 29.61 4
BR 12 1.44 9 21.36 3 4.76 2 9.20 3 7.40 3 16.08 5 14.62 3 30.70 3
BR 16 1.36 9 22.17 2 4.52 2 9.22 3 8.43 2 15.93 5 14.26 3 30.19 4
BR 8 (Pelotas) 1.18 9 23.35 2 5.52 1 10.15 2 7.69 2 14.52 7 12.92 4 27.43 4
Table 1. Continuation
3.3% for the cultivar MS/BRS 169 (Bacuri), and 5.5, 10.1, and 7.7% for 'BR-8' (Pelotas). Glycinin (11S) acidic and basic subfractions were, respectively, 22.1 and 16.8% for cultivar MS/BRS 169, and 14.5 and 12.9% for cultivar BR-8 (Pelotas) (Table 1). Fehr et al. (2003) found 11S/7S ratio of 2.04 for cultivar Vinton 81 and 1.51 for cultivar IA2021, in a study of three years in eight locations. 'Vinton 81' has good performance for tofu processing, which may be due to its high content of glycinin (11S). Because of its high 11S/7S ratio, the cultivar MS/BRS 169 (Bacuri) may have the same properties.
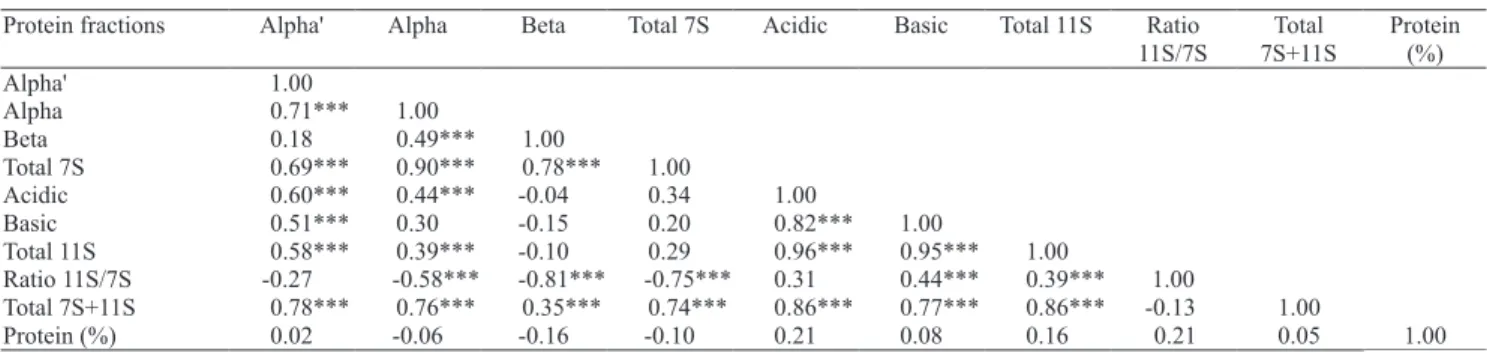
Strong positive correlations were observed among total protein frations [Glycinin (11S) and beta-conglycinin (7S)] with total 11S, and total 7S (Table 2). For 11S/7S ratio, inverse significant correlations were observed for beta-conglycinin (7S) subunits (alpha and beta) and for total 7S fraction, as expected. A positive significant correlation, although weak, was observed for total 11S protein fraction and 11S/7S ratio. Protein content exhibited no significant correlation with other protein components, as already observed by Harada et al. (1983) and Fehr et al. (2003). These data confirm the possibility of breeding for individual protein fractions and their subunits without affecting protein content. Yaklich et al. (2001), who studied the contribution of the two major protein fractions, in high seed protein lines of soybean, found higher concentration of these compounds in those lines than in normal-protein soybean lines.
Among the 90 cultivars sown in the same location, it was observed that beta-conglycinin (7S) protein fractions presented more variability than glycinin (11S) protein fractions. The
Scott‑Knott grouping test classified 7S proteins in
7 groups, 11S proteins in 4 groups, and protein fraction ratios (11S/7S) in 9 groups (Table 1). For the highest content of glycinin (11S), classified
at group 1 by Scott‑Knott test, it was observed a range of 40.75% (cultivar Viçoja) to 37.32% (DM
Rainha). However, within the groups 1, 2 and 3, which presented the highest values for 11S/7S ratios, just cultivars MS/BRS 169 (Bacuri), IAC/
PL 1 and Viçoja presented high values for glycinin
content, and were in group 1 (Table 1).
Inverse relationship between total 7S protein fractions and protein ratios can be observed at
the Scott‑Knott grouping test, where the majority
of the cultivars that presented low content of beta-conglycinin (7S) (groups 6 and 7) – which
included cultivars IAC 20, FT‑Líder, EMBRAPA 19,
IAS 4, OCEPAR 2 (Iapó), BRS 132, EMBRAPA 48
and CD 202 – also presented low content of 7S
protein fractions (Table 1), but were not in the first groups for the 11S/7S ratios. Cultivar BRS 132, in group 7, for both total 7S and 11S/7S ratio (13.92% and 1.84, respectively) because of the low content of 11S protein fraction (25.58%), was classified in group 4 for this fraction (Table 1).
Cultivars that presented the lowest 11S/7S ratios (group 9) also presented the highest values for total beta-conglycinin (7S), except for 'BRS 62', that is in group 1 for total 7S and 11S (Table 1). Cultivar BRS 62 presented the highest content of beta-conglycinin (7S) (25.4%), while cultivar IAS 5 had the lowest (13.11%); these cultivars had 11S/7S ratios of 1.50 and 2.37, respectively.
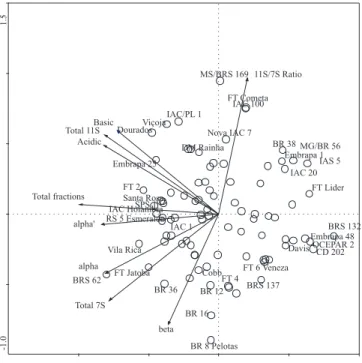
Figure 1 shows the functional relationship and closeness among the variables (protein fractions components). This two-dimensional representation
Protein fractions Alpha' Alpha Beta Total 7S Acidic Basic Total 11S Ratio
11S/7S
Total
7S+11S
Protein
(%)
Alpha' 1.00
Alpha 0.71*** 1.00
Beta 0.18 0.49*** 1.00
Total 7S 0.69*** 0.90*** 0.78*** 1.00
Acidic 0.60*** 0.44*** -0.04 0.34 1.00
Basic 0.51*** 0.30 -0.15 0.20 0.82*** 1.00
Total 11S 0.58*** 0.39*** -0.10 0.29 0.96*** 0.95*** 1.00
Ratio 11S/7S -0.27 -0.58*** -0.81*** -0.75*** 0.31 0.44*** 0.39*** 1.00
Total 7S+11S 0.78*** 0.76*** 0.35*** 0.74*** 0.86*** 0.77*** 0.86*** -0.13 1.00
Protein (%) 0.02 -0.06 -0.16 -0.10 0.21 0.08 0.16 0.21 0.05 1.00
Table 2. Correlations among storage protein fractions in soybean seeds of 90 Brazilian cultivars(1).
of the whole data set displays 89.5% of the total protein fractions variance (TPFV) and provides a grouping of variables, according to their relative position in the plane defined by principal component analysis 1 (PC1) and principal component analysis 2 (PC2). The first component PC1 (horizontal axis), associated with 55.4% of the TPFV, displays strong and negative loadings on almost all the protein fractions, except for the subunit beta, which is more negative in relation
to the second component PC2 (vertical axis) and the 11S/7S ratio, that is strongly positive related to second component either. Cultivars whose projections are at the end of the arrows (on crescent direction) are those that had high concentration of that protein fraction component, and, inversely, those that have extreme projections, at the decrescent direction, had less concentration of the specific protein component. Therefore, cultivar MS/BRS 169 (Bacuri) and cultivar BR-8 (Pelotas), which had the extreme values for 11S/7S ratios, are located in inverse extreme positions in the Figure 1, according to data in Table 1.
In experiment 2, when cultivar IAS 5 was sown in 12 different locations of Paraná and São Paulo states, Southern Brazil (23°S), it was observed a large variability for total glycinin (11S) and beta-conglycinin (7S) protein fractions. For total glycinin, this variability ranged from 29.6%, in
Nuporanga, to 39.8%, in Pirassununga. Variability
for total beta-conglycinin protein fraction ranged
from 13.6%, in Londrina, to 18.6%, in Nuporanga
(Table 3). Inverse relationship between 11S and
7S fractions can be observed in Nuporanga,
where the highest and the lowest concentrations occurred for both protein fractions (7S and 11S) (Table 3). In this location, it was also observed the lowest value of 1.59 for the 11S/7S ratio. Cascavel was the location that presented high content of 7S and 11S protein fractions, while
Londrina presented the lowest 7S concentration
(Table 3). By the data of cultivar IAS 5, for 11S and 7S protein fractions concentrations and 11S/7S ratio, it can be observed that sowing location
-1.5 1.0
.
alpha'
alpha
beta Total 7S
Acidic Basic Total 11S
11S/7S Ratio
Total fractions
FT Cometa
FT 6 Veneza Davis
IAS 5
OCEPAR 2 CD 202
BRS 132 Embrapa 1
Embrapa 48 BR 38
MG/BR 56
FT Lider IAC 20
BRS 137 BR 12
BR 16
BR 8 Pelotas SPS 1
FT 2
FT Jatoba Embrapa 25
BR 36
MS/BRS 169
IAC 100
FT 4 Santa Rosa
RS 5 Esmeralda
Vila Rica Viçoja
DM Rainha Dourados
IAC Holambra IAC/PL 1
BRS 62
IAC 1
Nova IAC 7
Cobb
-1.0
1.5
Figure 1. Principal component analysis of protein fractions and 11S/7S ratios, of 90 Brazilian cultivars, displaying the 5 highest and the 5 smallest of each fraction.
Beta-Conglycinin (7S) Glycinin (11S) 11S/7S
Ratio
Total
7S+11S Locations
Alpha' Alpha Beta Total 7S Acidic Basic Total 11S
Nuporanga 3.98a 6.64abc 7.93a 18.56a 15.34d 14.27b 29.61c 1.59d 48.17ab
Cascavel 4.93a 7.27a 5.95b 18.16ab 19.23ab 17.86ab 37.09ab 2.04bc 55.25ab
Mandaguaçu 4.73a 7.03ab 5.80b 17.58abc 18.67abc 18.36ab 37.03ab 2.10abc 54.61ab
Luiziana 4.45a 7.01ab 5.69bc 17.16abc 16.84bcd 15.91ab 32.75abc 1.90c 49.90ab
Pirassununga 4.44a 6.65abc 5.99b 17.09abc 20.39a 19.38a 39.78a 2.33a 56.86a
Ponta Grossa 4.37a 6.39abc 5.25bcd 16.02abc 17.90abcd 16.70ab 34.60abc 2.16abc 50.62ab
Guaíra 4.00a 6.21abc 4.73bcd 14.94abc 18.27abc 17.04ab 35.31abc 2.36a 50.25ab
Ibirarema 4.19a 6.00abc 4.58def 14.77abc 16.40bcd 15.67ab 32.07bc 2.17abc 46.84ab
Morro Agudo 3.54a 5.70c 5.36bcd 14.61abc 17.30bcd 15.96ab 33.25abc 2.27ab 47.86ab
Cambará 4.08a 6.02abc 4.16ef 14.27bc 17.02bcd 15.04ab 32.07bc 2.24ab 46.34ab
Pedrinhas 3.69a 5.55c 4.43def 13.69c 16.80bcd 15.34ab 32.15bc 2.35a 45.83b
Londrina 4.05a 5.92bc 3.59f 13.58c 16.29cd 15.02ab 31.31bc 2.30ab 44.89b
Table 3. Glycinin and beta-conglycinin protein fraction composition (%), in seeds of soybean cultivar IAS 5, sown in 12 different locations of Paraná and São Paulo states(1).
affected concentrations of these compounds. High differences for 11S fractions were also observed in Cascavel, Mandaguaçu, Ponta Grossa and Guaíra. In 12 locations in the Southern region of Brazil, the range for 11S/7S ratio was 2.36 to 1.59, which was similar to findings of Fehr et al. (2003), who reported differences among year-location combinations.
Data of individual beta‑conglycinin subunits
(Table 3) confirm the inverse relationship of 11S/7S
ratio and total 7S protein fraction. Nuporanga
presented the highest values for beta subunit
and total beta‑conglycinin (7S), while Londrina
presented the smallest concentrations for the same subunits. In Pirassununga, the cultivar IAS 5 presented the highest concentration of the acidic and
basic subunits of glycinin. Larger concentrations
of individual subunits for both beta-conglycinin (7S) and glycinin (11S) were observed in Cascavel (Table 3), but the 11S/7S ratio was smaller (2.04),
as compared to other locations. Londrina presented
low concentrations of acidic and basic subunits of glycinin, and the lowest value for beta-conglycinin subunits, although the 11S/7S ratio was not
the smallest (2.30). Londrina presented low
precipitation (121 mm) during the filling period months (February, March and April) in 2002, while
Nuporanga had good water availability (455 mm)
during the same period (www.agritempo.org.br
– September 2006). Observing data of Londrina and Nuporanga, it appears that beta‑conglycinin
protein fractions may be more susceptible to water stress than glycinin fractions.
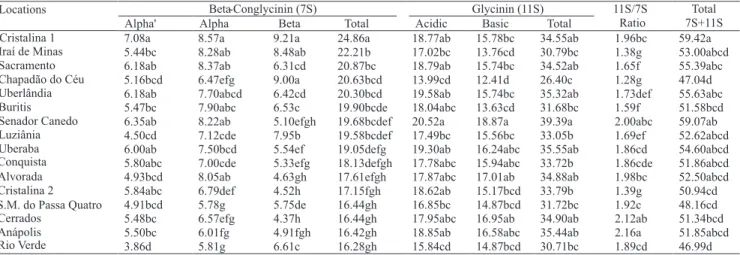
Larger variability for beta‑conglycinin than
for glycinin protein fractions was observed, when cultivar MG/BRS 46 Conquista was sown in 16 locations of Central Brazil (17ºS) (Table 4). Among these locations, total 7S protein fractions ranged from 16.3%, in Rio Verde, to 24.9 % in Cristalina-1, and 11S/7S ratio was 1.89 and 1.96, respectively. Total 11S protein fractions ranged from 26.4%, in Chapadão do Céu, to 39.4%, in Senador Canedo, while 11S/7S ratio for both locations was 1.28 and 2.00, respectively. In Rio Verde, concentrations of both protein fractions, beta-conglicinin and glycinin, were reduced (Table 4). The highest values for glycinin, acidic and basic subunits were observed for sowings in Senador Canedo. The inverse relationship between total 7S and 11S/7S ratio can be observed from data of Anápolis, which exhibited lower concentrations of beta-conglycinin subunits and higher concentrations of glycinin.
Genetic variability was observed among Brazilian soybean cultivars, as well as effects of the environment on total and individual protein fractions and their subunits. However, in the present study, due to lack of specific observations on temperatures, precipitation and light incidence, it was not possible to identify which environmental component had stronger impact on concentration
Beta-Conglycinin (7S) Glycinin (11S)
Alpha' Alpha Beta Total Acidic Basic Total
11S/7S Ratio
Total 7S+11S
7.08a 8.57a 9.21a 24.86a 18.77ab 15.78bc 34.55ab 1.96bc 59.42a
5.44bc 8.28ab 8.48ab 22.21b 17.02bc 13.76cd 30.79bc 1.38g 53.00abcd
6.18ab 8.37ab 6.31cd 20.87bc 18.79ab 15.74bc 34.52ab 1.65f 55.39abc
5.16bcd 6.47efg 9.00a 20.63bcd 13.99cd 12.41d 26.40c 1.28g 47.04d
6.18ab 7.70abcd 6.42cd 20.30bcd 19.58ab 15.74bc 35.32ab 1.73def 55.63abc
5.47bc 7.90abc 6.53c 19.90bcde 18.04abc 13.63cd 31.68bc 1.59f 51.58bcd
6.35ab 8.22ab 5.10efgh 19.68bcdef 20.52a 18.87a 39.39a 2.00abc 59.07ab
4.50cd 7.12cde 7.95b 19.58bcdef 17.49bc 15.56bc 33.05b 1.69ef 52.62abcd
6.00ab 7.50bcd 5.54ef 19.05defg 19.30ab 16.24abc 35.55ab 1.86cd 54.60abcd
5.80abc 7.00cde 5.33efg 18.13defgh 17.78abc 15.94abc 33.72b 1.86cde 51.86abcd
4.93bcd 8.05ab 4.63gh 17.61efgh 17.87abc 17.01ab 34.88ab 1.98bc 52.50abcd
5.84abc 6.79def 4.52h 17.15fgh 18.62ab 15.17bcd 33.79b 1.39g 50.94cd
4.91bcd 5.78g 5.75de 16.44gh 16.85bc 14.87bcd 31.72bc 1.92c 48.16cd
5.48bc 6.57efg 4.37h 16.44gh 17.95abc 16.95ab 34.90ab 2.12ab 51.34bcd
5.50bc 6.01fg 4.91fgh 16.42gh 18.85ab 16.58abc 35.44ab 2.16a 51.85abcd
3.86d 5.81g 6.61c 16.28gh 15.84cd 14.87bcd 30.71bc 1.89cd 46.99d
Locations
Cristalina 1 Iraí de Minas Sacramento Chapadão do Céu Uberlândia Buritis Senador Canedo Luziânia Uberaba Conquista Alvorada Cristalina 2 S.M. do Passa Quatro Cerrados
Anápolis Rio Verde
Table 4. Glycinin and beta-conglycinin protein fraction composition (%), in seeds of soybean cultivar MG/BRS 46 (Conquista), sown in 16 locations of Goiás (GO) and Minas Gerais (MG) states in Central Brazil. Soybean season 2001/2002(1).
of the protein components. Genotype x environment interactions should be considered in future studies.
Conclusions
1. Among Brazilian soybean cultivars, there are genetic differences for contents of 11S (glycinin) and 7S (beta-conglycinin) protein fractions, and there is a good possibility of breeding for individual protein fractions, and their subunits, without affecting protein content.
2. 'MS/BRS 169' (Bacuri) presents the better protein quality with the highest 11S/7S ratio.
3. Sowing locations affect concentration of these compounds.
Acknowledgements
To Emidio Bonato (Embrapa Trigo), Maurício Assunção (Centro Tecnológico para Pesquisas
Agropecuárias), Neylson Eustaquio Arantes
(Embrapa Soja), Orival Gastão Menosso (Embrapa Soja), Plinio Itamar de Mello de Souza (Embrapa Cerrados), Ricardo Montalván (Embrapa Soja, Balsas), and José Marcos Gontijo Mandarino (Embrapa Soja), for providing samples for the
experiments; to Donna Thomas and Richard Hens (United States Department of Agriculture, Agricultural Research Service, National Center for Agricultural Utilization Research), for preparing samples; to Maria Cristina Neves de Oliveira
(Embrapa Soja), for the statistical analysis.
References
BRADFORD, M.M. A rapid and sensitive method for the quantitation of microgram quantities for protein utilizing the principle of protein-dye binding. Analytical Biochemistry, v.72, p.248-254, 1976.
CHUA, N.H. Eletrophoretic analysis of chloroplast proteins.
Methods in Enzymology, v.69, p.434-446, 1980.
DURANTI, M.; LOVATI, M.R.; DANI, V.; BARBIROLI, A.; SCARAFONI, A.; CASTIGLIONI, S.; PONZONE, C.; MORAZZONI, P. The α’ subunit from soybean 7S globulin lowers plasma lipids and upregulates liver ß‑VLDL receptors in rats fed a hypercholesterolemic diet. Journal of Nutrition, v.134, p.1334-1339, 2004.
FEHR, W.R.; HOECK, J.A.; JOHNSON, S.L.; MURPHY, P.A.; NOTT, J.D.; PADILLA, G.I.; WELKE, G.A. Genotype and environment influence on protein components of soybean. Crop Science, v.43, p.511-514, 2003.
FUKUSHIMA, D. Recent progress in research and technology on soybeans. Food Science and Technology Research, v.7, p.8-16, 2001.
HARADA, K.; TOYOKAWA, Y.; KITAMURA, K. Genetic analysis of the most acidic 11S globulin subunit and related characters in soybean seeds. Japanese Journal of Breeding, v.33, p.23-30, 1983.
HELMS, T.C.; CAI, T.D.; CHANG, K.C.; ENZ, J.W. Tofu characteristics influenced by soybean crop year and location. 1998. Available at: <http://www.ag.ndsu.nodak.edu/ ndagres/fall98/ar31198.htm>. Accessed on: 3 Nov. 2006. JOHNSON, R.A.; WICHERN, D.W. Applied multivariate statistical analysis. 6.ed. New Jersey: Prentice Hall, 2007.
800p.
KITAMURA, K.; KAIZUMA, N. Mutant strains with low level of subunits of 7S globulin in soybean (Glycine max Merr.) seed. Japanese Journal of Breeding, v.31, p.353-359, 1981. KITAMURA, K.; TAKAGI, T.; SHIBASKI, K. Subunit structure of soybean 11S globulin. Agricultural and Biological Chemistry, v.41, p.351-356, 1976.
KWANYUEN, P.; PANTALONE, V.R.; BURTON, J.W.; WILSON, R.F. A new approach to genetic alteration of soybean protein composition and quality. Journal of the American Oil Chemists’ Society, v.74, p.983-987, 1997.
LOVATI, M.R.; MANZONI, C.; GIANAZZA, E.; SIRTORI, C.R. Soybean protein products as regulators of liver low-density lipoprotein receptors. I. Identification of active ß-conglycinin subunits. Journal of Agricultural and Food Chemistry, v.46, p.2474-2480, 1998.
MILLER, I.; HAYNES, P.; GEMEINER, M.; AEBERSOLD, R.; MANZONI, C.; LOVATI, M.R.; VIGNATI, M.; EBERINI, I.; GIANAZZA, E. Proteins of rat serum. II. Influence of some biological parameters of the two-dimensional electrophoresis pattern. Electrophoresis, v.19, p.1493-1500, 1998.
MORAES, R.M.A. de; JOSÉ, I.C.; RAMOS, F.G.; BARROS, E.G. de; MOREIRA, M.A. Caracterização bioquímica de linhagens de soja com alto teor de proteína. Pesquisa Agropecuária Brasileira, v.41, p.725-729, 2006.
MURPHY, P.A.; RESSURECCION, A.P. Varietal and environmental differences in soybean glycinin and β‑conglycinin content. Journal of Agricultural and Food Chemistry, v.32, p.911-915, 1984.
OGAWA, T.; TAYAMA, E.; KITAMURA, K.; KAIZUMA, N. Genetic improvement of seed storage proteins using three variant alleles of 7S globulin subunits in soybean (Glycine max L.). Japanese Journal of Breeding, v.39, p.137-147, 1989.
SAIO, K.; KAMIYA, M.; WATANABE, T. Food processing characteristics of soybean 11S and 7S proteins. Part I. Effect of difference of protein component among soybean varieties on formation of tofu-curd. Agricultural and Biological Chemistry, v.33, p.1301-1308, 1969.
STASWICK, P.E.; HERMODSON, M.A.; NIELSEN, N.C. The amino acid sequence of the A2B1a subunit of glycinin. Journal of Biological Chemistry, v.259, p.13424-13430, 1984. TAKAHASHI, M.; HAJIKA, M.; MATSUNAGA, R.; KOMATSU, K.; OBATA, A.; KANAGAE, R. Breeding soybean variety lacking β‑conglycinin by introduction of Scg gene from wild soybean. In: INTERNATIONAL SOYBEAN PROCESSING AND UTILIZATION CONFERENCE, 3., 2000, Tsukuba. Proceedings. Tsukuba: The Japanese Society for Food Science and Technology, 2000. p.45-46
TCHIENKOUA, M.; ZECH, W. Statistical analysis of soil variability in a humid forest landscape of Central Cameroon. International Journal of Applied Earth Observation and Geoinformation, v.5, p.69-79, 2004.
THANH, V.H.; SHIBASAKI, K. Beta‑conglycinin from soybean proteins. Isolation and immunological and physicochemical properties of the monomeric forms. Biochimica et Biophysica Acta, v.490, p.370-384, 1977.
TSUKADA, Y.; KITAMURA, K.; HARADA, K.; KAIZUMA, N. Genetic analysis of subunits of two major storage proteins (β‑conglycinin and glycinin) in soybean seed.Japanese Journal of Breeding, v.36, p.390-400, 1986.
USFDA. Food and Drug Administration. Food labeling, health claims, soy protein and coronary heart disease; final rule. Federer Register, v.64, p.57700-57733, 1999.
UTSUMI, S.; MATSUMURA, Y.; MORI, T. Structure‑function relationship of soy proteins. In: DAMODARAM, S.; PARAF, A. (Ed.). Food proteins and their applications. New York: Marcel
Dekker, 1997. p.257‑291.
YAKLICH, R.W. β‑conglycinin and glycinin in high protein soybean seeds. Journal of Agricultural and Food Chemistry, v.49, p.729-735, 2001.
YAMAUCHI, F.; SATO, M.; SATO, W.; KAMATA, Y.; SHIBASAKI, K. Isolation and identification of a new type of β‑conglycinin in soybean globulins. Agricultural and Biological Chemistry, v.45, p.2863-2868, 1981.