Vol.53, n. 3: pp.519-531, May-June 2010
ISSN 1516-8913 Printed in Brazil BRAZILIAN ARCHIVES OF
BIOLOGY AND TECHNOLOGY
A N I N T E R N A T I O N A L J O U R N A L
Genetic Diversity among Brazilian Soybean Cultivars Based
on SSR Loci and Pedigree Data
Regina Helena Geribello Priolli
1*, José Baldin Pinheiro
1, Maria Imaculada Zucchi
2, Miklos
Maximiliano Bajay
2and Natal Antonio Vello
11Departamento de Genética; Escola Superior de Agricultura “Luiz de Queiroz”; Universidade de São Paulo; Av.
Pádua Dias, 11 C.P: 83; 13400-970; Piracicaba - SP - Brasil. 2Centro de Pesquisa e Desenvolvimento de Recursos
Genéticos Vegetais; Instituto Agronômico de Campinas; Av. Theodoreto de Almeida Camargo, 1500; C.P.: 28, 13001-970; Campinas - SP - Brasil
ABSTRACT
In this study, simple sequence repeats (SSR) loci and pedigree data were used to investigate the genetic relationship in a group of 168 Brazilian soybean cultivars. Eighteen SSR loci produced an average of 5.06 alleles and a mean gene diversity of 0.58 for the cultivars studied. Genetic distance (GD) was determined using the modified Roger’s Wright distance, and a final dendrogram was in agreement with the cultivar pedigree. A distance matrix based on the coefficient of parentage scores was also generated for the cultivars, which ranged from 0 to 1, with a mean of 0.18, whereas SSR-based genetic similarity (1- GD) ranged from 0.01 to 0.90, with a mean of 0.25. Mantel’s Z test showed that the similarity matrices generated from both the data sets were low, but significantly correlated (r = 0.31, p<0.001). The results showed that SSR data and pedigree analyses could help to quantify more accurately the degree of relationship among the soybean cultivars.
Key words: Coefficient of parentage, Glycine max (L.) Merr., microsatellite markers
* Author for correspondence: [email protected]
INTRODUCTION
Soybean, Glycine max (L.) Merrill is one of the most important crop species worldwide and it has been the subject of intensive breeding. One of the pre-requirements for successful breeding strategies is the complete understanding of the genetic diversity of the crop plant. Several methods have been used to investigate the genetic variation in soybean. Morphological and agronomic traits have been employed (Perry and McIntosh, 1991; Sneller et al., 1997). Although the evaluation based on these data are essential for applied soybean breeding, genotype x environment interactions greatly limit the soybean lines that can be directly
compared based on agronomic and morphological data.
DNA marker analyses are an alternative method to estimate the diversity of soybean in breeding programs, especially when the details of pedigree information are lacking. These markers include
SSR, RFLP (restriction fragment length
polymorphism), AFLP (amplified fragment lenght polymorphism) and RAPD (random amplified polymorphic DNA) markers (Akkaya et al., 1992; Keim et al., 1992; Maugham et al., 1996; Li and Nelson, 2001). Each strategy is based on different principles to detect the variation and they present distinct advantages and limitations in terms of costs, time consumption, accuracy and efficiency. Microsatellites or simple sequence repeat (SSR) markers have been especially valuable to estimate genetic diversity in soybean due to their abundance, the high level of polymorphism, the
codominant characteristic, PCR based detection
and the fact that they have known positions in the genome. Furthermore, the use of fluorescence labeled primers and DNA sequencers make it possible to accurately identify and easily score alleles at a number of loci at once. In soybean, high levels of polymorphism at SSRs have been reported for the number of alleles per locus and gene diversity (Akkaya et al., 1992; Narvel et al., 2000; Priolli et al., 2002; Hudcovicová and Kraikl, 2003). It was also found that RFLPs, AFLPs and SSRs in soybean were highly correlated, while SSRs generated hypervariable polymorphisms (Rongwen et al., 1995).
The estimation of relationships among the soybean accessions using both the molecular markers and COPs has been tested to predict the progeny variance and to study the heterosis (Helms et al., 1997, Manjarrez-Sandoval et al., 1997). In soybean, high heterosis values were estimated for seed yield and their components (Pandini et al.,
2002), but commercial F1 hybrids were not
economically practicable. The association between the COP and molecular markers (RFLP and AFLP markers) has been shown to be statistically significant; however, the correlations were demonstrated to range from low (Bonato et al.,
2006) to moderate (Kisha et al., 1998).
In order to evaluate whether SSRs and COP determined similar genetic relationship estimates, the present study considered: (1) assess the genetic diversity among a group of Brazilian soybean cultivars using SSR markers; and to (2) determine the correlation between estimates of genetic diversity measured by COP and SSR markers.
MATERIALS AND METHODS
A group of 168 soybean elite cultivars, developed and released by Brazilian public and private institutions, was selected to represent the range of cultivars grown in Brazil. The pedigree and seeds of each cultivar were obtained according to Priolli et al., (2002). Thirty to fifty plants of each soybean cultivar were grown in a greenhouse for DNA isolation. The equivalent of 30 leaves of tissue samples were collected from each cultivar, frozen in liquid nitrogen and lyophilized for 1-2 days. DNA was isolated from the bulked lyophilized leaf tissue of the plants of each cultivar by a mini-prep procedure based on Doyle and Doyle (1990). The DNA concentration was estimated by comparison to known concentrations of lambda phage DNA on 0.8% agarose gel.
Eighteen SSR loci with either di-or tri-nucleotide repeats were selected for this study. They were chosen for their distribution across the soybean genome and amplification quality. All the SSR primer sequences, except for the RGA loci shown below, have been published previously (Morgante
and Olivieri, 1994; Cregan et al., 1999). The
sequence of RGA primers is: F:
5’TTGGCAAAGGGAGAAGAGAA3’ and R: 5’TCTGAATGGCCTTCTTGACC3’.
Fluorescent labeling of the alleles with the universal tail primers was used (Missiaggia and Grattapaglia, 2006). The PCR reaction was prepared in 20- L total volume mix, containing 1X PCR buffer (10 mM Tris-HCl, pH 8.9, 50 mM
KCl), 3.0 mM MgCl2, 0.2 M dNTP, 1.0 U Taq
gels for 2.5 hours using ABI377 DNA sequencer (Applied Biosystems). Data were collected
automatically by detecting the distinct
fluorescence and analyzed by
GeneScan/Genotyper softwares (Applied
Biosystems). The amplified fragments produced by SSR were considered as alleles of a single locus. Genetic diversity of each SSR loci was calculated according to Weir (1990).
The analyses of diversity among the cultivars were based on a modified Roger’s distance method using TFPGA software, version 1.3 (Miller 1997). The consensus UPGMA (unweighted pair-group method with arithmetic averages) dendrogram was obtained using NTSYS-PC software, version 2.01 (Rohlf 2000). A bootstrap procedure with 1,000 units of re-sampling was carried out for SSR data using BOOD software (Coelho 2000).
The values of the coefficient of parentage (COP) were obtained for pair-wise combinations of two genotypes and corresponded to the probability of an allele in a given locus to be identical by descent to alleles in the same locus from another cultivar (Kempthorne 1957). The coefficient of parentage was calculated using the procedure ‘proc inbreed’ of the SAS software, version 8. Using the assumptions suggested by Cox et al., (1985), COP was considered to range from 0 (cultivars with completely different pedigrees) to 1 (cultivars with the same genetic constitution). For two genotypes related by three or more generations of backcrossing, the coefficient was assumed to be 1. The matrix of genetic distance obtained from the SSR data was converted into a genetic similarity matrix (1- modified Roger’s distance). The genetic similarity matrices obtained from the SSR and coefficient of parentage data were compared by measuring the degree of correlation (r) between
them by computing the product-moment
correlation and by the Mantel test statistic (Z) using NTSYS-PC software, version 2.1 (Rohlf 2000). The comparisons were carried out to verify whether genetic similarities generated by the SSR and COP data provided similar genetic measures.
RESULTS
The investigated 18 SSR loci were polymorphic, as shown in Table 1. The number of alleles per locus ranged from two to eight, with an average of 5.06 alleles per locus distributed in a total of 91 alleles. The genetic diversity (GD), indicative of the effectiveness of SSR loci information, showed broad amplitude, ranging from 0.070 to 0.826, with 0.58 ± 0.20 mean value. However, except for the aforementioned two loci, the majority of values exhibited moderate (0.431 for locus Satt102) to high (0.826 for locus Satt308) ranges. A comparison between the similarity coefficients calculated using COP and SSR marker data is presented in Fig. 1. The distribution of values for
both the methods was slightly different.
Genealogical similarities covered a greater range (0 to 1) - average 0.18 - in 168 pair-wise cultivar comparisons. However, distribution was skewed towards lower values (89% of the similarity values from 0.01 to 0.30), and sister lines with a COP value of one were shown by SSR data to be not completely similar. The SSR genetic similarity covered a lower range, from 0.01 to 0.90, although skewed towards higher values (91% of the SSR value from 0.11 to 0.40), average 0.25 in 168 pair-wise cultivar comparison. These data suggested that SSR markers were more effective to differentiate the pairs of accessions with lower levels of genetic variation. It was possible to differentiate the totality of the investigated cultivars with SSR markers, even those with the highest identity values from the genealogy analyses.
The correlation (r) between the genetic similarity and the coefficient of parentage was highly significant (p<0.001); however, with low value (r
= 0.31). A dispersion graph (Fig. 2) showed that
the points presented a grouping trend
Table 1 - Polymorphism characterization for 18 SSR loci in 168 Brazilian soybean cultivars.
Locus Allele number Allele size(bp) Genetic diversity
Satt186 8 225,247,250,253,256,258,262,265 0.766
Satt173 8 205,217,220,232,244,250,266,281 0.752
Satt005 8 163,172,175,181,184,187,205,208 0.619
Satt308 7 154,169,172,175,178,190,193 0.826
Satt009 7 178,205,226,229,241,247,262 0.781
Satt154 6 275,281,284,290,293,296 0.697
Sct_189 5 178,181,202,205,211 0.729
Satt263 5 221,227,239,242,251 0.707
SOYHSP176 5 112,224,228,230,234 0.576
Satt406 4 257,263,350,353 0.638
Satt002 4 121,133,142,148 0.586
Satt335 4 150,156,162,168 0.562
Satt045 4 154,160,165,176 0.560
Satt307 4 166,175,181,193 0.512
Satt102 4 152,167,170,176 0.431
Satt309 4 144,147,153,156 0.550
SOYGY2 2 170,174 0.131
RGA 2 184,186 0.070
Total 91 —
Mean 5.06 0.583
Figure 2 - Plot of SSR based genetic similarity and coefficient of parentage for 14,028 pairs of the soybean cultivars.
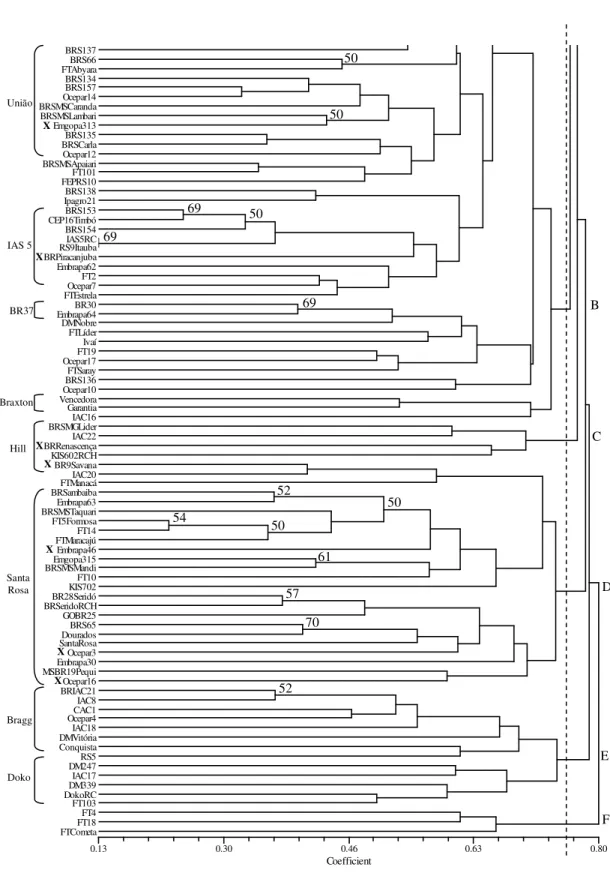
All of the cultivars were able to be uniquely identified by SSR (Figs. 3 and 4). The results also showed that the cultivars were grouped in six closely related clusters, presenting 75% of the
dendrogram distance between each other
represented by the letters A to F. The cultivars EMBRAPA 1 (IAS 5 RC) and RS 9 (Itaúba) had the smallest genetic distance (0.13). These cultivars had a similar genetic origin, where the first resulted from a backcross of ‘IAS 5’ for five generations and, the second, from a cross between ‘FT 2’ and ‘IAS 5’.
Bootstrap results of the molecular analyses showed that SSR data were not robust (22 nodes with significant support; >50%). This observation could be due to the amount of data generated from the SSR data (18 loci, 91 alleles). However, the results were highly coherent in relation to the ancestral descent of the groups, and identified groups with variable degrees of parentage. For instance, the cultivars BRSMA Sambaíba, BR28 Seridó, Dourados, FT 5 Formosa, and almost all cultivars in the group named as “D”, were in the same group as the Santa Rosa cultivar. Furthermore, all of them were either descended from “Santa Rosa” or from a selection of it. For
Figure 3 - Part I of dendrogram of 168 soybean cultivars revealed by UPGMA cluster analysis of 18 SSR loci based on a modified Roger’s Wright distance. All bootstrap values of 1,000 replicates are shown at the corresponding knots. The brackets on the right indicate the common parent identified in a cluster. X marks refer to cultivars present in a cluster not corresponding to their common parent.
Coefficient
0.13 0.30 0.46 0.63 0.80
Bossier CamposGerais BRSMilena FT11 FT102 UFV5 BRSMSBacuri BRSGOCatalao Emgopa303 BRSMAPati Emgopa306 Emgopa308 UFV19 BRSMSSurubi UFV18 IAC14 BRSMSTuiuiu RB502 BRSMTCrixás BR50Parecis FTBahia FTCristalina BR51Xingu BR53Tucano BRSGOGoiatuba Emgopa305 BRS132 BRSegurança FT6Veneza BRS156 BRPiraputanga Ocepar5 DMSoberana KIS601 BRSCeleste FTIramaia GarimpoRCH BRSMAParnaiba Embrapa9Bays FT20 IAC11 FTGuaira UFV10 BRS155 CEP20Guajuvira IAC15 Embrapa48 Invicta Ocepar2 BRSMGVirtuosa FTEureka Parana IAC13 Ocepar8 KIS801 UFVITM1 Emgopa304 IAC12 IAC100 Emgopa316 BR4 BR4RC IAC4 Emgopa301 RB603 COBB FT8 IAS4 FT7Tarobá RB604 FTCanarana FT9 FTSeriema BR6NovaBragg Bragg BR36 CEP12Cambará MSBR34 BRSMSPiapara BR16 Embrapa47 Planalto BR38 Confiança
73
50 55
71
54
50
70
88
A
UFV1
Hardee
Cristalina
Santa Rosa
Lancer
D49-2491
Davis
Hill
Coker Hampton
Paraná
BR4
IAC4
Cobb
Bragg
BR16
União
X X
X
.
Figure 4 – Part II of dendrogram of 168 soybean cultivars revealed by UPGMA cluster analysis of 18 SSR loci based on a modified Roger’s Wright distance. All bootstrap values of 1,000 replicates are shown at the corresponding knots. The brackets on the right indicate the common parent identified in a cluster. X marks refer to cultivars present in a cluster not corresponding to their common parent.
Coefficient
0.13 0.30 0.46 0.63 0.80
BRS137
BRS66 FTAbyara BRS134 BRS157 Ocepar14 BRSMSCaranda BRSMSLambari Emgopa313 BRS135 BRSCarla Ocepar12 BRSMSApaiari FT101 FEPRS10 BRS138 Ipagro21 BRS153 CEP16Timbó BRS154 IAS5RC RS9Itauba BRPiracanjuba Embrapa62 FT2 Ocepar7 FTEstrela BR30 Embrapa64 DMNobre FTLíder Ivaí FT19 Ocepar17 FTSaray BRS136 Ocepar10 Vencedora Garantia IAC16 BRSMGLider IAC22 BRRenascença KIS602RCH BR9Savana IAC20 FTManacá BRSambaiba Embrapa63 BRSMSTaquari FT5Formosa FT14 FTMaracajú Embrapa46 Emgopa315 BRSMSMandi FT10 KIS702 BR28Seridó BRSeridoRCH GOBR25 BRS65 Dourados SantaRosa Ocepar3 Embrapa30 MSBR19Pequi Ocepar16 BRIAC21 IAC8 CAC1 Ocepar4 IAC18 DMVitória Conquista RS5 DM247 IAC17 DM339 DokoRC FT103 FT4 FT18 FTCometa
50
50
69 50
69
69
52 54
50
50
61
57 70
52
União
IAS 5
BR37
Braxton
Hill
Santa Rosa
Bragg
Doko
F E D C B
X X X X
X
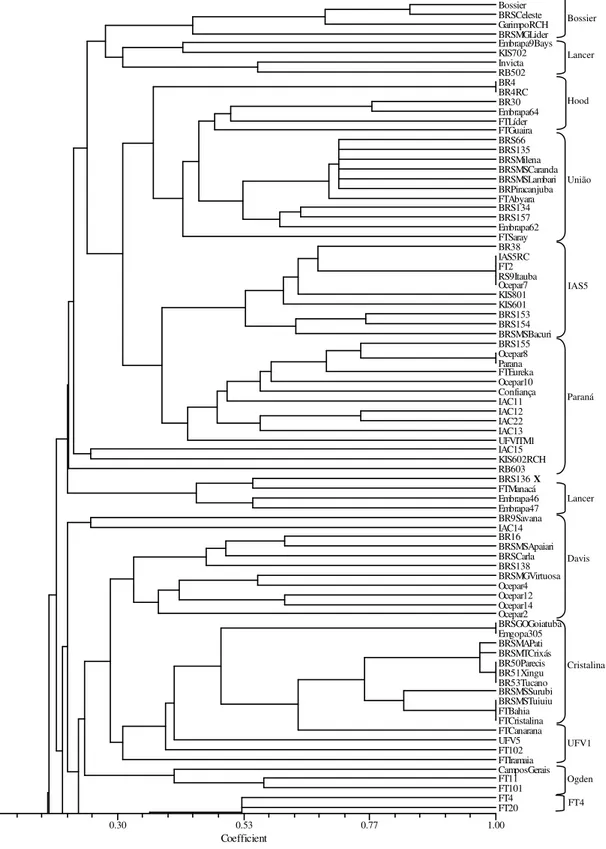
Figure 5 - Part I of dendrogram of 168 soybean cultivars revealed by UPGMA cluster analysis of the coefficient of parentage. The brackets on the right indicate the common parent identified in a cluster. X marks refer to cultivars present in a cluster not corresponding to their common parent.
Coefficient
0.07 0.30 0.53 0.77 1.00
Bossier BRSCeleste GarimpoRCH BRSMGLider Embrapa9Bays KIS702 Invicta RB502 BR4 BR4RC BR30 Embrapa64 FTLíder FTGuaira BRS66 BRS135 BRSMilena BRSMSCaranda BRSMSLambari BRPiracanjuba FTAbyara BRS134 BRS157 Embrapa62 FTSaray BR38 IAS5RC FT2 RS9Itauba Ocepar7 KIS801 KIS601 BRS153 BRS154 BRSMSBacuri BRS155 Ocepar8 Parana FTEureka Ocepar10 Confiança IAC11 IAC12 IAC22 IAC13 UFVITM1 IAC15 KIS602RCH RB603 BRS136 FTManacá Embrapa46 Embrapa47 BR9Savana IAC14 BR16 BRSMSApaiari BRSCarla BRS138 BRSMGVirtuosa Ocepar4 Ocepar12 Ocepar14 Ocepar2 BRSGOGoiatuba Emgopa305 BRSMAPati BRSMTCrixás BR50Parecis BR51Xingu BR53Tucano BRSMSSurubi BRSMSTuiuiu FTBahia FTCristalina FTCanarana UFV5 FT102 FTIramaia CamposGerais FT11 FT101 FT4 FT20
Bossier
Lancer
Hood
União
IAS5
Paraná
X
Lancer
Davis
Cristalina
UFV1
Ogden
Figure 6 - Part II of dendrogram of 168 soybean cultivars revealed by UPGMA cluster analysis of the coefficient of parentage. The brackets on the right indicate the common parent identified in a cluster. X marks refer to cultivars present in a cluster not corresponding to their common parent.
Coefficient
0.07 0.30 0.53 0.77 1.00
FT9 FT7Tarobá MSBR34 BRSMAParnaiba DMSoberana FTEstrela FTSeriema BR6NovaBragg Bragg Garantia BRSMSPiapara CEP12Cambará Vencedora BRIAC21 CAC1 IAC8 DMVitória UFV18 UFV19 IAC17 IAC18 BRRenascença CEP20Guajuvira BRPiraputanga DM247 DM339 DokoRC FT103 DMNobre BR28Seridó BRSeridoRCH UFV10 BRS65 BRS137 Dourados SantaRosa BRSMSMandi Embrapa63 Emgopa315 BRSambaiba FT5Formosa FT10 FTMaracajú BRSMSTaquari FT14 FT6Veneza FT18 FT19 BRSegurança Embrapa30 BRS156 Emgopa313 CEP16Timbó RS5 BRSGOCatalao Emgopa301 Emgopa306 Emgopa308 IAC4 Emgopa303 MSBR19Pequi GOBR25 BR36 IAS4 Embrapa48 Ivaí COBB FT8 Planalto FEPRS10 Ocepar3 Ocepar16 Ocepar17 BRS132 Ipagro21 Ocepar5 IAC100 Conquista Emgopa304 RB604 IAC20 Emgopa316 FTCometa IAC16
FT4
D49- 2491
Bragg
Doko
Santa Rosa
Pérola
Hardee
IAS4
Cobb
Ocepar3
Emgopa 302
X
DISCUSSION
Polymorphism and gene diversity for the majority of the SSR loci in this study were consistent with previous studies of soybean elite cultivars (Akkaya et al., 1992; Diwan and Cregan; 1997; Song et al., 1999; Narvel et al., 2000; Priolli et al., 2002; Hudcovicová and Kraikl, 2003); however, the loci SOYGY2 and RGA presented only two alleles and low gene diversity (Table1). One possible reason for the reduced variability observed was that the loci were either associated with DNA sequences coding for proteins or were derived from the expressed sequence tag simple sequence repeats (EST-SSR) obtained from the sequencing of partial complementary DNA (cDNA). Markers derived from genomic libraries also contained more repeat units as well as a greater range of allele sizes and genetic diversity than markers isolated from EST libraries. The difference in polymorphism between the soybean SSRs derived from the two sources was consistent with the differences reported in rice (Cho et al., 2000), sugarcane (Cordeiro et al., 2001), tomato (Arshchenkova and Ganal, 2002), wheat (Eujayl et al., 2002), and barley (Thiel et al., 2003).
In soybean mapping populations, 133 EST-SSR loci were characterized but only 18% were polymorphic. Alternatively, studying 1,002 SSR loci derived from genomic libraries, 43% primer sets were polymorphic among parental genotypes (Song et al., 2004).
Based on the results of this study, 18 microsatellite loci did not produce scorable bands (91) to detect the genetic relationships with strong bootstrap support among soybean cultivars (only 22 of 154 nodes at a bootstrap level of 50% confidence). The low level of bootstrap support for SSR data indicated that a higher number of loci were required to generate robust relationships. The number of SSR loci necessary to generate sufficient SSR data to accurately detect the genetic relationships remained unclear. Some studies have indicated that a relatively small number of SSRs was sufficient to obtained high resolution estimates of relatedness in soybean (Powell et al., 1996). However, some others have demonstrated that reliable estimates involving many individuals could require the screening of several hundred loci (Zhivotovsky and Feldman, 1995).
The similarity coefficients obtained by the SSR analyses in the present study (average of 0.25), although higher than the COP values (average of
0.18), were smaller than those obtained in previous studies using other molecular markers. Therefore, it suggested that the SSR markers were highly effective in distinguishing the genetic material with a narrow genetic base, such as the Brazilian soybean germplasm. The average similarity coefficient was 0.82 for 38 soybean cultivars using RAPD markers (Abdelnoor et al., 1995), and 0.61 in 317 soybean cultivars using AFLP markers (Bonato et al., 2006). The higher effectiveness of SSR markers in distinguishing closely related soybean cultivars has already been shown in a previous study. Twelve SSR loci were able to distinguish morphologically similar groups of 186 soybean cultivars, presenting a mean similarity coefficient of 0.46 (Priolli et al., 2002).
A significant correlation (p<0.001) with low value
was observed (r = 0.31) between the
measurements of the SSR-based genetic similarity and COP. These results were expected since SSR markers identify alleles that were different in state and they reflected the evolution of neutral alleles in the absence of selective pressure. COP estimates the amount of alleles that are identical by descent from common ancestors selected in breeding programs. In germplasm with a restricted genetic base, such as the Brazilian soybean germplasm, the divergence among parents is obtained by their pedigree analyses and on many occasions is a prior requirement in cultivar development.
Similar results of correlation have been
demonstrated by several studies with other markers. The comparison of RFLP-based genetic similarity with COP estimates for a set of barley
cultivars showed low correlation (r = 0.21) for the
winter type (Graner et al., 1994). The correlation between isozyme-based genetic similarity and COP estimates for wheat cultivars also showed a low value (r = 0.27) (Cox et al., 1985). Lower
values (r = 0.12) were found in soybean by
comparing estimates of the genetic similarity based on AFLP markers and COP (Bonato et al.,
2006). Moderate correlation (r = 0.61) was
observed in maize, with r = 0.55 (Plaschke et al., 1995) and in sugarcane, where r = 0.42 (Lima et al., 2002).
The dispersion graph, obtained by analyzing the correlation between the SSR-based genetic similarity and COP estimates for all the investigated genotypes, showed a clustering trend according to a regression line (Fig. 2). However, the genotypes that presented the highest values were the ones located furthest from the regression line. Thirty-one soybean cultivars with values COP=1 and genetic similarity of approximately 0, belonged to this category. The group also consisted of cultivars whose genetic similarity values based on SSR markers were high, but
pedigree information showed very distant
relationship (COP = 0 or close to 0). The results
suggested that cultivar pedigree-derived
information was not always accurate and that the association with molecular data could provide more precise information to soybean breeding programs.
Dendrograms generated by different methods (SSRs and COPs) were partially coincident. Both the methods successfully distinguished similar groups and the variation at SSR loci was in agreement with the cultivar pedigree information. EMBRAPA 1 (IAS 5 RC) and RS 9 (Itaúba) cultivars, which had the smallest genetic distance, could not be distinguished by 12 SSR loci (Priolli et al., 2002) and presented the maximum
relatedness coefficient (COP=1). Moreover,
several cultivars clustered very closely, thus demonstrating the narrow genetic basis of the gene pool from Brazilian soybean germplasm. It was estimated in the 1980s that approximately 70% of the cultivars developed for the Southern regions of Brazil were descendents from the cultivars ‘Hill’, ‘Hood’ or both (Bonetti 1983). The recommended cultivars for the aforementioned growing season were descendants from 26 cultivars and from that total, only four were responsible for approximately half of the gene pool (Hiromoto and Vello, 1986). The narrow genetic basis of the Brazilian gene pool could also be observed by the COP values. In 69 soybean cultivars, a mean COP value of 0.16 was estimated (Vello et al., 1988). Similar COP values of 0.21 were obtained in larger samples of 100 and 90 soybean cultivars by Bonato et al., (2006) and Miranda et al., (2007), respectively. Actually, the parental selection of elite cultivars based on COP estimates was the first procedure for the enhancement of the genetic basis of
cultivated germplasm. Furthermore, the soybean type used in oriental countries for human consumption, for example, vegetable soybean or edaname (Yokomizo and Vello, 2003) also could be selected as parents in breeding type soybean, since the genetic flux has been restricted between both the soybean types.
It could be concluded that the COP provided a good estimation of genetic diversity when the complete pedigree was known and SSR markers also provided a good estimation of genetic diversity when sufficient numbers were used. Despite the low correlation between both the estimates, that, as mentioned above, presented closely related formation of clusters, it could be suggested that the use of these SSR loci associated to pedigree information would allow the breeders to make reliable crossings or to strategically plan the breeding program.
ACKNOWLEDGEMENTS
The authors thank The State of São Paulo Research Foundation (FAPESP) for financial support for this study. R.H.G.P received post-doctorate fellowship from FAPESP. N.A.V. and J.B.P. are recipients of research fellowships from National Council for Scientific and Technological Development (CNPq).
RESUMO
Locos microssatélites e dados de genealogia foram utilizados para avaliar a diversidade genética de um grupo de 168 cultivares brasileiras de soja. Os dezoito locos utilizados apresentaram em média 5,06 alelos por loco e coeficiente de diversidade genética médio de 0,58. O dendrograma final
resultante da matriz de
distância genética de
microssatélites aliados às informações de genealogia proporcionam melhor análise da diversidade genética de cultivares de soja.
REFERENCES
Abdelnoor, R.V., Barros, E.G., Moreira, M.A. (1995), Determination of diversity within Brazilian soybean germplasm using random amplified polymorphic DNA techniques and comparative analysis with pedigree data. Braz J Genet., 18, 265-273.
Akkaya, M.G., Bhawat, A., Cregan, P.B. (1992), Lenght polymorphisms of simple sequence repeat DNA in soybean. Genetics., 132, 1131-1139.
Bonato, A.L.V., Calvo, E.S., Geraldi, I.O., Arias, C.A.A. (2006), Genetic similarity among soybean
(Glycine max (L) Merrill) cultivars released in Brazil
using AFLP markers. Genet Mol Biol., 29, 692-704. Bonetti, L.P. (1983), Cultivares e seu melhoramento
genético. In-Soja genética e melhoramento, ed. F.J. Vernetti. Fundação Cargill, Campinas, pp. 741-800. Cho, Y.G., Ishii, T., Temnykh, S., Chen, X., Lipovich,
L., McCouch, S.R., Park, W.D., Ayer, N., Cartinhour, S. (2000), Diversity of microsatellites derived from genomic libraries and GenBank sequences in rice
(Oryza sativa). Theor Appl Genet., 100, 713–722.
Coelho, A.S.G. (2000), BOOD: avaliação de dendrogramas baseados em estimativas de distâncias/similaridades genéticas através do procedimento de bootstrap UFG, Goiânia.
Cordeiro, G.M., Casu, R., McIntyre, C.L., Manners, J.M., Henry, R.J. (2001), Microsatellite markers from sugarcane (Saccharum spp.) ESTs cross transferable to erianthus and sorghum. Plant Sci., 160, 1115-1123. Cregan, P.B., Jarvik, T., Bush, A.L., Shoemaker, R.C., Lark, K.G., Kahler, A.L., Kaya, N., Van Toai, T.T., Lohnes, D.G., Chung, J., Specht, J.E. (1999), An integrated genetic linkage map of the soybean genome. Crop Sci., 39, 1464-1490.
Cox, T.S., Kiang, Y.T., Gorman, M.B., Rogers, D.M. (1985), Relationships between coefficient of parentage and genetic similarity indices in the soybean. Crop Sci., 25, 529–532.
Cox, T.S., Lookhart, G.L., Walker, D.E., Harrell, L.G., Albers, L.D., Rogers, D.M. (1985), Genetic relationships among hard red winter wheat cultivars as evaluated by pedigree analysis and gliadin polyacrylamide gel-electrophoretic patterns. Crop Sci., 25, 1058–1063.
Diwan, N., Cregan, P.B. (1997), Automated sizing of fluorescent-labeled simple sequence repeat (SSR) markers to assay genetic variation in soybean. Theor
Appl Genet., 95, 723-733.
Doyle, J.J., Doyle, J.L. (1990), Isolation of plant DNA from fresh tissue. BRL Focus., 12, 13-15.
Eujayl, I., Sorrells, M.E., Baum, M., Wolters, P., Powell, W. (2002), Isolation of EST-derived microsatellite markers for genotyping the A and B genomes of wheat. Theor Appl Genet., 104, 399–407. Gizlice, Z., Carter, T.E., Burton, J.W. (1996), Genetic
diversity patterns in North American public soybean cultivars based on coefficient of parentage. Crop Sci.,
36, 753-765.
Graner, A., Ludwig, W.F., Melchinger, A.E. (1994), Relationships among European barley germplasm. II. Comparisons of RFLP and pedigree data. Crop Sci.,
34, 1199–1205.
Helms, T., Orf, J., Vallad, G., McClean, P. (1997), Genetic variance, coefficient of parentage, and genetic distance of six soybean populations. Theor
Appl Genet., 94, 20-26.
Hiromoto, D.M., Vello, N.A. (1986), The genetic base of Brazilian soybean cultivars. Braz J Genet., 9, 295-306.
Hudcovicová, M., Kraic, J. (2003), Utilisation of SSRs for characterisation of the soybean (Glycine max (L.) Merr.) genetic resources. Czech J Plant Breed., 39, 120-126.
Keim, P., Beavis, W., Schupp, J., Freestone, R. (1992), Evaluation of soybean RFLP marker diversity in adapted germplasm. Theor Appl Genet., 85:205–212. Kempthorne, O. (1957), An introduction to genetic
statistics. John Wiley and Sons, New York.
Kisha, T.J., Diersm B.W., Hoyt, J.M., Sneller, C.H., (1998), Genetic diversity among soybean plant introductions and North American germplasm. Crop Sci., 38, 1669-1680.
Li, Z., Nelson, R.L. (2001), Genetic diversity among soybean accessions from three countries measured by RAPDs. Crop Sci., 41, 1337-1341.
Lima, M.A.L., Garcia, A.A.F., Oliveira, K.M., Matsuoka, S., Arizono, H., Souza Jr, C.L., Souza, A.P. (2002), Analysis of genetic similarity detected by AFLP and coefficient of parentage among genotypes of sugar cane (Saccharum spp.). Theor
Appl Genet., 104, 30–38.
Manjarrez-Sandoval, P., Carter Jr, T.E., Webb, D.M., Burton, J.W. (1997), RFLP Genetic similarity estimates and coefficient of parentage as genetic variance predictors for soybean yield. Crop Sci., 37, 698-703.
Miller, M.P. (1997), TFPGA (Tools for population genetic analyses) version 1.3 distributed by the author, Northern Arizona University, Flagstaff, Arizona.
Miranda, Z.F.S., Arias, C.A.A., Prete, C.E.C., Kiihl, R.A.S., Almeida, L.A., Toledo, J.F.F., Destro, D. (2007), Genetic characterization of ninety elite soybean cultivars using coefficient of parentage. Pesq
Agropec Bras., 42, 363-369.
Morgante, M., Olivieri, A.M. (1994), Genetic mapping and variability of seven soybean simple sequence repeat loci. Genome., 37, 763-769.
Narvel, J.M., Fehr, W.R., Chu, W.S., Grant, D., Shoemaker, R.C. (2000), Simple sequence repeat diversity among soybean plant introductions and elite genotypes. Crop Sci., 40, 1452- 1458.
Pandini, F., Vello, N.A., Lopes, A.C.A. (2002) Heterosis in soybeans for seed yield components and associated traits. Braz Arch Biol Technol, 45, 401-412.
Perry, M.C., McIntosh, M.S. (1991), Geographical patterns of variation in USDA soybean germplasm collection: I. Morphological traits. Crop Sci., 31, 1350-1355.
Plaschke, J., Ganal, M.W., Roder, M.S. (1995), Detection of genetic diversity in closely related bread wheat using microsatellite markers. Theor Appl
Genet., 91, 1001–1007.
Powell, W., Morgante, M., Andre, C., Hanafey, M., Vogel, J., Tingey, S., Rafalsky, A. (1996), The utility of RFLP, RAPD, AFLP and SSRP (microsatellite) markers for germplasm analysis? Molec Breed.,2, 225-238.
Priolli, R.H.G., Mendes Jr, C.T., Arantes, N.E., Contel, E.P.B. (2002), Characterization of Brazilian soybean cultivars using microsatellite markers. Genet Mol Biol., 25, 185-193.
Rohlf, F.J. (2000), NTSYSpc: Numerical Taxonomy and Multivariate Analysis System, version 2.1. Exeter Software, NY.
Rongwen, J., Akkaya, M.S., Lavi, U., Cregan, P.B. (1995), The use of microsatellite DNA markers for soybean genotype identification. Theor Appl Genet.,
91, 1001–1007.
Sambrook, J., Fritsch, E.F., Maniatis, T. (1989),
Molecular Cloning - A Laboratory Manual. Cold
Spring Habour Laboratory Press, New York
SAS Institute Inc. (2000), SAS OnlineDoc, Version 8. SAS Institute Inc., Cary, NC.
Sneller, C.H., Miles, J.W., Hoyt, J.M. (1997), Agronomic performance of soybean plant introductions and their similarity to elite lines. Crop Sci., 37, 1595-1600.
Song, Q.J., Quigley, C.V., Nelson, R.L., Carter, T.E., Boerma, H.R., Strachan, J.R., Cregan, P.B. (1999), A selected set of trinucleotide simple sequence repeat markers for soybean cultivar identification. Plant Var Seeds., 12, 207-220.
Song, Q.J., Marek, L.F., Shoemaker, R.C., Lark, K.G., Concibido, V.C., Delannay, X., Specht, J.E., Cregan, P.B. (2004), A new integrated genetic linkage map of the soybean. Theor Appl Genet., 109, 122–128. Thiel, T., Michaelek, W., Varshney, R.K., Graner, A.
(2003), Exploiting EST databases for the development and characterization of gene-derived SSR-markers in barley (Hordeum vulgare L.). Theor
Appl Genet., 106, 411–422.
Vello, N.A., Hiromoto, D.M., Azevedo Fº, A.J.B.V. (1988), Coefficient of parentage and breeding of Brazilian soybean germplasm. Rev Bras Genet., 11, 679–697.
Weir, B.S. (1990), Genetic data analysis methods for
discrete genetic data. Sinauer Association,
Sunderland, Massachusetts.
Yokomizo, G.K., Vello, N.A. (2003), Evaluation of the average performance of topcrosses among food and grain type soybean. Braz Arch Biol Technol, 46, 323-332.
Zhivotovsky, L.A., Feldman, M.W. (1995), Microsatellite variability and genetic distances. Proc
Nat Acad Sci of the U.S. of Amer., 92, 11549-11552.