An exhaustive analysis of a minimized emissions scenario for China
A Work Project based on the CEMS MiM Business Project “European, Chinese and US Energy Systems”, under the supervision of Ana Albuquerque
Malte Jan Frits Schulenburg, #1378
Table of content
Diagrams ... 2
Appendices ... 2
List of Abbreviations ... 3
1. Brief context of the Business Project ... 4
1.1. Company ... 4
1.2. Market overview ... 4
1.3. Current client situation ... 4
1.4. The Business Project challenge ... 5
1.5. Summary of main conclusions ... 5
2. Further development of a specific topic ... 6
2.1. What was the original approach to this topic? ... 6
2.2. What are the main limitations of the approach used? ... 6
2.3. What would you have done differently when developing this topic? ... 6
2.3.1. Introduction to a minimized emissions scenario for China ... 7
2.3.2. Economic necessity to reduce greenhouse gas emissions ... 7
2.3.3. Steps to minimize emissions in China ... 8
2.3.4. Sensitivity analysis and comparison with China’s current energy policies ... 10
2.3.5. Conclusion ... 11
3. Reflection on learning ... 12
3.1. Previous knowledge learned from the Masters Program ... 12
3.2. New knowledge ... 12
3.3. Personal experience ... 12
3.3.2. Plan to develop your areas of improvement. ... 13
3.4. What added most value? What should have been done differently? ... 13
List of References ... 14
Diagrams
I Energy Sources as % of Primary Energy Demand (2005 / 2050 comparison) ... 9
II Sensitivity analysis of industrial energy intensity ... 10
III Development of energy consumption from 2005 until 2050 in different scenarios ... 10
IV Comparison of Energy Intensity as % of 2010 Level with CIS and AIS scenario ... 11
Appendices
I EDP 2050 Simulator Variables ... 16II Selected variables for the simulation of a minimized emissions scenario for China ... 17
III Suggested changes to further improve the EDP 2050 Simulator ... 18
IV Primary Energy Consumption in 2012 ... 19
V Correlation between the world's CO2 emissions and primary energy consumption ... 19
VI Development of GHG Emissions in a minimized emissions scenario ... 20
VII Comparison of development of total energy costs ... 20
List of Abbreviations
B: Billion (109)
BECCS: Bio-energy with carbon capture and storage CHP: Combined heat and power
CC: Combined cycle Gas turbine electricity generator CCS: Carbon Dioxide Capture and Storage
CDE: Carbon dioxide equivalent CO2e: Equivalent carbon dioxide CO2: Carbon Dioxide
EIA: Energy Information Administration (USA) ESS: Energy Storage System
GHG: Greenhouse gas
IEA: International Energy Agency (Paris) K: Thousand (kilo) (103)
LNG: Liquefied Natural Gas M: Million (106)
MBD: Million barrels per day
Mtoe: One million tons of oil equivalent PPM: Parts per million
PV: Photovoltaic (solar) Ton: Tons
1.
Brief context of the Business Project
The purpose of this paper is to provide a deeper analysis of a specific topic based on the CEMS MiM Business Project “European, Chinese and US Energy Systems”. The first part of the report presents main information and outcomes of the business projects as the basis for the further developed and detailed analysis in the second part. Last, the third part of this report reflects the learning’s from the Business Project.
1.1. Company
EDP was initially incorporated in 1976 as a public enterprise and is now a limited liability company. Being a vertically integrated utility company with an installed capacity of more than 18,000 Megawatt (MW) for 9.8 million customers in 13 countries, EDP is one of Europe’s biggest players in the energy market. The EDP Group is mainly active in Portugal and Spain, but is becoming an increasingly international energy company with current operations in four continents (EDP, 2014).
1.2. Market overview
While the macroeconomic environment stabilized after volatile years, especially in the Euro zone due to monetary policy adjustments, the energy market is still recognizing a transformational change. The global energy supply and demand respectively, is predicted to grow by over 40% until 2035 (EDP, 2013). Besides this drastic increase, mainly caused by economical catching-up processes in developing countries, the energy market is also facing a tremendous structural change in the production of energy. Although coal and oil will still remain having the highest share in the energy mix, only renewables and natural gas will demonstrate a constant growth on a global level (EDP, 2013).
1.3. Current client situation
Since the acquisition of Horizon Wind Energy from Goldman Sachs in 2004, EDP is one of largest wind power operators worldwide. In 2011, EDP started a co-operation with China Three Gorges (CTG)1 and strengthened its position for renewables in China (EDP, 2013). The acquisition of Horizon as well as the CTG partnership was based on the intentional decision to improve EDP’s position on two major energy markets and strengthen its position as a producer of renewable energy.
1.4. The Business Project challenge
It is in EDP’s vital interest to understand the global energy market and its occurring developments. EDP has its own research laboratories and partnerships with international research institutions to predict developments. For the public, EDP created the EDP 2050
Simulator (Appendix 1) as a simplified and easy accessible, yet highly informative, tool to
simulate the energy markets in Portugal, the United States, China, and Europe. Although the energy market is also subject of short-term fluctuations, it is a market with relatively high term perspectives. This is due to the high capital requirements for investments and long-term supply contracts, as well as the large influence of policies on the market (European Institute of Innovation and Technology, 2014). Security of supply, energy costs and environmental issues are building the triangle of growing global concerns in which EDP has to develop its business. Important trade-offs must be analyzed, understood and quantified. The energy market is influenced by long-term developments and faces an enormous influence by politics. The aim of the related Business Project was to define four policy-based scenario outlooks for 2050 to forecast potential developments.
1.5. Summary of main conclusions
By simulating 12 different scenarios (4 in each of the three analyzed regions – Europe, US, China), many very interesting insights about the energy market were discovered. As the energy market is highly regulated, every structural change in the system requires political support. The simulated scenarios were therefore mainly driven by policies. Every analyzed region has its own energy system making it hard to reach a global coordination. The most important message from the use with the simulator concerns the goal of reducing the GHG emissions in order to reach the 2°C target2. The simulator clearly shows that the demand side alone is not able to solve the challenge of climate change. A sustainable decrease of emissions can only be reached through the combination of changes on the demand and the supply side. Fossil fuels are mainly responsible for the high GHG emissions and need to be substituted. Moreover, other forms of energy and new technologies need to take over. Massive investments in renewable technologies, such as solar, wind and hydro are necessary to achieve a more sustainable energy mix. Furthermore, electrification of society, especially of transportation, has to be accelerated.
2 The 2 °C target describes the goal of international climate policy to limit global warming to less than two
degrees compared to the level before the start of industrialization. The goal, based on scientific knowledge about the likely consequences of global warming, was initially proposed by the German Federal Government, later the European Union and in December 2010 the 194 member states of the United Nations Framework Convention on Climate agreed to this goal.
2. Further development of a specific topic
This part explains the original approach of the business project and how it evolved over time. In a next step, it will review the main limitations of the approach and will result in the profound analysis of a specific scenario - the minimized emissions scenario for China.
2.1. What was the original approach to this topic?
The original approach of the business project with Nova SBE and EDP was to conduct a comparative analysis of the European, US and Chinese energy systems. Initially, we analyzed the global energy market and the European, US and Chinese energy systems to identify important factors for future developments.
This first step required a lot of research and expert interviews, as we had to build up a profound knowledge about energy markets in a relatively short period of time. Based on those findings, we established a clear approach and formulated three scenarios that were later in the course of the project - on request of EDP - increased to four, to show a potential global energy market evolution. Next, we simulated the scenarios and compared the different scenarios and regions. As a conclusion, we determined the key variables having a major effect on the scenarios.
2.2. What are the main limitations of the approach used?
As EDP requested not only four scenarios for global energy trends but for three different regions, we had to conduct 12 different simulations in total. The outcome of one scenario already provides enough data to cover one full report. Therefore, the main limitation for the project was to define only the major distinctive features of each scenario. On top of that, many limitations came from the simulator itself: although the simulator delivers more than 30 variables it is still a simplified model of reality and gives a limited picture of reality, resulting in the fact that every outcome is influenced by the simulator’s limitations (Appendix III). 2.3. What would you have done differently when developing this topic?
As described above, the business project report was giving a very broad perspective on the energy market. Although an understanding of the global developments is important, a clearer focus on certain areas, such as the US or China would have helped to conduct a more insightful analysis of the simulated scenarios, as these regions are especially interesting due to EDP’s recent activities with Horizon and CTG.
Therefore, this part will provide a more accurate analysis of a minimized emissions scenario for China. CTG has 21,3% of EDP’s shares (EDP, 2013) and is hereby the largest
shareholder. Having such a large investor from China with a clear focus on renewable energy, it is in EDP’s interest to analyze a potential scenario of minimized emissions with a high stake on renewables in this important market. A more precise investigation on the economic effects will be assessed, as well as a sensitivity analysis examining the most important variables of this scenario.
2.3.1. Introduction to a minimized emissions scenario for China
As already described before, the outcome of the 12 scenarios was rather a broader perspective on the global energy market than a deeper insight into one specific market. Therefore, this part describes the Chinese emission scenario more specific as the Chinese market has a great potential for future economic developments. According to the 2°C target, an increase of more than 10% GHG in the atmosphere compared to the pre-industrialized age, will boost the risk of negative effects from climate change significantly. China plays a crucial role to reach the reduction target as the remarkable growth of its economy is leading to a massive increase of GHG emissions. Appendix V shows the correlation between the world's CO2 emissions and its primary energy consumption (Appendix V).
Moreover, China overtook the United States to become the world’s largest contributor to CO2 emissions in 2007 (Zhou, 2011). Until the 1990s, China was self-sufficient in terms of covering its energy demand. During the late 90s, its growing consumption required some imports. Then, in 2002, the Chinese energy demand exploded due to economic growth, and the dependence rate started to grow rapidly (IEA Statistics, 2013). From 2002 to 2012 the consumption of coal increased by 157% from 728 Mtoe up to 1873 Mtoe (BP, 2013). In the same period grew the Chinese primary energy consumption by 155% and is still not close to the level of developed countries (Appendix IV).
2.3.2. Economic necessity to reduce greenhouse gas emissions
Damages and expenditures due to extreme weather conditions have been rising over the last thirty years, from an annual average of about $50 billion in the 1980s to nearly $200bn each year in the last decade. The total reported losses from disasters are estimated at $3.8 trillion in the period from 1980 to 2012 with 74% due to extreme-weather (Worldbank, 2013).
A report by the British government, conducted by Nicolas (2007), also investigates the potential economic effects of climate change. He concludes that climate change is a considerable economic threat that could cause costs in the height of up to 20% of the GNP until 2100, if the concentration of GHG is not stabilized at or below 550 ppm carbon dioxide equivalents (CDE). Developing and emerging countries, such as China, could incur even
more drastic economic consequences with a real income decline of 25% (OECD, 2003). Economically it is important to reduce the climate effect soon. Each year the mitigation starts later the costs can increase by 0,2% of GDP (Doll et al., 2007).
In addition to the expected environmental and economic damage in the medium and long term, some significant problems are already visible in China today. Local pollutants are already causing massive health issues and the climate is becoming harsher in the eastern regions of China (Appendix VIII). According to the Chinese government (2009), the country is “…fully aware of the seriousness and urgency of climate change…“ and already incorporated GHG emissions reductions into the Chinese Five-Year Plan (2011-2015).
The mitigation of global warming does not only prevent future economic losses, it is also a chance to promote progress and development. The structural transformation to a more environmental responsive energy system is a long-term strategy for growth and can be implemented in a productive way to support the aspirations for growth of developing countries (Kemfert and Truong, 2007). The simulations from our business project showed, that the most cost efficient scenarios are those with investments in sustainable technologies. Technologies, such as BECCS3 or hydroelectricity are having a big potential in the Chinese market and are becoming cleaner alternatives for coal (Higashi, 2009). The simulator also revealed that renewable energy is a long-term cost effective alternative to fossil fuels.
2.3.3. Steps to minimize emissions in China
Besides all the abovementioned technologies and transitions, in order to effectively reduce GHG emission the reduction of energy intensity4 is unalterable. As the world population is still growing and developing countries show a pent-up demand leading to an incredible increase of GDP, the reduction of energy usage is pivotal for a reduction of emissions (OECD, 2012).
Several steps are necessary to mitigate and reduce emissions: an increase in energy efficiency, a decrease in energy intensity, changes on the energy demand side, as well as a substitution of harmful energy sources through the use of clean power plants, heating and transport technologies are effective mechanisms. Furthermore, the production processes in the economy accruing carbon must be separated and stored through CO2 sequestration and Carbon Dioxide Capture and Storage (CCS) to permit the continued use of fossil fuels
3 BECCS: Bio-energy with carbon capture and storage
4 Energy intensity is a measure of energy efficiency, which sets the energy consumption of an economy or
without harming the atmosphere. For the general public, obstacles to a more efficient use of energy must be eliminated. The Chinese public must be better informed in order to change attitudes and behavior. Innovations to use low-carbon technologies should be encouraged (Shell, 2008). The expenses to support energy research and development should be doubled and the use of new low-carbon technologies should grow by five times. International co-operation regarding the establishment of product standards is a powerful way to increase energy efficiency (Nordhaus, 2007). By following all these measurements, the concentration of GHG could be stabilized at or below 550 ppm carbon dioxide equivalents leading to a successful emission reduction (IEA, 2013).
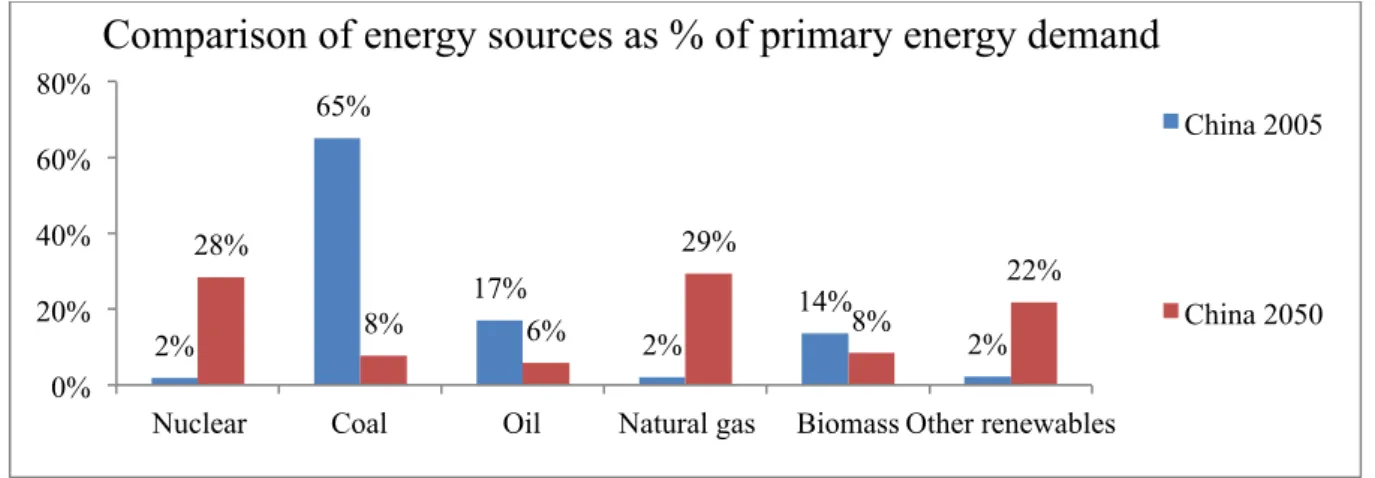
Diagram II - Energy Sources as % of Primary Energy Demand (2005 / 2050 comparison)
The graph above shows one of the results of the simulation. The change of energy sources as % of total primary energy demand from 2005 to 2050. The most important reduction of GHG emissions comes from the reduction of fossil fuels. The energy gap is then covered by an increase of Natural Gas, which is a cleaner fossil fuel, Nuclear energy and Renewables (Higashi, 2009).
In order to simulate such a quite radical but necessary approach, the variables in the simulator need to be adjusted accordingly. The energy intensity demand is drastically reduced to 20toe/M$ and the electrification levels are increased in all areas to around 50%, as well as the fuel switching of road and non-road transports. In China, nuclear energy is not such a massive political problem as in other countries (Sovacool, 2010). Thus in the simulation, China makes use of this technology and produces 500 Giga Watt (GW). On top of that, CCS technology is used in the scenario as well.5
5 For the exact selection of variables for the simulation please refer to Appendix II.
2% 65% 17% 2% 14% 2% 28% 8% 6% 29% 8% 22% 0% 20% 40% 60% 80%
Nuclear Coal Oil Natural gas Biomass Other renewables
Comparison of energy sources as % of primary energy demand
China 2005
2.3.4. Sensitivity analysis and comparison with China’s current energy policies
The sensitivity analysis in Diagram II shows how significant the influence of Industrial Energy Intensity is on the demand side. The effect industrial energy intensity on the energy consumption is tremendous. An increase in Industrial Energy Intensity from 20 to 50toe/M$ is resulting in a 68% increase in primary energy consumption. From 20 to 90toe/M$ there is a change of 267%. This result is clearly underlining the importance of the energy intensity of the industrial sector to the energy consumption in China.
Diagram II- Sensitivity analysis of industrial energy intensity
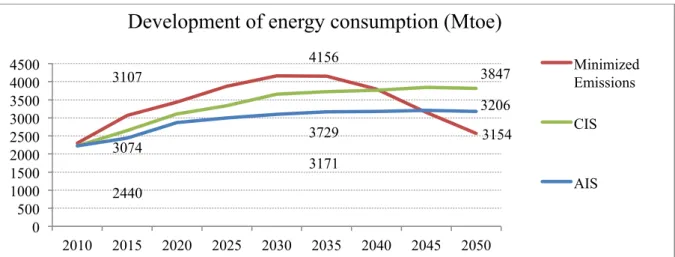
When comparing the outcome of the scenario resulting from the EDP 2050 Simulator with scenarios published by the Chinese Energy Research Institute (CERI) - with its two main scenarios: Continued Improvement Scenario (CIS) and Accelerated Improvement Scenario (AIS) - the forecasts reveal very low increases in energy consumption in China for the coming years. Nevertheless, as Diagram II shows, the level of energy consumption in 2050 is relatively close to this reports scenario of minimized emissions.
Diagram III - Development of energy consumption from 2005 until 2050 in different scenarios
2576 4319 6882 2000 3000 4000 5000 6000 7000 2010 2015 2020 2025 2030 2035 2040 2045 2050 Primary energy consumption in Mtoe
Sensitivity analysis of Industrial Energy Intensity
Industrial Energy Intensity of 20toe/M$ Industrial Energy Intensity of 50toe/M$ Industrial Energy Intensity of 90toe/M$ 3074 4156 3154 3107 3729 3847 2440 3171 3206 0 500 1000 1500 2000 2500 3000 3500 4000 4500 2010 2015 2020 2025 2030 2035 2040 2045 2050
Development of energy consumption (Mtoe)
Minimized Emissions CIS
However, other sources predict high single-digit growth rates for China until the 3rd decade of this century, followed by a slight slowdown or stabilization (lowering or stable energy consumption), which fits well with the result of the scenario developed in this report (PwC, 2013).
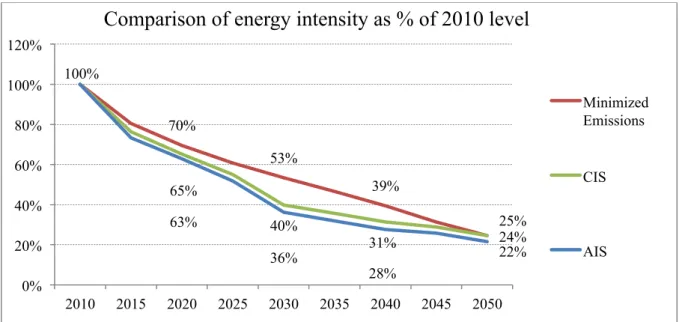
Diagram IV - Comparison of Energy Intensity as % of 2010 Level with CIS and AIS scenario
The only way energy consumption may grow on such a low rate as forecasted by CERI would be through strong continuous improvements in energy intensity levels. The minimized emission scenario, as well as the CSI and AIS scenario, shows relatively similar results in terms of a drastic decrease of energy intensity compared to 2010 (Diagram IV).
2.3.5. Conclusion
Reducing emissions in China, would not only help to stabilize the climate due to a reduction of emissions, it would also help to avoid economic problems due to environmental problems. Stern estimated the costs from environmental catastrophes to be up to 20% of the GDP. So it is in China’s vital interest to further invest in electrification and energy intensity reduction, combined with an aggressive investment on renewable energy (Appendix VI).
The simulation showed clearly, that an early action on emissions is cheaper, and that curbs on emission reductions based on economical short-term thinking leads to far greater costs in the medium and long-term (Appendix VII). These circumstances create great opportunities for EDP. With a strong portfolio in renewables and a strategic partnership with CTG, EDP is well positioned to deliver expertise and technology to China.
70% 53% 39% 24% 100% 65% 40% 31% 25% 63% 36% 28% 22% 0% 20% 40% 60% 80% 100% 120% 2010 2015 2020 2025 2030 2035 2040 2045 2050
Comparison of energy intensity as % of 2010 level
Minimized Emissions
CIS
3. Reflection on learning
After unfolding the knowledge from the masters program used to accomplish the business project, the author focuses on the professional and personal development to complete with a critical examination on the project. This part describes the author’s personal development and experiences, therefore this section is written in the first-person perspective.
3.1. Previous knowledge learned from the Masters Program
Completing a Masters in Management at Nova SBE and a CEMS Masters in International Management provides a profound and wide-ranging knowledge, not only of management theory but also of project management familiarity. The Nova Strategy course gave me a solid base to perform external markets analysis by using PESTEL and to conduct forecasts through using different scenarios. The Global Management Practices course provided me with selected tools to work with diverse members from different backgrounds. The Consulting course was a good foundation to work in a precise, professional and academic way. Academically, especially research skills helped to conduct profound research on the energy market in a short timeframe. Finding and evaluating sources is an academic skill I learned from my previous projects and assignments in various courses.
3.2. New knowledge
This Business Project confronted me with a very specific market. As I only had limited previous knowledge on the energy market and the high influence from policies, I gained enormous insights and knowledge in a relatively short timeframe. One of the most important learning’s for me was the fact, that the utility business is facing not only a macroeconomic, but also a high political risk. The energy market is extremely regulated and therefore energy companies need to understand the political trends in energy policies. Besides understanding the market as whole, I was also able to gather new knowledge in terms of methodologies and frameworks that were used during the business project. Especially the work plan we were using during the whole project was very helpful to align all stakeholders (team, academic advisor and company advisor) and to gain deep insights for understanding the full processes and structures.
3.3. Personal experience
3.3.1. Key strengths & weaknesses - insights from participating in this project Due to my experiences from working and studying with multicultural teams, the project contributed from my strong skills in cross-cultural management. Having lived and worked in international environments as Munich, London, Bangalore, Singapore, Budapest and Lisbon,
I was able to adapt and incorporate quickly to the group, having its very own dynamic consisting four different nationalities. This fast adaption phase enabled me to fulfill my position as group leader. My confidence and openness mostly helped to engage the group, but I sometimes developed the tendency to push my team members too much in very stressful situations. Having my own opinion in mind, it can be difficult for me to accept the individual opinions of others. However, working in this very motivated and diverse team, with different backgrounds, I learned to actively step back to give my team members time to express their ideas to find the best possible solution for our project.
3.3.2. Plan to develop your areas of improvement.
In order to further improve my skills, I will make more use of an open and direct communication making my team members more comfortable in communicating their opinions, even if they need to overcome their shyness first. This approach could help to uncover hidden talents from my team members and increase the overall performance of the team. As every team is different, I should give myself more time to observe every group arrangement and then adjust accordingly to the specific dynamics.
3.4. What added most value? What should have been done differently?
The business project created a great opportunity to get insights into the real business world, while still being in the “save” academic surrounding and always having the helpful experience of an academic advisor. I had the opportunity to gain understanding on a very interesting business and to work with inspiring and passionate people. The energy business is a very interesting business with a high potential for future developments and changes. In this very dynamic, fast-changing but problematic business one has to learn fast and adapt quickly to new possibilities and come with effective solutions for difficult economic situations. That was why the learning outcome for this challenging project was very high.
In order to ensure value for participants, I would advise to be a bit more selective in choosing business projects. Although our energy project was very interesting, it is questionable if it brings value to the corporate partner and is therefore valued sufficiently. Especially, when highly motivated CEMS students want to create value and put a lot of effort into the projects, the support of the companies could be more effective.
List of References
BP (2014): BP Energy Outlook 2035, BP Stats, Available at:
http://www.bp.com/content/dam/bp/pdf/Energy-economics/Energy-Outlook/Energy_Outlook_2035_booklet.pdf [Accessed May 15, 2014].
Chinese Government (2009): China’s Position on the Copenhagen Climate Change Conference May 20, Available at:
http://en.ccchina.gov.cn/Detail.aspx?newsId=38744&TId=107 [Accessed May 19, 2014].
Claus Doll et al. (2007): Wirtschaftliche Bewertung von Maßnahmen des Integrierten Energie- und Klimaprogramms (IEKP). Karlsruhe/Berlin/Jülich: Fraunhofer Institut für System- und Innovationsforschung, Öko-Institut, Forschungszentrum Jülich.
EDP - Energias de Portugal (2013): EDP - 2012 Annual Report, Available at: http://www.edpannual-report.edp.pt/pt/, [Accessed May 19, 2014].
EDP - Energias de Portugal (2014): Investor Presentation, Available at:
http://www.edp.pt/en/Investidores-/publicacoes/- tematicas/Apresentaes%20Temticas/Investor%20Presentation%20-%20March%202014.pdf, [Accessed May 19, 2014].
European Institute of Innovation and Technology (2014): KIC InnoEnergy Iberia receives Research Award in Barcelona as the best private-public partnership in R+D, Available at: http://www.kicinnoenergy.com/-blog/2014/01/28/kic-innoenergy-iberia-receives-research-award-in-barcelona-as-the-best-private-public-partnership-in-rd/ [Accessed May 19, 2014].
IEA Statistics (2013): Energy Statistics of OECD Countries, IEA Publications, Luxembourg. IEA (2013): Renewable Energy Outlook: World Energy Outlook 2013, Available at:
http://www.worldenergy-outlook.org/media/weowebsite/2013/WEO2013_Ch06_Renewables.pdf [Accessed April 21, 2014].
Higashi, N. (2009): Natural Gas in China Market evolution and strategy. Energy markets and
security, pp.1–39.
Kemfert, C. (2005): Global Climate Protection: Immediate Action Will Avert High Costs. DIW Weekly Report, 1, pp.135–141.
Kemfert, C. & Truong, T. (2007): Impact assessment of emissions stabilization scenarios with and without induced technological change. Energy Policy, 35, pp. 5337–5345. Knabb, Richard D., Rhome, Jamie R. and Brown, Daniel P. (2005): Tropical Cyclone
National Bureau of Statistics (NBS): Various years. China Statistical Yearbooks. Beijing: China Statistics Press. National.
Nordhaus, W.D. (2007): Review: A Review of the “Stern Review on the Economics of Climate Change.” Journal of Economic Literature, 45, pp.686–702. Available at: http://www.jstor.org/stable/27646843 [Accessed April 21, 2014].
OECD (2003): Estimating the Benefits of Climate Change Policy, Paris.
PwC Economics (2013): World in 2050 The BRICs and beyond: prospects, challenges and opportunities, http://www.pwc.com/en_GX/gx/world-2050/assets/pwc-world-in-2050-report-january-2013.pdf, [Accessed May 19, 2014].
Shell (2008): Shell energy scenarios to 2050, Shell International BV, Available at: http://www.shell.com/-global/future-energy/scenarios/2050.html [Accessed May 20, 2014].
Sovacool, Benjamin K. (2010): A Critical Evaluation of Nuclear Power and Renewable Electricity in Asia, Journal of Contemporary Asia.
Stern, N. (2007): The economics of climate change – the Stern review. Cambridge University Press, Cambridge, UK.
Wang, Y. & Chandler, W. (2011): Understanding Energy Intensity Data in China. Policy
Outlook, Carnegie Endowment for International Energy, Available at:
http://scholar.google.com/scholar?hl=en&btnG=-Search&q=intitle:Understanding+Energy+Intensity+Data+in+China#1 [Accessed May 19, 2014].
Worldbank (2013): Damages from Extreme Weather Mount As Climate Warms, Available at: http://www.worldbank.org/en/news/press-release/2013/11/18/damages-extreme-weather-mount-climate-warms [Accessed May 22, 2014].
Zhou, N., (2011): China’s Energy and Carbon Emissions Outlook to 2050, Available at: http://escholarship.org/-uc/item/4sz7t1tf.pdf [Accessed May 18, 2014].
Zhou, N. et al. (2013): China’s energy and emissions outlook to 2050: Perspectives from bottom-up energy end-use model. Energy Policy, 53, pp.51–62. Available at:
http://linkinghub.elsevier.com/retrieve/-pii/S0301421512008476 [Accessed May 19, 2014].
Appendix
Ma rk et p ri ce s Oil price Coal price Natural gas price CO2 price En er gy D em an d Population GDP/Capita In te ns it yResidential energy intensity demand Services & agriculture energy intensity demand Industrial energy intensity demand Road transports penetration
Su bs ti tu ti on
Electrification of residential energy demand Electrification of services energy demand Electrification of industrial energy demand Electrification of road light transports Fuel switching of road transports Electrification of non-road transports Fuel switching of non-road transports
Ge n er at io n o r Ca p ac it y Coal power Gas power Hydroelectric generation Nuclear power Onshore wind power Offshore wind power Solar PV power Solar CSP power CHP power Biomass and MSW power Geothermal power Ocean power Energy Imports
CO
2
Thermal power plants with CCS Industrial plants with CCS Emissions' reduction due to geosequestration Appendix I - EDP 2050 Simulator Variables
Variable Unit China
Energy Demand
Population Million 1700 1500 1350 1000
GDP/Capita k$/capita 40 30 20 10
Residential energy intensity demand toe/kcapita 600 400 260 150 Services & agriculture energy intensity demand toe/M$ 30 25 20 15 Industrial energy intensity demand toe/M$ 120 90 50 20 Road transports penetration Vehicles/cap 700 500 400 200 Electrification of residential energy demand % 15 30 45 60 Electrification of services energy demand % 20 40 60 80 Electrification of industrial energy demand % 30 40 50 60 Electrification of road light transports % 10 25 50 75 Fuel switching of road transports % 10 25 50 75 Electrification of non-road transports % 10 20 30 40 Fuel switching of non-road transports % 10 25 50 75
Generation or Capacity Coal power GW NA NA NA NA Gas power GW 200 500 1000 1500 Hydroelectric generation GW 300 400 550 700 Nuclear power GW 50 150 250 500
Onshore wind power GW 200 500 800 1100 Offshore wind power GW 50 100 200 400
Solar PV power GW 50 200 500 800
Solar CSP power GW 25 75 150 300
CHP power GW 30 85 150 250
Biomass and MSW power GW 50 100 150 250
Geothermal power GW 5 50 100 150
Ocean power GW 5 10 50 100
Energy Imports GW 0 30 50 100
CO2 Emissions
Thermal power plants with CCS % 0 25 50 100 Industrial plants with CCS % 0 25 50 100 Emissions' reduction due to geosequestration Mton 0 50 100 250
Results
GHG emissions vs. 2005 % 48 Cost of Energy B$/year 1472
Difficulty Level % 65
Baseline Values Based on our research, we found out that a couple of baseline values that need an update, i.e. the population for the US is most likely to be 400 million instead of 300. Also, the GDP per capita in China will most definitely be higher than 10.000$/per capita. On top of that, we believe the business as usual values should be the starting point for the simulation (e.g. If the energy intensity trend in the EU is going down, then the starting point should at least be the current EU levels and not an increase to the US levels).
CCS Since the economic viability of this concept is still not internationally indisputably accepted, we believe it will be extremely unlikely to have all plants with carbon capture and sequestration. We recommended a lower range of values for these variables.
CHP Taking into consideration that cogeneration is an efficient way to leverage fossil fuels we believe the CHP formula needs to be rearranged (mix between residential and industrial) so as to better leverage its advantages.
Cost Functions The cost functions should change with scale. While in hydro it might become increasingly costly to add capacity due to the restrictions on natural resources, in solar PV we have economies of scale from producing higher levels of panels.
Difficulty Levels Concerning the difficulty levels, we gave several recommendations to improve the accurateness of the simulator.
I. Within variables – the effect on the final outcome has to be proportional to the difficulty of changing a variable. Biomass accounts for 1% difficulty while Industrial Energy intensity only accounts for 2% - a change on the later one is much more difficult than the first (even more than double).
II. In each variable – The increase in difficulty at lower levels (from 1 to 2) should not be the same as going to the extreme solution (3 to 4). Looking at on-shore wind in Europe: a 100GW to 200GW increase is much easier than a 400GW to 600GW (!Difficulty shouldn't be linear but exponential). III. Same variable in different regions – it is less difficult to install
solar CSP power in the US than it is in the EU or it is less complex to install additional nuclear capacity in China than it is in the EU.
Storage So far, the simulator does not take storage into account. When increasing the share of renewable energy, intermittency becomes an issue. So as to tackle that, one of the solutions is storage.
Appendix IV - Primary Energy Consumption in 2012
The World’s average primary energy consumption in 2012 (in Appendix IV) was 1,78 toe/capita. China, however, already exceeds that level with 2.03. China still exhibits a relatively low consumption per capita, but will experience a drastic increase toward 2050. If it approaches Western standards, the consequences could be drastic.
Appendix V - Correlation between the world's CO2 emissions and primary energy consumption
Appendix V clearly demonstrates the strong correlation (0,9984) between the increase of the primary energy consumption and the output of CO2 emissions. Primary energy consumption from 1965 until 2012 increased from 3.755 Mtoe to 12.477 Mtoe. The CO2 emissions in this period increased from 11.709 Mtoe to 34.466 Mtoe.
7,04 4,84 2,03 0,46 3,75 3,32 - 1,00 2,00 3,00 4,00 5,00 6,00 7,00 8,00 US Russia China India Japan EU
Primary energy consumption in 2012 (Mtoe / capita)
Primary energy consumption in 2012 (Mtoe / capita) - 2000 4000 6000 8000 10000 12000 14000 - 5000 10000 15000 20000 25000 30000 35000 40000 1965 1970 1980 1990 2000 2012 Primary energy consumtion in Mtoe CO2 emissions in Mtoe
Correlation between CO
2emissions and Energy Consumption
CO2 Emission
Primary Energy Consumption
Appendix VI- Development of GHG Emissions in a minimized emissions scenario (2005 - 2050)
Appendix VI shows how China’s GHG emissions will develop in comparison to the EU and US. Due to the necessary catch-up process of the Economy, China will continue to increase its emissions until 2030, where it reaches its peak with 175%. From there the GHG emissions mitigation starts, leading to a reduction down to 48% in 2050.
Appendix VII - Comparison of development of total energy costs (in B$10)
Appendix VII illustrates, that the other scenarios do not require such major changes in the energy system, (difficulty to follow these scenarios is significantly lower), but they also not building up pressure to optimize the cost structure in the long run. Therefore, the other scenarios have lower unitary costs of energy, but since the demand is much higher than in the minimized emissions scenario, the total cost of energy rises steeply and will be considerably higher in 2050 than in the minimized emission scenario.
135% 171% 175% 120% 48% 83% 74% 60% 44% 24% 92% 64% 49% 35% 23% 0% 20% 40% 60% 80% 100% 120% 140% 160% 180% 200% 2005 2010 2015 2020 2025 2030 2035 2040 2045 2050
Greenhouse gas emissions in a minimzed emissions scenarios
China USA EU 3164 1640 1502 677 0 500 1000 1500 2000 2500 3000 3500 2000 2005 2010 2015 2020 2025 2030 2035 2040 2045 2050
Development of Eneregy costs in different scenarios
International Competition Energy Security Sustainable Green Minimized Emissions
Hurricane Katrina as example of damages due to extreme weather conditions
The U.S. government estimated the damage from Hurricane Katrina with more than $ 100 billion. Already this one extreme climate event lead to a decline in growth in the amount of 0.2 - 0.4 % of the US GDP in 2005 (Kemfert, 2005). The damage on oil platforms caused oil supply outages, resulting in rising oil prices and further losses in GDP growth. Besides directly measurable damages, there are several other indirect cost effects that need to be included: damage to infrastructure, diseases caused by outbreaks of epidemics, deaths, and damage to agriculture (particularly in case of floods). All these damages have to be expended by the State and thereby reduce the opportunity of spending in other places (Knabb, 2005)
There are also some industries benefitting from such events. The rebuilding of damaged infrastructure and real estate had some positive growth effects for the construction industry in the United States. In the example of the Hurricane Katrina these effects resulted in an increase of GDP by 0.1 % (Kemfert, 2005)
Adding up all negative and positive effects of the hurricane you come, according to calculations of the Munich Re insurance, to an amount of about 2 to 3 % of the gross national product (GNP) of the United States in 2005.