BJRS
RADIATION SCIENCES
08-02 (2020) 01-12ISSN: 2319-0612 Accepted: 2020-06-19
Optimization of the gamma-ray spectrometry counting
time based on uncertainties of radionuclides
concentration in samples
Nisti
aM.B., Máduar
aM.F., Saueia
aC.H.R., Cavalcante
aF., Mazzilli
aB.P.
a Instituto de Pesquisas Energáticas e Nucleares Av. Prof. Lineu Prestes 2242, 05508-000, São Paulo, SP, Brazil[email protected], [email protected]
ABSTRACT
This paper aims to propose an easy and fast method of optimization of the gamma-ray spectrometry counting time in determining natural radionuclides (210Pb, 212Pb, 214Pb, 212Bi, 214Bi and 228Ac) in order to minimize
uncertainties in the concentration. The samples were measured by gamma-ray spectrometry with a hyper-pure germanium detector Canberra, 25% relative efficiency, effective resolution of 1.9 keV on the 1332.5 keV 60Co with associated electronics and coupled to a microcomputer. Multichannel Maestro A65-I model was used for spectrum acquisition and peak net area determination, and WinnerGamma/Interwinner 6.01 software was used for gamma-ray spectra analysis and to calculate the concentrations and associated uncertainties. The counting times used were 86,000 s and 150,000 s.
1. INTRODUCTION
The technique of gamma-ray spectrometry is a powerful tool for determining the contents of gamma-ray emitter radionuclides in samples. As the result of applying this technique, a counts vs. energy spectrum is obtained. To ensure that high-quality spectra are obtained, good practices for their acquisition must be established, including physical setup, electronic settings, counting conditions, corrections for unwanted but inevitable sources of radiation [1] and validation by proficiency tests.
An important step in using gamma-ray spectrometry on a routine basis for a given detection system is the definition of adequate counting time, which depends on the sample type, the radionuclides to be determined, radiation background, sample geometry and characteristics of the detection system (detector, shielding and associated electronics). Counting time in gamma-ray spectra acquisition can be preset relying in two criteria: the attainment of an acceptable minimum detectable activity (MDA) value; or instead the need to quantify the target radionuclide, even at very low concentration. A major issue in determining activity in samples with very low radionuclides concentration is the high uncertainties that arise, when not sufficient counting time is employed.
When measurements for natural radionuclide are intended, correction for the background radiation is always required. A counting time for the background spectra greater than 5 times the sample counting time is recommended [2].
Currie [3] published a pioneering paper on detection limits that became a worldwide reference on the subject. He defined three limits: critical limit, detection limit, and determination limit. The critical limit is used to decide whether a signal was generated on a measurement, the detection limit refers to the sensitivity of the analytical technique, and the determination limit is the value above which a reliable result in the quantitative determination of a radionuclide is achieved.
Shweikani and Hasan[4] estimated a relationship between the minimum detectable activity (MDA) and counting time, obtaining an optimum time of 15 h for long-lived radionuclides in environmental samples.
Nisti et al.[5] evaluated “a priori” counting times as a function of the preset minimum detectable amount MDA, for time counting optimization in gamma-ray spectrometry. Several set-ups including four HPGe detectors, four counting geometries and different counting times (1,000 s, 5,000 s, 10,000
s, 15,000 s, 50,000 s, 100,000 s and 150,000 s), were employed. The “a priori” counting time of 50,000 s was found to be generally sufficient to reach agreement between the preset and actual counting times.
In this paper, we aim to establish an easy and fast method to optimize the counting time to minimize the uncertainties in the concentration to acceptable levels in determining natural radionuclides. The optimization of the counting time with a good accuracy is important in the accomplishment of automation in routine measurements with acceptable detection limits[5] and reduction in the measurement cost [4].
2. MATERIALS AND METHODS
Nine soil samples were sealed for about four weeks, prior to measurements, in order to ensure that radioactive equilibrium has been reached between 226Ra and its progeny. After this, the soil
samples were measured by gamma-ray spectrometry with a hyper-pure germanium detector Canberra, 25% relative efficiency, effective resolution of 1.9 keV at the 1332 keV 60Co with associated
electronics and coupled to a microcomputer. In the resulting spectra, net peak areas and concentrations of radionuclides 210Pb, 212Pb, 214Pb, 212Bi, 214Bi, and 228Ac were determined.
Multichannel Maestro A65-I model software [6], for spectrum acquisition and determination of the net peak area, and WinnerGamma/Interwinner 6.01 software, for analysis of gamma-ray spectra [7] and assessment of concentrations and associated uncertainties, were employed. Background spectra were collected in the same conditions of the samples measurement, with counting time of 500,000 s.
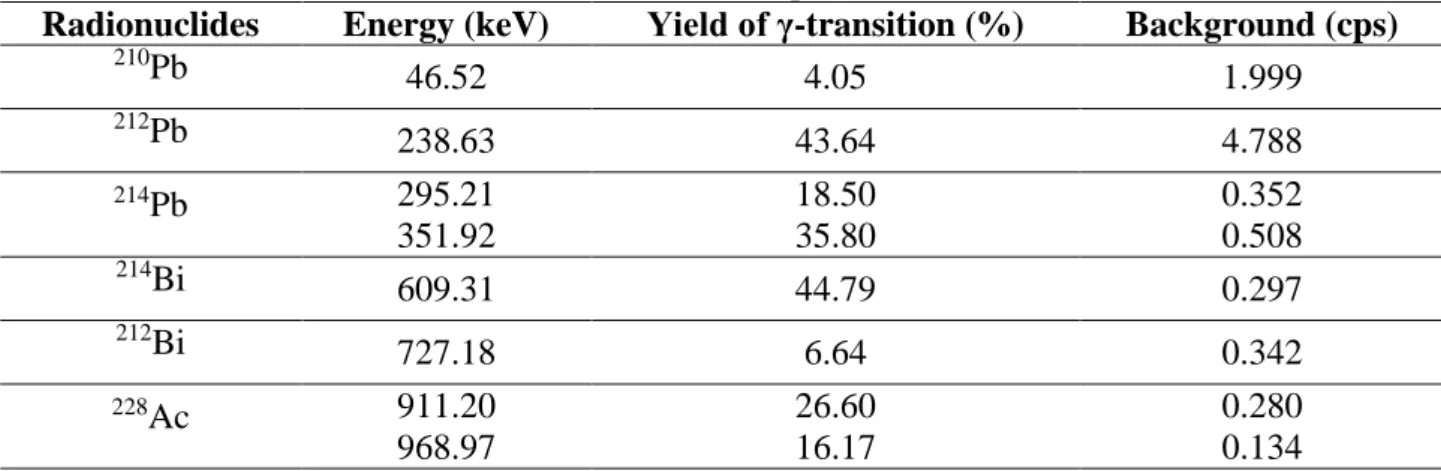
Table 1 shows the gamma energies (keV) recommended for quantitative measurement of the 238U decay series and 232Th decay series [2], yield of -transition (%), and background count rates (cps) of
Table 1: Radionuclides studied and their gamma energies, transitions` yields and background count
rates (×10-3 cps).
Radionuclides Energy (keV) Yield of γ-transition (%) Background (cps)
210Pb 46.52 4.05 1.999 212Pb 238.63 43.64 4.788 214Pb 295.21 18.50 0.352 351.92 35.80 0.508 214Bi 609.31 44.79 0.297 212Bi 727.18 6.64 0.342 228Ac 911.20 26.60 0.280 968.97 16.17 0.134
The counting time optimization was evaluated by determining the ratio between the net peak area in the sample spectrum (cps) and background radiation of the detection system (cps) for each radionuclide, according to Eq. (1):
(1)
where
Ri : ratios for radionuclide i.
Csam,i : net peak area in the sample spectrum (cps) for radionuclide i.
CBG,i : background radiation of the detection system (cps) for radionuclide i.
The preset times of 86,000 s and 150,000 s were used for the measurements and the ratio was obtained for the following lines: 46.52 keV from 210Pb, 238.63 keV from 212Pb, 295.21 and 351.92 keV from 214Pb, 609.31 keV from 214Bi, 727.18 keV from 212Bi and 911.20 and 968.97 keV from
228Ac.
Multichannel Maestro was used for spectrum acquisition and peak net area determination. Background radiation was calculated by the WinnerGamma/Interwinner software, which provides a table of background count rates for each gamma line in the blank samples spectrum and analyses the spectra. Blank samples for background determination were prepared with hyper-pure water. The same
i BG i sam i
C
C
R
, ,
software was used for gamma-ray spectra analysis and to calculate the concentrations and associated uncertainties as well.
The comparison between the counting times for the same sample was done taking into account the difference of uncertainties in the concentrations. The value of 1% in the difference of uncertainties in the concentrations was defined as the most appropriate, and no advantage was observed in increasing the counting time.
The performance of the gamma-ray spectrometry measurements was evaluated by participation in proficiency tests for Brazilian laboratories, organized by Instituto de Radioproteção e Dosimetria (IRD), which is available on a routine basis three times per year [8].
3. RESULTS AND DISCUSSION
Table 2 shows the 210Pb, 212Pb, 214Pb, 212Bi, 214Bi and 228Ac net peak areas in the spectra obtained
from the measurement of the samples.
Table 2: 210Pb, 212Pb, 214Pb, 212Bi, 214Bi and 228Ac net peak areas in the sample spectra (×10-3 cps).
Sample Counting Time (s) 210Pb 46.52 keV 212Pb 238.6 3 keV 214Pb 295.2 1 keV 214Pb 351.9 2 keV 214Bi 609.3 1 keV 212Bi 727.1 8 keV 228Ac 911.2 0 keV 228Ac 969.9 7 keV A 86.000 6.6 21.0 9.0 12.3 8.8 1.0 3.2 2.0 150,000 6.7 21.7 8.8 14.1 8.9 1.2 3.6 1.9 B 86.000 4.0 12.0 4.2 6.7 3.8 0.7 2.5 1.6 150,000 4.1 12.5 3.8 6.4 4.2 0.8 2.7 1.1 C 86.000 7.7 23.5 9.7 16.5 10.8 1.2 4.1 1.8 150,000 7.6 22.2 10.0 16.1 10.3 1.0 4.2 2.4
D 86.000 8.2 25.3 9.1 15.7 11.0 1.7 4.3 2.8 150,000 8.1 25.2 9.5 16.1 10.4 1.5 4.1 2.6 E 86.000 6.1 22.9 8.2 14.1 9.7 1.4 3.8 2.4 150,000 7.3 20.3 9.0 13 9.3 1.4 3.4 1.8 F 86.000 7.0 22.8 8.3 13 8.9 1.2 3.7 2.0 150,000 7.1 21.6 8.4 13.4 8.9 1.0 4.0 2.0 G 86.000 7.0 27 7.7 15.9 10.2 1.3 4.4 2.2 150,000 7.0 26.1 8.9 15.8 10.2 1.4 4.5 2.3 H 86.000 5.9 19.9 6.5 11.4 7.2 1.3 3.3 1.2 150,000 5.7 20 6.9 11.6 7.7 1.1 3.1 1.4 I 86.000 5.4 35 6.2 10.5 7.2 1.7 5.0 3.3 150,000 5.3 34.5 6.4 10.9 7.3 2.1 5.2 3.2
InterWinner software (Interwinner, 2004) was employed in calculating the concentrations and associated uncertainties, for both counting time and energy. Table 3 shows the associated uncertainties in 210Pb, 212Pb, 214Pb, 212Bi, 214Bi and 228Ac concentrations.
Table 3: Uncertainties in concentration, (%), for selected gamma-ray lines from 210Pb, 212Pb, 214Pb, 212Bi, 214Bi and 228Ac . Sample Counting Time (s) 210Pb 46.52 keV 212Pb 238.6 3 keV 214Pb 295.2 1 keV 214Pb 351.9 2 keV 214Bi 609.3 1 keV 212Bi 727.1 8 keV 228Ac 911.2 0 keV 228Ac 969.9 7 keV A 86.000 19.2 7.9 8.6 7.7 8.5 29.7 11.6 16.9
150,000 16.2 7.5 8.0 7.3 7.8 20.7 10.1 15.6 B 86.000 39.8 9.9 12.9 10.1 12.7 46.9 12.0 21.9 150,000 30.8 9.1 11.2 9.1 10.5 30.4 10.5 22.3 C 86.000 15.6 7.8 8.5 7.5 7.9 29.6 9.9 18.2 150,000 14.9 7.4 7.8 7.3 7.4 28.6 9.2 14.9 D 86.000 15.2 7.6 8.9 7.6 7.7 22.4 10.1 16.2 150,000 14.3 7.3 8.0 7.2 7.3 17.8 8.9 15.1 E 86.000 17.9 7.8 8.7 7.8 8.3 21.9 10.3 16.5 150,000 14.9 7.6 8.0 7.4 7.7 22.6 9.7 15.3 F 86.000 16.0 7.9 9.2 8.0 8.5 23.9 11.1 18.2 150,000 15.0 7.5 8.1 7.4 7.7 24.7 9.2 16.0 G 86.000 19.3 7.4 8.4 7.6 8.2 22.1 10.0 16.1 150,000 15.4 7.2 7.6 7.3 7.6 23.0 8.4 15.5 H 86.000 20.6 8.4 10.3 8.3 9.5 23.0 11.8 23.8 150,000 17.9 7.8 8.5 7.6 8.1 21.5 9.9 16.4 I 86.000 25.7 7.2 10.4 8.4 9.0 20.7 10.1 15.3 150,000 19.7 7.0 8.5 7.7 8.0 15.4 8.7 14.0
The results of natural radionuclides concentrations determined in the soil samples, with counting time 86,000 s, ranged as follows: 14.7 to 78.4 Bq kg-1 for 210Pb, 18.9 to 67.8 Bq kg-1 for 212Pb, 26.4 to 80.5 Bq kg-1 for 214Pb, 23.9 to 85.4 Bq kg-1 for 214Bi, 20.4 to 57.8 Bq kg-1 for 212Bi and 28.4 to 55.9 Bq kg-1 for 228Ac. For the counting time of 150,000 s, obtained ranges were: 16.7 to 60.6 Bq kg-1 for
28.1 to 65.7 Bq kg-1 for 212Bi and 29.0 to 59.5 Bq kg-1 for 228Ac. The ratio between the net peak area in the sample spectrum (cps) and background radiation of the detection system (cps) for each radionuclide were calculated using equation 1. From the results of the Table 3, the differences of uncertainties in the concentration values for the two counting times (86,000 s and 150,000 s) for each sample were calculated.
For determining of the ratio with the difference of uncertainties in the concentrations of 1% between the two counting times 86.000s and 150,000 s, first-degree equations obtained in the correlation between ratios values and difference of uncertainties in the concentrations values were used. Figure 1 shows the correlation between ratio values ( sample and bg in cps) and the difference of uncertainties in the concentration values for the two counting time for each natural radionuclide studied (210Pb, 212Pb, 214Pb, 212Bi, 214Bi and 228Ac).
Figure 1: Correlation between ratio values and difference of uncertainties (%) for 210Pb, 212Pb,
A good correlation was observed for the natural radionuclides 210Pb, 212Pb, 214Pb and 214Bi, while
212Bi and 228Ac presented a poor correlation.
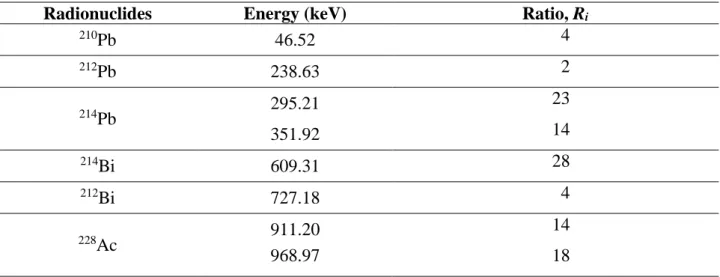
Table 4: Ratios Ri as defined in Eq. (1), resulting in uncertainty differences below 1%.
Radionuclides Energy (keV) Ratio, Ri
210Pb 46.52 4 212Pb 238.63 2 214Pb 295.21 23 351.92 14 214Bi 609.31 28 212Bi 727.18 4 228Ac 911.20 14 968.97 18
Table 4 shows the ratio values (Ri) necessary to achieve 1% of the difference uncertainty value,
thus being able to interrupt the sample count in the detection system, optimizing the counting time. The decision for the acceptable difference of uncertainties in the concentration in the two counting times is up to each particular laboratory needs. For the purposes of our laboratory, we understand that, once an uncertainty difference value of 1% is achieved, there is no advantage in increasing the counting time, and thus saving valuable operational time of the detectors.
This implies that, when the Ri values from Table 4 are obtained for a particular counting, the required measuring time has been achieved and the counting can immediately be stopped, thus optimization the counting time.
4. CONCLUSION
The natural radionuclides usually utilized in high resolution gamma-ray spectrometry for the determination of the 238U decay series are 210Pb, 214Pb and 214Bi, and for the 232Th decay series are
212Pb, 212Bi and 228Ac. This paper aimed to propose an easy and fast method for implementing
counting time optimization by using the net peak areas present in the gamma-ray spectra and the corresponding uncertainties, for the particular detection system under study.
The choice of the uncertainty differences and the counting times can be established by each laboratory, in order to reach the best performance of the detection system, in terms of cost/benefit criteria.
The proposed methodology could be useful as a tool for laboratories, dealing with large number of samples on a routine basis, by reducing the counting time and optimizing the use of the detection system, thus improving their performance.
REFERENCES
[1] GEHRKE, R. J.; DAVIDSON, J. R. Acquisition of quality g-ray spectra with HPGe spectrometers. Appl. Radiat. Isot, v. 62, p. 479-499, 2005.
[2] ODDONE, M.; GIORDANI, L.; GIACOBBO, F.; MARIANI, M.; MORANDI, S. Practical considerations regarding high resolution gamma-spectrometry measurements of naturally occurring radioactive samples. J. Radioanal. Nucl. Chem, v. 277, p. 579-585, 2008.
[3] CURRIE, L. A. Limits for Qualitative Detection and Quantitative Determination. Anal. Chem, v. 40, p. 586-592, 1968.
[4] SHWEIKANI, R.; HASAN, M. Determination of the optimal measurement counting time and detection limit for gamma-ray spectrometry analysis. Accred. Qual. Assur, p. 501-504, 2015. Available at: <http:// http://dx.doi.org/10.1007/s00769-015-1169-5>. Last accessed: 11 Jul. 2019. [5] NISTI, M. B.; SANTOS, A. J. G.; PECEQUILO, B. R. S.; MÁDUAR, M. F.; ALENCAR, M. M.; MOREIRA, S. R. D. Fast methodology for time counting optimization in gamma-ray spectrometry based on preset minimum detectable amounts. J. Radioanal. Nucl. Chem, v. 281, p. 283-286, 2009.
[6] Maestro Software. Maestro for Windows (Emulation software for Gamma Spectroscopy). Model A65-B1Version 3.04, EG&G ORTEC, 1995.
[7] InterwinnerTM 6.0. MCA Emulation, Data Acquisition and Analysis software for Gamma
and Alpha Spectroscopy. IW-B32 2004. ORTEC. Oak Ridge, TN, USA, 2004.
[8] TAUHATA, L.; VIANNA, M. E. C.; OLIVEIRA, A. E.; FERREIRA, A. C. M.; CONCEIÇÃO, C. C. S. Metrological capability of the Brazilian laboratories of analyses of radionuclides in environmental samples. Appl. Radiat. Isot, v. 56, p. 409-414, 2002.