BJRS
RADIATION SCIENCES
07-02B (2019) 01-13ISSN: 2319-0612 Accepted: 2019-02-22
Design of a digital system for operational parameters
simulation of IPR-R1 Triga nuclear research reactor
Aldo M. F. Lage
a; Adriano de A. M. Felippe
b; Amir Z. Mesquita
aa Centro de Desenvolvimento da Tecnologia Nuclear (CDTN / CNEN - MG), Av. Presidente Antônio Carlos 6627, 31970-901 Belo Horizonte, MG aldo@cdtn.br
b Universidade Federal de Minas Gerais (UFMG - MG), Av. Presidente Antônio Carlos 6627, 31970-901 Belo Horizonte, MG
ABSTRACT
The instrumentation of nuclear reactors is designed based on the reliability, redundancy and diversification of control systems. The monitoring of the parameters is of crucial importance with regard to the operational efficiency and safety of the installation. Since the first criticality of a nuclear reactor, achieved by Fermi et al. in 1942, there has been concern about the reliable monitoring of the parameters involved in the chain reaction. This paper presents the current stage of the system of simulation, which is under development at the CDTN, which intends to simulate the operation of the Triga IPR-R1 nuclear reactor, involving the evolution of neutron flux and reactor power related events.
The system will be developed using LabVIEW® software, using the modern concept of virtual instruments (VIs) that are visualized in a video monitor. For the implementation of this model, computational tools and systems analysis are necessary, which help and facilitate the implementation of the simulator. In this article we will show some of these techniques and the initial design of the model to be implemented. The design of a computational system is of great importance, since it guides in the implementation stages and generates the documentation for later maintenance and updating of the computational system. It is noteworthy that the innovations developed in research reactors are normally used in power reactors. The relatively low costs enable research reactors to be an excellent laboratory for developing techniques for future reactors.
1. INTRODUCTION
The Triga (Training, Research, Isotopes, General Atomics) research reactor of the Nuclear Technology Development Center (CDTN) is used in research and training of nuclear reactor opera-tors. Operational variables are shown in analogue and digital indicators on the control console. Op-erators register manually the most important parameters of the operation. The control desk uses discrete electronic components and the logic of operation is performed by relays.
The CDTN is in a process of adopting ISO (International Organization for Standardization) standards in their laboratories to show reliability in the results [1]. According to the ISO 9000 standard, an institution must meet certain requirements to be certified. These include: measuring and monitoring processes to ensure the quality of the product / service through performance indica-tors and deviations; implement and maintain adequate and necessary records to ensure process traceability and systematic reviews of processes and the quality system to ensure their effectiveness. A graphic simulator that uses virtual instruments (VI) is under development in the CDTN re-search institute. It will meet the demand of operators and graduation and post-graduation students in the operational understanding of a nuclear reactor. In this article the project of the Triga IPR-R1 reactor simulator will be presented.
2. MATERIALS AND METHODS
2.1. DESIGN OF SIMULATION OF IPR-R1 TRIGA REACTOR
The IPR-R1 Triga nuclear research reactor was acquired from General Atomics by the Gov-ernment of the State of Minas Gerais in 1960, through the United States GovGov-ernment's "Atoms for Peace" program. It was installed in the former Institute of Radioactive Research (IPR), currently the Nuclear Technology Development Center (CDTN), one of the institutes of the Brazilian Nuclear Energy Commission (CNEN). The IPR-R1 Triga reactor was the second nuclear reactor installed in the country. Even with the long operating time, its fuel is little "burnt", about 4% on average [2], and can operate for several years in research and analysis, radioisotope production and training [3]. In Figure 1, two photographs of the reactor pool, and the core of the IPR-R1 Triga reactor are shown, in which the Cerenkov radiation can be seen when the reactor is critical and at high power.
Figure 1: Triga IPR-R1 reactor – Details of the pool and core with the reactor on [3].
Source: Mesquita
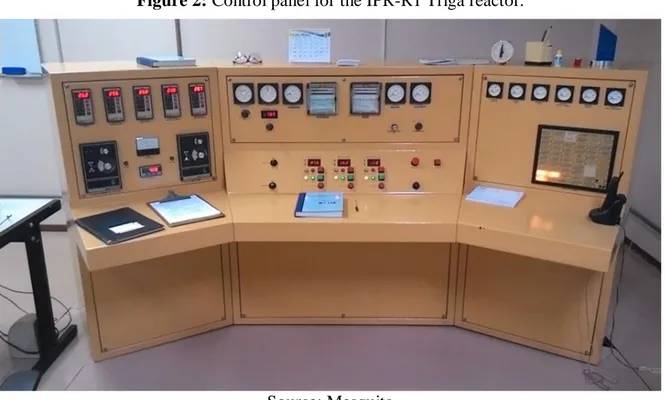
Figure 2 shows the operating console of the IPR-R1 Triga reactor, where:
• On the left panel are the meters and temperature controllers, pool water level, water conduc-tivity meters and flow controller;
• At the middle of the console are the control rod drives, registers and power indicators, peri-od indicator, reactivity indicator and neutron counter rate;
Figure 2: Control panel for the IPR-R1 Triga reactor.
Source: Mesquita 2.2. IPR-R1 Triga Reactor Operation
In order to place the Triga reactor in operation the operator must follow pre-operational and op-erational procedures [4].
The operation of the reactor can only be started after the following pre-operational conditions and / or procedures have been achieved:
a) Inspection of the operation of the control, safety and monitoring systems of the IPR-R1 Triga reactor;
b) Filling in of the Daily Checklist and the Weekly Checklist of IPR-R1 Triga for the first opera-tion in the week, observing the operating condiopera-tions for the control of the reactor specified in the list.
The operational procedures for departure are:
a) Recording of the start time of operation in the Reactor Log Book; b) Switching on the cooling system;
c) Turning on the movement of the registers; d) Completely removal of the Safety Rod;
e) Starting of the subcritical approximation by partially extracting the Shim Rod to a position close to the criticality;
f) After the reactor is close to the criticality, stopping the extraction of the Shim Rod and starting the extraction of the Regulating Rod;
g) Stabilization of the desired power level;
h) The start operation is considered finished when the desired power level remains stationary on the Linear Channel. Recording of the time, position of the rods, power level in the Linear, Loga-rithmic and Percent Power Channels in the Reactor Log Book.
The operating procedure above is the model that will be used to develop the Triga reactor simu-lator project and this project will be used to implement the simusimu-lator in the Virtual Instruments (VI) programming language. In the sections that follow, the proposed project for the simulator will be shown in diagrams.
2.3. Structured System Analysis Techniques applied to the Simulator
The use of system analysis techniques will aid in the development process of the system to be modelled [5]. Historically, the first technique approached was the Traditional Analysis, This tech-nique had only a functional approach making use of tools of texts and flowcharts. With the evolu-tion of computer systems and equipment, the structured analysis technique emerged, which, in addi-tion to the funcaddi-tional approach, has an approach to the data of the system, which uses as tools: Con-text Diagram; Data Flow Diagrams (DFD); Data Structure Diagrams (DSD); Standardization and process specifications. These techniques and tools will be described below.
3.
RESULTS AND DISCUSSION
3.1. Context Diagram
The Context Diagram shown in Figure 3 represents the most general form of the system to be simulated.
Figure 3: Context Diagram of the IPR-R1 Triga Reactor Simulator.
User / Operator
DESIGN OF THE DIGITAL SYSTEM FOR SIMULATION OF OPERATIONAL PARAMETERS OF NUCLEAR RESEARCH
REACTOR TRIGA IPR-R1 System Input Data
System Output Data
Simulator Data
Source: Author
3. First Level Data Flow Diagram
From the Context Diagram we expand and detail the previous chart to Data Flow Diagrams or DFD, which in its various levels will discretizing or detailing the system to be implemented. Figure 4 shows the first level of detail.
Figure 4: First Level Data Flow Diagram.
User /
Operator Pre-operational Check
Remove Safety Rod and calculate reactivity / power
Ready-to-operate reactor
Processes the list of Pre-operational Check
Remove the Regulating Rod and calculate the
reactor reactivity / power
Reactivity / power of the reactor
Remove the Shim Rod and calculate the reactor reactivity /
power Reactivity / power
of the reactor Set to the power
close to the desired
Remove the Shim Rod and calculate the reactor reactivity / power Reactivity / power of the reactor Reactivity / power of the reactor Database of reactor parameters
Show the operating parameters of the reactor
DFD-1 – First Level Data Flow Diagram
Set the power to the desired power Thick Power setup Fine Power Setup Source: Author
3.3. Second-Level Data Flow Diagrams
Each of the first-level DFD processes can be expanded and detailed in several levels so that the programmer can implement the simulator tool closer to the real reactor’s operation. Figure 5 pre-sents in more detail two modules of the DFD-1, which are the processes of the pre-operational check and the operation of the Safety Rod.
Figure 5: Data Flow Diagram of Pre-operational Check and Safety Rod Operation.
User / Operator
Remove Safety Rod and calculate reactivity / power
Ready-to-operate reactor
Processes the list of Pre-operational Check Reactivity / power of the reactor Set Reactor Power Operation Power Database of reactor parameters
Show the operating parameters of the reactor
Data Cooling system Pre-operational Check Recorders Linear / Logarithm Turn on recorder Control Rod Magnets Turn on Magnets To DFD-2-B Turn on cooling if power> 5kW
DFD-2-A – Pre-operational Check and Safety Rod
Reactivity / power
Source: Author
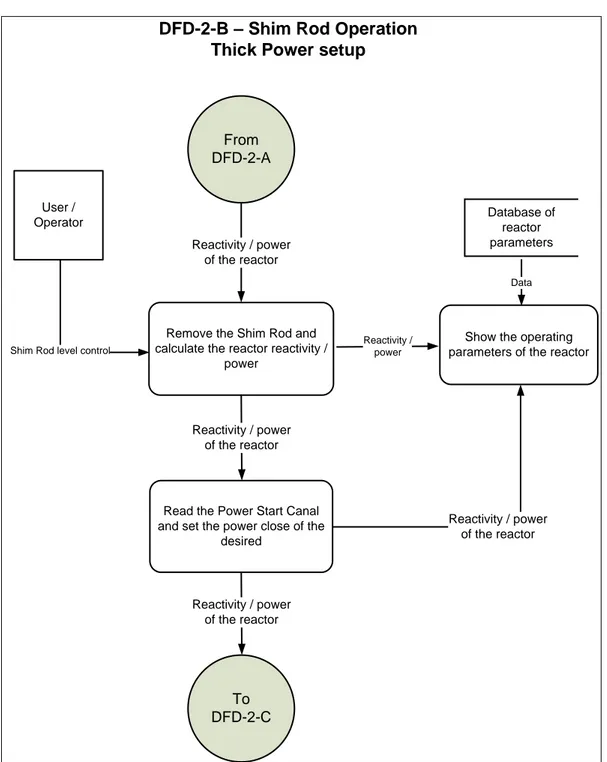
Figure 6 shows a more detailed description of the Shim Rod operation, which roughly adjusts the desired power. We can see that this DFD connects to the safety Rod DFD before and after the DFD of the Shim Rod (Figure 7) where the fine tuning of the desired power is made.
Figure 6: Shim Rod Operation Data Flow Diagram.
Remove the Shim Rod and calculate the reactor reactivity /
power Reactivity / power of the reactor Reactivity / power of the reactor Database of reactor parameters
Show the operating parameters of the reactor
Data User /
Operator
To DFD-2-C
Shim Rod level control
Reactivity / power
DFD-2-B – Shim Rod Operation Thick Power setup
From DFD-2-A
Read the Power Start Canal and set the power close of the
desired Reactivity / power of the reactor Reactivity / power of the reactor Source: Author
Figure 7: Diagram of Operation Data Flow of the Regulating Rod.
Remove the Regulating Rod and calculate the reactor
reactivity / power Reactivity / power of the reactor Database of reactor parameters
Show the operating parameters of the reactor
Data User /
Operator
Regulating Rod level control Reactivity / power
DFD-2-C – Regulating Rod Operation Fine Power Setup
From DFD-2-B
Read Power and Period until desired value Reactivity / power of the reactor Reactivity / power of the reactor Reactivity / power of the reactor To DFD-2-D Source: Author
The reactor shutdown process has been described in Figure 8, either by the intervention of the operator or by the action of an alarm that causes the shutdown of the reactor due to safety concerns.
Figure 8: Data Flow Diagram of Reactor Shutdown Operation.
Lower the control rods SCRAM Reactivity / power of the reactor Database of reactor parameters
Show the operating parameters of the reactor
Data User /
Operator
Lower the control rods Reactivity / power
From DFD-2-C
DFD-2-D – Reactor Stop Operation
SCRAM
Alarm for SCRAM Lower the control rods
4. CONCLUSION
Until now, the simulator input and output list have been carried out and the operational proce-dures of the IPR-R1 Triga reactor have been studied, as well as other simulators of nuclear reactors, and as previously seen, the simulator project was started. The presented diagrams underwent new explosions refining the functional processes.
The system described here for simulating the behavior of the operational variables of the IPR-R1 Triga reactor, is been developed using LabVIEW® software, using the modern concept of virtu-al instruments (VIs) that are visuvirtu-alized in a video monitor [6]. The system will contribute to safety, quality and reliability in the operation of nuclear reactors. This system, with minor modifications, can be transformed into a supervisory system and will provide to this reactor a modern system to monitoring, in real time, the operating variables. Operational data will be stored and are available to staff and potential research could be conducted at the facility. The use of virtual instruments with visual interface on video monitors will enable the use of this reactor in personnel formation and training in the nuclear technology.
This developing system complies with the recommendations of the International Atomic En-ergy Agency IAEA about nuclear reactor control rooms update [7] [8], [9] and [10].
5.
ACKNOWLEDGMENT
The following Brazilian institutions supported this work: Nuclear Technology Development Centre (CDTN), Brazilian Nuclear Energy Commission (CNEN), Research Support Foundation of the State of Minas Gerais (Fapemig), and Brazilian Council for Scientific and Technological Devel-opment (CNPq).
REFERENCES
[1] “ISO. International Organization for Standardization”, Available at:
http://www.iso.org/iso/home.htm, Accessed in July, 17, (2017).
[2] H.M. Dalle, “Simulação do Reator Triga- IPR – R1 Utilizando Métodos de Transporte por Mon-te Carlo”. Tese de Doutorado, Universidade Estadual de Campinas, São Paulo. (2005).
[3] Mesquita, A.Z.; Lage, A.M.F.; Martins, E.D.; Gual, M.R.; Palma, D.A.P. A human-machine in-terface for a Triga research reactor of Brazil. International Journal of Nuclear Energy, Science
and Technology (Print), v. 10, p. 369-384, (2016). DOI:
http://dx.doi.org/10.1504/IJNEST.2016.10002904.
[4] CDTN/CNEN - Centro de Desenvolvimento da Tecnologia Nuclear/Comissão Nacional de Energia Nuclear, “RASIN/Triga-IPR-R1/CDTN - Relatório de Análise de Segurança do Reator Triga IPR-R1", Capítulo 11, Volume II, (2007).
[5] J. P. Meilir, Projeto estruturado de sistemas, McGraw-Hill, São Paulo, Brasil (1988).
[6] National Instruments Co., “Measurement and Automation - Graphical Programming for Instru-mentation”. Austin, USA, 2007.
[7] IAEA - International Atomic Energy Agency. Modernization of Instrumentation and Control in Nuclear Power Plants, IAEA-TECDOC-1016, IAEA, Vienna, 1998.
[8] IAEA - International Atomic Energy Agency, “Specifications of Requirements for Upgrades Using Digital Instrumentation and Control Systems”, IAEA-TECDOC-1066, Vienna, 1999a. [9] IAEA - International Atomic Energy Agency, Modern Instrumentation and Control for Nuclear
Power Plants: A Guidebook, Technical Reports Series No. 387, Vienna, 1999b.
[10] IAEA - International Atomic Energy Agency. Specifications of Requirements for Upgrades Using Digital Instrumentation and Control Systems, IAEA-TECDOC-1066, Vienna, 1999c. [11] LAGE A. M. F, MESQUITA A. Z., and FELIPPE A. A. M. Design of a Digital System for
Operational Parameters Simulation of IPRT-R1 Triga Nuclear Research Reactor, In: INTER-NATIONAL NUCLEAR ATLANTIC CONFERENCE, 2017, Belo Horizonte, 22-27 Oct 2017. p. 10-23.
![Figure 1: Triga IPR-R1 reactor – Details of the pool and core with the reactor on [3]](https://thumb-eu.123doks.com/thumbv2/123dok_br/18280632.881626/3.892.124.779.212.453/figure-triga-ipr-reactor-details-pool-core-reactor.webp)