Cell-free Layer Measurements in Bifurcating
Microchannels: a global approach
B. Taboada
∗, D. Bento
∗, D. Pinho
∗, A.I. Pereira
‡, R. Lima
∗∗Instituto Politécnico de Bragança, Portugal &CEFT, Faculty of Engineering at University of Porto,
Portugal.
E-mail:{ brunataboada,davidbento,diana,ruimec}@ ipb. pt
‡ Instituto Politécnico de Bragança, Portugal&Algoritmi, Universidade do Minho, Portugal.
E-mail:apereira@ ipb. pt
Abstract
In the present work, in vitroblood flowing through bifurcating microchannels was studied, with
the aim of characterizing the cell-free layer (CFL). The original images were obtained by means of a high-speed video microscopy system and then processed in MatLab using the Image Processing Toolbox. The numerical data was obtained automatically and analyzed by optimization techniques using the genetic algorithm approach. The results suggest that the CFL were formed in a similar way at the upper and lower regions in all bifurcations, and the measurements can be approximated through a sum of trigonometric functions.
Keywords: Cell-free Layer. Image Processing. Nonlinear Optimization. Global Optimization.
1
Introduction
Blood flow in microcirculation shows several hemodynamic phenomena that happen at both, in vivo
and in vitro blood flowing. Hence, over the years in vitro blood studies in microchannels have been extensively performed in order to obtain an understanding of blood rheology and its flow dynamics [Goldsmith et al., 1989, Pires et al., 1992, Lima et al., 2012]. A well known hemodynamic phenomenon observed in both studies,in vivo andin vitro, states that for narrow microtubes (<300µm) both hema-tocrit (Hct) and apparent blood viscosity decreases as the tube diameter is reduced [Goldsmith et al., 1989, Pires et al., 1992, Lima et al., 2012]. The physical reasons for these phenomena and for the formation of the cell-free layer (CFL), is known as Fahraeus-Lindqvist effect that is the tendency of red blood cells (RBCs) to migrate toward the centre of the microtube resulting in a marginal CFL at regions adjacent to the wall [Caro et al., 1978]. Recently several studies showed strong evidence that the for-mation of the CFL is affected by the geometry of the microchannel [Pinho, 2011, Lima et al., 2008a, Lima et al., 2008b, Leble et al., 2011] and the physiological conditions of the working fluid, such as the hematocrit [Garcia et al., 2012, Fujiwara et al., 2009].
Although there have been several studies on the measurement of CFL thickness [Namgung et al., 2010, Kim et al., 2006] according to our knowledge there have been very few studies on the determination of CFL measurements [Bento et al., 2012, Bento et al., 2013]. For these studies image analysis is extremely important to obtain crucial information [Pinho et al., 2012].
The main purpose of the present work is to measure the CFL in a microchannels with bifurcations by means of an automatic method developed in MatLab [Bento et al., 2012, Bento et al., 2013], and characterize the CFL along this microchannel using global optimization techniques.
The paper is organized as follows. The Section 2 presents the materials used in this work and the methods that were applied in this study. The Section 3 presents a brief description of the genetic algorithm. The Section 4 presents the numerical results and some discussion. The last section presents some conclusions and future work.
2
Materials and Methods
2.1
Experimental set-up
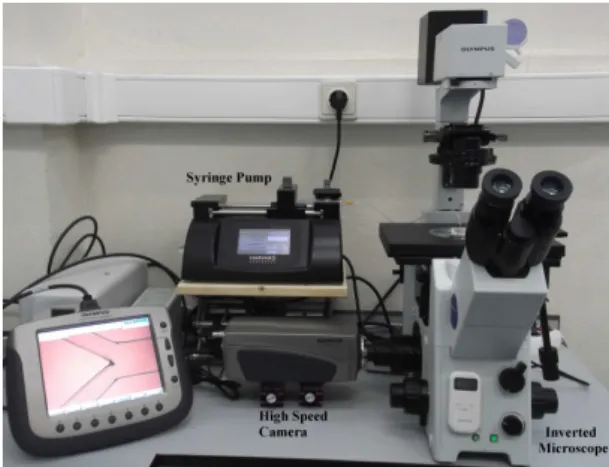
of the inverted microscope and by using a syringe pump (PHD ULTRA) a pressure-driven flow was kept constant (cf. Figure 1).
Figure 1: High-speed video microscopy system used in this staudy.
The series of microscope images were captured with a resolution of600×800pixels. All the images were recorded at the center plane of the microchannels at a rate of200frames/second and were transferred to the computer and then evaluated using image analysis techniques.
2.2
Working fluids and microchannel geometry
The blood samples used were collected from a healthy adult sheep, and ethylenediaminetetraacetic acid (EDTA) was added to prevent coagulation. The red blood cells (RBCs) were separated from the blood by centrifugation and washed twice with physiological saline (PS). The washed RBCs were suspended in Dextran 40 (Dx 40) to make up the required RBCs concentration by volume - hematocrit. In this study the Hct of 10% was used. All blood samples were stored hermetically at 4◦C until the experiment was
performed.
The microchannels fabricated for the proposed study have been produced in PDMS by a soft-lithography technique. The geometry used is a network of microchannels, containing several bifurcations and confluences. Figure 2 illustrates the configuration of the network and the regions where the CFL was measured.
Figure 2: The geometry of the network and the regions where the CFL was measured.
2.3
Image Analysis
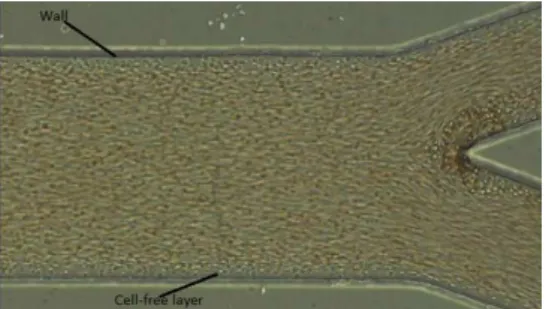
All image sequences, like Figure 3, were processed using Image Processing toolbox, available in MatLab [Matlab, 2002], and an automatic method was developed and tested [Bento et al., 2013]. The method consists in the combination of binarization of all images sequence and evaluation of all pixels using the maximum intensity.
Figure 3: The original image of blood sample flowing in a bifurcating microchannel.
Figure 4: The image after the evaluation with the maximum intensity.
With this last step it is possible to identify the region of the concentration of blood cells (RBC core) and the region where blood cells do not exist, the cell-free layer. As the final step the image (Figure 4) was converted into a binary image. Finally, the region of interest is selected and the upper and lower CFLs are automatically measured. Figure 5 represents the image after binarization.
Figure 5: Binary image which shows clearly the boundary of CFL and RBC core.
3
Global optimization method: Genetic Algorithm
4
Results and Discussion
The captured videos were analyzed and the numerical data was taken in the regions already defined in Figure 2. The flow rate used was500 nl/minand one fluid was studied with10% of Hct.
To fit the numerical data the nonlinear least squares theory was used. In each region Ui, for i = 1, ...,10, and Li, fori= 1, ...,10, we applied the nonlinear optimization problem defined as follows
min f(y)≡
NR X
k=1
(Mk−gh(y, xk))
2
s.t gh(y, xk)≥0 ∀k= 1, ..., NR
(4.1)
where (xk, Mk), for k= 1, ..., NR are the CFL measurements of the region R (defined asUi andLi, for i= 1, ...,10). The functionsgh, forh= 1, ...,3, are defined as follows
g1(y, x) =y1x 2
+y2x+y3,
g2(y, x) =y1x+y2,
g3(y, x) =sin(y1x) +cos(y2x) +y3.
(4.2)
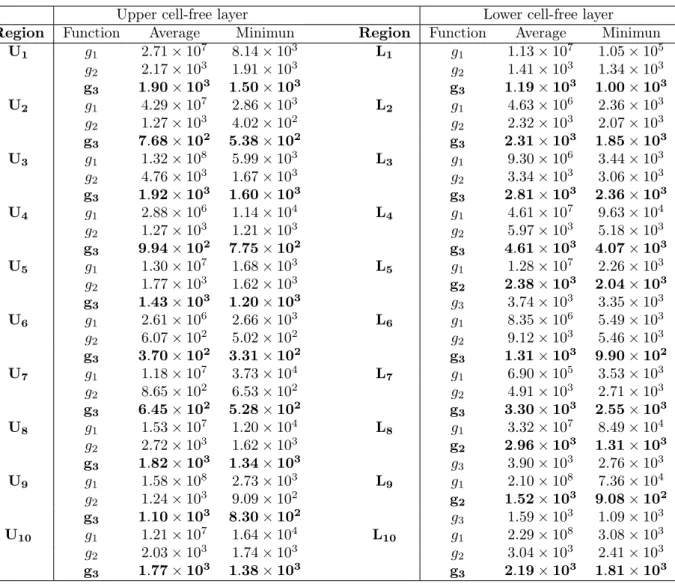
The following table presents the obtained numerical results using the genetic algorithm to solve the optimization problem (4.1). Since the genetic algorithm is a stochastic method, each problem was solved 30 times. Table 1 presents the regions where the problem (4.1) was applied, the average of the optimum value and the minimum value obtained in the all 30 runs.
Table 1: Numerical results obtained using genetic algorithm.
Upper cell-free layer Lower cell-free layer
Region Function Average Minimun Region Function Average Minimun
U1 g1 2.71×10⁷ 8.14×10³ L1 g1 1.13×10⁷ 1.05×10⁵
g2 2.17×10 3
1.91×10³
g2 1.41×10 3
1.34×10³
g3 1.90×10 3
1.50×10³ g3 1.19×10 3
1.00×10³ U2 g1 4.29×10
7
2.86×10³
L2 g1 4.63×10 6
2.36×10³
g2 1.27×10 3
4.02×10²
g2 2.32×10 3
2.07×10³
g3 7.68×10 2
5.38×10²
g3 2.31×10 3
1.85×10³
U3 g1 1.32×10 8
5.99×10³
L3 g1 9.30×10 6
3.44×10³
g2 4.76×10 3
1.67×10³
g2 3.34×10 3
3.06×10³
g3 1.92×10 3
1.60×10³
g3 2.81×10 3
2.36×10³
U4 g1 2.88×10 6
1.14×10⁴
L4 g1 4.61×10 7
9.63×10⁴
g2 1.27×10 3
1.21×10³
g2 5.97×10 3
5.18×10³
g3 9.94×10² 7.75×10² g3 4.61×10³ 4.07×10³
U5 g1 1.30×10⁷ 1.68×10³ L5 g1 1.28×10⁷ 2.26×10³
g2 1.77×10³ 1.62×10³ g2 2.38×10³ 2.04×10³
g3 1.43×10³ 1.20×10³ g3 3.74×10³ 3.35×10³
U6 g1 2.61×10⁶ 2.66×10³ L6 g1 8.35×10⁶ 5.49×10³
g2 6.07×10 2
5.02×10²
g2 9.12×10 3
5.46×10³
g3 3.70×10 2
3.31×10² g3 1.31×10 3
9.90×10² U7 g1 1.18×10
7
3.73×10⁴
L7 g1 6.90×10 5
3.53×10³
g2 8.65×10 2
6.53×10²
g2 4.91×10 3
2.71×10³
g3 6.45×10 2
5.28×10²
g3 3.30×10 3
2.55×10³
U8 g1 1.53×10 7
1.20×10⁴
L8 g1 3.32×10 7
8.49×10⁴
g2 2.72×10 3
1.62×10³
g2 2.96×10 3
1.31×10³
g3 1.82×10 3
1.34×10³
g3 3.90×10 3
2.76×10³
U9 g1 1.58×10 8
2.73×10³
L9 g1 2.10×10 8
7.36×10⁴
g2 1.24×10 3
9.09×10²
g2 1.52×10 3
9.08×10²
g3 1.10×10³ 8.30×10² g3 1.59×10³ 1.09×10³
U10 g1 1.21×10⁷ 1.64×10⁴ L10 g1 2.29×10⁸ 3.08×10³
g2 2.03×10³ 1.74×10³ g2 3.04×10³ 2.41×10³
The numerical results suggested that the functiong3fits better the CFL boundary, since the minimum value was obtained for this function. Other important fact is that the boundary has the same behavior in all bifurcations. The only exception was verified in the regions L5, L8 and L9, in these regions the best fit was obtained with the functiong2.
5
Conclusions and Future Work
In this study, we present a method to obtained automatically the CFL measurements. The CFL boundary was fitted using three different functions. The genetic algorithm was used to solve the constrained optimization problem. The best fit was obtained using the function g3, i.e. a sum of trigonometric functions. As future work, we will test more fluids with different properties and different functions to fit the CFL measurements.
Acknowledgments
The authors acknowledge the financial support provided by: BEB/108728/2008, PTDC/SAU-BEB/105650/2008, PTDC/EME-MFE/099109/2008 and PTDC/SAU-ENB/116929/2010 from FCT (Sci-ence and Technology Foundation), COMPETE, QREN and European Union (FEDER).
References
[Bento et al., 2013] Bento, D., Pinho, D., Pinto, E., Tomoko, Y., Correia, T., Lima, J., Pereira, A.I., Lima, R. (2013). Cell-free layer measurements in a bifurcation microchannel: comparison between a manual and automatic methods. 5th Portuguese Congress on Biomechanics: 359-362.
[Bento et al., 2012] Bento, D., Pinho, D., Pereira, A., Lima, R. (2012) Cell-Free Layer (CFL) Analysis in a Glass Capillary: Comparison Between a Manual and Automatic Method. AIP Conference Proceedings 1479: 786-789.
[Caro et al., 1978] Caro, C., Pedley, T., Schroter, R., Seed, W. (1978). The mechanics of the circulation.
Oxford University Press.
[Catlin et al., 2011] Catlin, G., Advani, S., Prasad, A. (2011). Optimization of polymer electrolyte mem-brane fuel cell channels using a genetic algorithm. Journal of Power Sources, 196:9407–9418.
[Fujiwara et al., 2009] Fujiwara, H., Ishikawa, T., Lima, R., Matsuki, N., Imai, Y., Kaji, H., Nishizawa, M., Yamaguchi, T. (2009). Red blood cells motions in high-hematocrit blood flowing through a stenosed microchannel. Journal of Biomechanics, 42:838–843.
[Garcia et al., 2012] Garcia, V., Dias, R., Lima R. (2012). In Vitro Blood Flow Behaviour in Microchan-nels with Simple and Complex Geometries. Journal of Biomechanics Applied Biological Engineering - Principles and Practice, Ganesh R. Naik (ed.), InTechcs, 17:394–416.
[Goldsmith et al., 1989] Goldsmith, H., Cokelet, G., Gaehtgens, P. (1989). Robin Fahraeus: evolution of his concepts in cardiovascular physiology. American Journal of Physiology, 257:H1005–H10015.
[Kim et al., 2006] Kim, S., Kong, R. L., Popel, A. S., Intaglietta, M., Jonhson J. C.(2006). A computer-based method for determination of the cell-free layer width in microcirculation. Microcirculation, 13:199-207.
[Leble et al., 2011] Leble, V., Lima, R., Dias, R. P., Fernandes, C. S., Ishikawa, T., Imai, Y., Yamaguchi, T. (2011). Asymmetry of red blood cell motions in a microchannel with a diverging and converging bifurcation. Biomicrofluidics, 5:044120.
[Lima et al., 2008a] Lima, R., Wada, S., Tanak, S., Takeda, M. (2008). In vitro blood flow in a rectangular PDMS microchannel: experimental observations using a confocal micro-PIV system. Biomedical Microdevices, 10(2):153–167.
[Lima et al., 2012] Lima, R., Ishikawa, T., Imai, Y., Yamaguchi, T. (2012) Single and two-phase flows on Chemical and Biomedical Engineering. Bentham Science, Dias et al., 513-547.
[Matlab, 2002] Eddins, S. L., Gonzalez, R. C., Woods, R. E. (2002). Digital Image Processing Using Matlab. MathWorks.
[Namgung et al., 2010] Namgung, B., Ong, P. K., Wong, Y. H., Lim, D., Chun, K. C., Kim, S. (2010). A comparative study of histogram-based thresholding methods for the determination of cell-free layer width in small blood vessels. Physiological Measurement, 31:N61–N70.
[Pinho, 2011] Pinho, D. (2011). Determination and characterization of red blood cells trajectories: a semi-automatic method. Master in Biomedical Technology, Polytechnic Institute of Bragança, Portugal, 2011 (in portuguese).
[Pinho et al., 2012] Pinho, D., Lima, R., Pereira, A. I., Gayubo, F. (2012). Automatic tracking of la-beled red blood cells in microchannels. International Journal for Numerical Methods in Biomedical Engineering, DOI: 10.1002/cnm.