\
ISBN 978-94-007-7768-2
III
Lecture Notes in Computational Vision
and Biomechanics
Volume 12
Series Editors
João Manuel R. S. Tavares. Porto. Portugal R. M. Natal Jorge, Porto, Portugal
Editorial AdvisOI)' Board
Alejandro Frangi, Sheffield, UK Chandrajit Bajaj, Austin, USA
Eugenio Onate, Barcelona, Spain
Francisco Perales, Palma de Mallorca, Spain Gerhard A. Holzapfel, Stockholm, Sweden J. Paulo Vilas-Boas, Porto, Portugal Jeffrey A. Weiss, Salt Lake City, USA John Middleton, Cardiff, UK
Jose M. García Azoar, Zaragoza, Spain Peruroal Nithiarasu, Swansea. UK
Kumar K. Tamma, Minneapolis, USA
Laurent Cohen, Paris, France
Manuel Doblaré, Zaragoza, Spain Patrick J. Prendergast, Dublin, lreland Rainald Lohner, Fairfax, USA Roger Kamm, Cambridge, USA Shuo Li, London, Canada
Thomas J. R. Hughes, Austin, USA Yongjie Zhang, Pittsburgh, USA
For further volumes:
The research related to the analysis of living struetures (8iomeehanies) has becn a source of rccent rescarch in several distincl areas af science. for example, Mathematics, Mechanical Engineering, Physics, Infonnatics, Medicine and Sport. Howevcr, for its successful achievement, numeraus rcsearch topies should be considered, such as image processing and analysis, geometric and numerical modelling, biomeehanics, experimental analysis , mechanobiology and enhanced visualization , and their applieation to real cases must be Jeveloped and more investigation is needeJ. AdditionalIy, enhanced hardware solutions and less invasive devices are demanded.
On the other hand , Image Analysis (Computational Vision ) is used for lhe extraclion of high levei information fram static images or dynamic image sequences. Examples of applications involving image analysis can be the study of motion of structure s from image sequences, shape reconstruction from images and medicai diagnosis. As a multidisciplinary area, Computational Vision considers techniques and methods fram other disciplines, such as Artificial Intelligence, Signal Processing, Mathematics, Physics and lnformatics. Despite the many research projeets in this arca, more robust and etTIcient methods of Computational Imaging are still demanded in many application domains in Medicine, and their validation in real scenarios is matter of urgency.
These two important and predominant branchcs of Science are increasingly considered to be strongly connected and related. Hencc, the main goal of the LNCV &8 book series consists of lhe provision of a comprchcnsive forum for discussion on the current state-of-the-art in these fields by cmphasizing their connection. Thc book series covers (but is not limited to):
• Applications 01' Computational Vision and Biomechanics
• Biometrics and Biomedical Paliem Analysis • Cellular Imaging and Cellular Mechanics • Clinicai Biomechanics
• Computational Bioimaging and Visualization • Compulalional Biology in Binmedical Imaging • Developmenl of Biomechanical Devices • Device and Technique Development for
Biomedical Imaging
• Digital Geomelry AIgorithms for Computa-tionalVision and Visualization
• Experimental Biomechanics • Gait & Posture Mechanics
• Multiscale Analysis in Biomechanics • Neuromuscular Biomechanics • Numerical MeLhods for Living Tissues • Numerical Simulation
• Software Development on Computational Vision and Biomechanics
• Grid and High Perfonnance Compuling for Computational Vision and Biomechanics
• Image-based Geometric Mesh GeneraLion
Modeling
• Image Proccssing and Analysis • Imagc Processing ano Visualizatilln in
BioOuios
• Image Understanding • Material MoJels • Mechanobiology • MedicaI Image Analysis • Molecular Mechanics • Multi-Modal Image Syslems • Multiscale Bioscnsors in Biomcoical
Imaging
• Multiscale Oevices and Biomems for Biomedical Imaging • Musculoskeletal Biomechanics • Sport Biomechanics
• Virtual Reality in Biomechanics • Vision Systems
and
Rui Lima . Y ohsuke
Imai
Takuji Ishikawa . Mónica S. N. Oliveira
Editors
Visualization and Simulation
of Complex Flows
in Biomedical Engineering
Editors Rui Lima
ESTiG, polytechnic lnstitutc of Bragança Bragança
Portugal
ond
CEFr, Faculdade de Engenharia da Universidade do Porto (FEUP) Porto
Portugal
Yohsuke Imai
Department of Biomedical Engineering and Robotics, Graduate School af Biomcdical Engineering Tohoku University
Sendai Japan
Takuji Ishikawa
Department af Bioengineering and Robatics, Graduate Schoal of Enginecring
Tohoku University Scndai
Japan
Mônica S. N. Oliveira
James Weir Fluids Lab, Department af Mcchanical and Aerospace Engineering University af Strathclyde
Glasgaw UK
ISSN 22 I 2-939 I ISBN 978-94-007-7768-2
ISSN 2212-9413 (eleclronic) ISBN 978-94-1l1l7-7769-9 (eBook) DOI lll. I 007/978-94-01l7-7769-9
Springer Durdrecht Heidelbcrg New York Lomlon
Libraf)' of Congress Conlral Numbcr: 2013949598
© Springer Science+Busincss Media Durdrecht 2014
This work is subjecI lo copyright. Ali righls are rescrved by lhe Publisher, whether lhe whnle ar part of lhe material is conccmed. spcciticaJly lhe rights of Iranslation. reprinling. reuse of illuslralions. recitatinn. brolldcasling. reproduclion on microlilms or in :lny olher physical W:ly, and Iransmission ar infonnation storage and retricval, eleclronic ad:lplation, computer software, or by similar ar dissimilar melhU(.Jology now known ar hcreafler devc1oped. Exempleu from this legal re servation are brieF excerpls in conneclion wilh reviews ur scholarly llnalysis or material supplied specifically for lhe purpose of being enlered and cxecuted on a computer system. for exc\usivc use by the purch:lser of lhe wurk. Duplication 01' this publicatinn ar parIs Ihereof is pcrmitted only undcr lhe provisions of lhe Copyrighl Law 01' the Publisher's location. in its current versiun, and pcrmission for use must always bc oblained from Springer. Permissions for use may be obtllined Ihrough RightsLink ai lhe Copyright Clear:mce Cenler. Violations are liable lo prosecution under lhe respcctive Copyrighl Law. Thc use of general descriptive names, regislcrcd !lames, trademarks, service marks. clC. in this publication does not imply, even in lhe absence 01' a spccilk statement. thal such names are exempl from lhe relev;mt proteclive laws and rcgulations and Ihercfore free for general use.
While lhe adviee and informalinn in this book are believed to be true and accurale ai lhe date oI' publicatinn, neither lhe authors nor lhe editors nor lhe publisher can :tecepl any legal responsibilily for :lny errors or omissions Ihat may be made. The publisher makes no warranly, cxpress or implied. wilh respcct lo the matcrial conlllined hercin.
Prinled on ucid-frce paper
Springer is part uf Springer Science+Business Media (www.springer.eom)
Preface
Over the years, flow visualization teehniques have been applied in an effort to make the invisible visibIe with the heIp of experimental and eomputational technology. These tooIs have beeome indispensabIe to understand, and be able to contrai, the ftow behavior 01' different types 01' complex biological ftuids (e.g., DNA solutions, microorganisms, blood, and olher physiological ftuids ) in living systems and biomedical devices. This book facuses on the most recent advances in visualization and simulation methads to understand the flow behavior of camplex ftuids used in biomedical engineering and other related flelds, inc1uding mechanical, chemical, and materiais engineering. It eonsiders the physiological flow behavior in large arteries, microcirculation, respiratory systems, and in bio-medicai microdevices.
This book is aimed mainly at graduate students and re searchers in the field af bioengineering seeking to provide a better understanding of the curreot state af the art and hopefully encourage the readers to grow their understanding beyaod the specific topies addressed here. The book is composed 01' 13 chapters organized ioto three main sections. The first sectian af the book presents numerical studies 00 the hemodynamics at the macro-seale leveI. The second part covers il1 vivo, numerical, and in vitro studies applied to hemodyoamics at the miero- and cellular-scale. The last part 01' the book addresses the study 01' ciliary ftow by using both numerical
and ill vivo methads.
Rui Lima Takuji Ishikawa Yohsuke Imoi Mônica S. N. Oliveira
Cell-Free Layer (CFL) Measurements
in Complex Geometries: Contractions
and Bifurcations
Susana Novais, Diana Pinho, David Bento, Elmano Pinto, Tomoko Yaginuma, Carla S. Fernandes, Valdemar Garcia, Ana I. Pereira, José Lima, Maitc Mujika, Ricardo Dias, Sergio Arana and Rui Lima
Abstract In this chapter we discuss the cell-free layer (CFL) developed adjacent to the wall Df microgeometries containing complex features representative of the
microcirculation, such as contractions, expansions, bifurcations and confluences. The microchannels with the dilt"erent geometries \Vere made af poly-dimethylsiloxane (PDMS) and we use optical techniques to evaluate lhe cell-free layer for red blood cells (RBCs) suspensions wilh different hematocnt (Hct). The
S. Novais ((8]) . D. Pinho· D. Bento· E. Pinto· T. Yaginuma· C. S. Fernande s · V. Garcia· A. I. Pereira· J. Lima· R. Dias· R. Lima
Polytechnic Institute of Bmgança. ESTiGIIPB. C. 51a. Apolónia 5301-ti57 Bragança, Portugal
e-mail: sc2005 @sapo.pl
D. Pinho
e-mail: diana @ipb.pt
D. Bento
c-muil: duvidbento @ipb.pt
E. Pinto
e-mui I: elmanopinto @ipb.pt
T. Yaginuma
e-mail: tyaginuma09 @gmail.com
C. S. Fernandes e-mail: cveiga @ipb.pt
V. Garcia
e-mail: Valdemar @ipb.pt
A. I. Pereira
e-mail: apereira @ipb.pt
J. Lima
e-mail: jllima@ipb.pt
R. Dias
c-mail: ricardod @ipb.pt
IlO S. Novais el aI.
images are captured using a high-speed vídeo microscopy system and the thickness af the cell-free layer was measured using both manual and automatic image analysis techniques. The results show that in ill \litro microcirculation , the hematocrit and the geometrical configuration have a major impact 011 the CFL thickness. In particular, the thickness af the cell-free layer increases as the Huid flows through a contraction-expansion sequence and that this increase is enhanced for lower hematocrit. In contrast, the ftow rates tested in these studies did not show a clear inftuence on the CFL thickness.
1 Introduction
Human blood is a complex ftuid composed mainly Df suspended deformable red blood cells (RBCs) wilhin plasma. The RBCs are responsible for the supply of
oxygen and nutrients to the body and removal Df carbon dioxide and metabolic wastes from tissues. Blood How behaviour in microcirculation depends on several combined efTects such as cell defonnability, flow shear rates and geometry af the microvessel , as well as biochemical and biophysical factars which may also affect
the rheological characteristics of blood.
A well known hemodynamic phenomenon , known as Fahraeus-Lindqvist effect, observed in both in vivo and in vitra studie s states that for narrow micratubes
« 300 ).Im) both hematocrit and apparent blood viscosily deereases as the tube diameter is reduced (Pires et aI. 1992, Goldsmith et aI. 1989). The physical reason behind this phenomenon is related to lhe tendeney Df the RBCs to undergo axial
migration induced by the tank treading motion of its deformable cell rnembrane as
a result Df the high shear stre sses developed around the wall, and lhe parabolic
velocity profile which forces the RBCs to move towards the center of the vessel
(Caro et aI. 1978. Garcia et aI. 2012. Maeda 1996a. Lima et aI. 2012a),
R, Lima
e-mail: ruimec @ipb.pt
D, Pinho· D. Bento· E. Pinto' R, Dias· R. Lima
CEFf, Faculdade de Engenharia da Universidade do Porto (FEUP). 4200-4 65 Porto, Portugal
A. I. Pereira
Algoritmi University of Minho, Braga. Portugal J. Lima
INESC, Faculdade de Engenharia da Universidade do Porto (FEUP). Porto. Portugal
M. Mujika . S. Aruna
CEIT and Tecnun. University or NavalTa, Paseo de Manuel Lardizábal No 1520.018 Donostia-San Sebastitín, Spain
e-mail: mmujika @ceit.cs
S. Amna
e-mail: saruna @ceit .es
CeJl-Free Layer (CFL) Measurcments 121
consequently leading to the formation of tWQ phases, i. e., a flow core with mainly
RBCs and a eell-free layer (CFL) (Lima et aI. 2009a. Fujiwara et aI. 2009, Lima et aI. 2009b). The CFL formation in mierovessels reduees the apparent viseosily Df blood and by increasing the CFL thickness the blood viscosity deereses in both
micrachannnel s and micravessels. Hence. it is extremely important to understand the behavior of the CFL in micracirculation as it contributes to the rheological properties of blood ftowing in microvessels, it modulates the nitric oxide
scav-enging eltects by RBCs and it may lead to heterogeneous distribuliol1 Df blood eells in microvaseular networks (Fedosov et aI. 2010. Kim et aI. 2009).
The cell-free layer width or thickness can be defined as the distance between lhe
wall Df the microehannel and the boundary region of lhe RBCs core. AIthough lhe formation Df the CFL in vivo (Maeda et a!. 1996b. Tateishi et aI. 1994) has been Df
great interest over many years, little information is available about this phenomena due to the limitations of the measurement techniques and the complexity of the vascular network. Various researchers have attempted to replicate this behaviour in vitro using microHuidic systems in order to better understand this phenomena
and explore its potential as a new diagnostic tool (Fujiwara et aI. 2009, Lima el aI. 2009b). Shevkoplyas et aI. (2005) developed a microdevice to isolate WBCs from a blood sample by using the margination eltect, whereas Hou et aI. (2010) have
proposed, very recently, a biomimetic separation device to separate nonnal and malaria infected RBCs. Other researchers have found several advantages to controI
and manipulate blood ftow in microftidic devices. Fujiwara et aI. (2009) have
found evidence that not only it is possible to create an artificial CFL under appropriate hemodynamic and geometrical conditions but also the CFL thickness
is strongly inftueneed by lhe RBC deformabilily.
Aecording to Kim et aI. (2009) the width of the CFL generally decreases wilh increasing hematoerit (Het). The physiologieal eonditions Df the working ftuid have also a significant inftuence 011 the CFL (Maeda 1996, Lima et aI. 2012a), and the geometry of the microchannel is another factor tha! inftuences the CFL lhickness (Sollier et aI. 2010, Faivre et aI. 2006).
Manual tracking methods have been used extensively to study the blood ftow
behaviour in microchannels. Examples are the tracking of individual RBCs
ftowing through glass eapillaries (Lima et aI. 2007, 2008, 2009a, 2012b, Suzuki et aI. 1996), straight polydimethylsiloxane (PDMS ) microchannels with reetan-guIar cross-seetion (Fujiwara el aI. 2009), stenosis (Lima et aI. 2009a), hyperbolic eontractions (Yaginuma et aI. 2011 , 2013) and bifurcalions (Leble et aI. 2011, Lima el aI. 2011 ). Manual methods can be highly reliable but lhey are relatively
time consuming and are more subject to user errors. As a result, it is essential to develop image analysis methods able to process the data automatically. Some researchers have already proposed automatic methods to obtain automatically the
trajectories Df labelled RBCs (Pinho et aI. 2012, 2013) or lo measure the CFL lhickness in mierovessels (Kim et aI. 2006, Namgung et aI. 2010).
In lhis paper we present an automatic method based in a sequence of simple steps such as the noise reduction by applying pre-processing filters and images
122 S. Novais et a!.
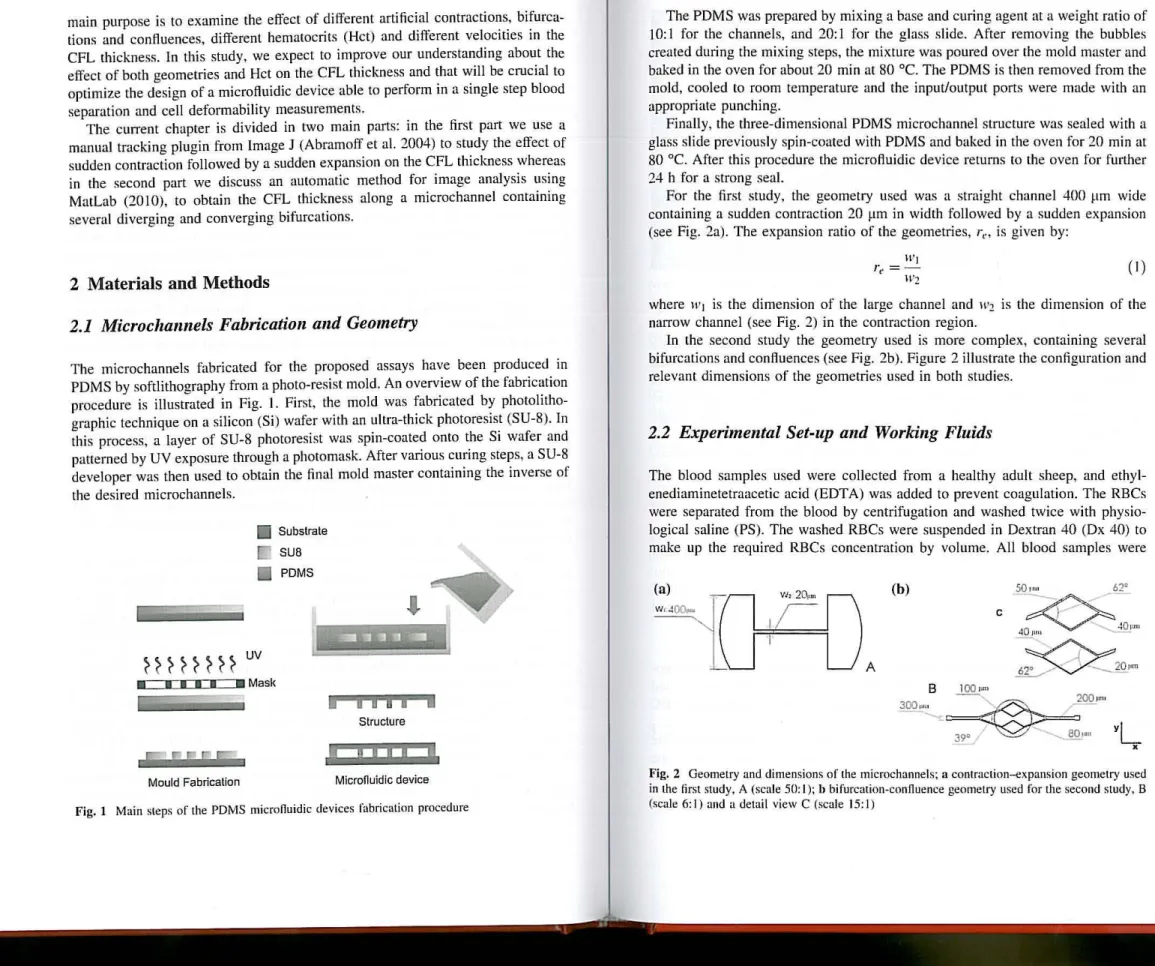
maio purpose is ta examine the effect af different artificial cantractians, bifurca-tians and canftuences, different hematocrits (Hct) and different velocities in the CFL thickness. lo this study, we expect to improve our understanding about the effect of both geometries and Hct on the CFL thickness and that will be crucial to optimize the design of a microftuidic device able to perform in a siogle step blood separatioo and cell defarmability measurements.
The current chapter is divided in twa main parts: in the first part we use a manual tracking plugin from Image J (Abramofl' et aI. 2004) to study the effect of sudden contraction followed by a sudden expansion on the CFL thickness whereas in lhe second part we discuss an automatic method far image aoalysis using MatLab (2010), to obtain the CFL thickness along a microchannel containing several diverging and converging bifurcations.
2 Materiais and Methods
2.1 Microchallllels Fabricatioll alld Geollletry
The microchannels fabricated for the propased assays have been produced in PDMS by softlithography from a photo-resist mold. An overview of the fabrication procedure is illustrated in Fig. I. First. the mold was fabricated by photolitho-graphic technique on a silicon (Si) wafer with an ultra-thick photoresist (SU-8). In this process, a layer af SU-8 photoresist was spin-coated ooto the Si wafer and patterned by UV exposure through a photomask. After various curing steps, a SU-8 developer was then used to obtain the final mald master containing the in verse of the desired microchannels.
~~~~
~ ~H
UV
~. • • • M Mask
Mould Fabricalion
Subslrate SUB
PDMS
i
i ,
8 ,
li
Structure
Microfluidic device
Fig. 1 Main sleps 01' the PDMS microfluidic devices I'abrication procedure
Cell -Free Layer (CFL) Mcasllremenls 123
The PDMS was prepared by mixing a base and curing agent at a weight ratio of 10:1 for the channels, and 20:1 for the glass sI ide. After removing the bubbles created during the mixing steps, the mixture was poured over lhe mold mas ter and baked in the oven for about 20 min at 80°C. The PDMS is then removed from the mold, cooled to room temperature and the input/output ports were made with an appropriate punching.
Finally, Lhe three-dimensional PDMS microchannel slructure was sealed with a glass slide previously spin-coated with PDMS and baked in the oven for 20 min at 80°C. After this procedure lhe microftuidic device retums to the oven for further 24 h for a strong seal.
For the first study, the geometry used was a straight channel 400 ~lm wide cantaining a sudden contraction 20 ~Lm in width folIowed by a sudden expansion (see Fig. 2a). The expansion ratio of lhe geometries, re, is given by:
( I )
where 1\11 is the dimension af the large channel and
w:!
is the dimensian af the narrow channel (see Fig. 2) in the contraction region.In the second study the geometry used is more complex, containing several bifurcations and conHuences (see Fig. 2b). Figure 2 illustrate the configuration and relevant dimensions of the geametries used in both studies.
2.2 Experime1ltal Set-up alld Workillg Fluids
The blood samples used \Vere collected from a healthy adult sheep, and ethyl-enediaminetetraacetic acid (EDTA) was added to prevent coagulation. The RBCs were separated from the blood by centrifugatian and washed twice with physio-logical saline (PS ). The washed RBCs were suspended in Dextran 40 (Dx 40) to make up the required RBCs concentration by volume. AlI blood samples were
W, 2C ~ tl l\
A
124
Fig. 3 Micro-PTV experimental sel-up
S. Novais cl a!.
stored hennetically at 4 °C until the experiment was performed at an ambient temperature af about 22°C.
The micro-particle tracking velocimetry (PTV) system used in the presenl study consists of an inverted microscope (IX71, Olympus) combined with a high-speed camera (i-SPEED LT, Olympus) (see Fig. 3). The PDMS microchannel was placed on the stage af the microscope where the ftow rate of the working ftuids was kept constant by means 01' a syringe pump (PHD ULTRA) wilh a 5 ml syringe (TERUMO ® SYRING).
The series af x-y images were captured with a resolution af 600 x 800 pixels. Ali images were recorded at the center plane af the microchannels at a rate af 600 frames/sec for Lhe first experiment and Df 200 frames/sec for the second experi-ment and were transferred to the computer and then evaluated using image analysis.
2.3 Image AlIalysis
2.3.1 Manual Mclhod
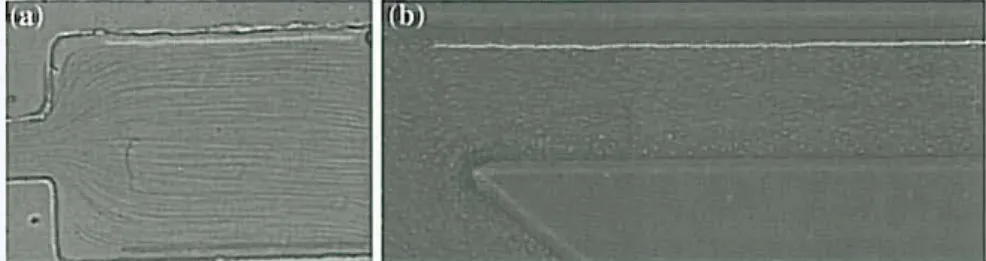
MTrackJ plugin (Meijering et aI. 2006), available for ImageJ was used to auto-matically computed the centroid 01' lhe selected RBC. AfIer obtaining x and
y positions, the data were exported for lhe determination of each individual RBC trajectory, Fig. 4.
This method was used in both studies to obtain lhe data. In the first sludy the manual data was used to measure the CFL thickness and in lhe second study the manual data was used for comparison with the measurements obtained by the proposed automatic method.
Cell-Free Layer (CFL) Measurements 125
Fig. 4 Manual melhod showing lhe trajectories of labeled RBC: a for an expansion geomelry; b ror a bifurcalion geometry
2.3.2 Au!omatic Me!hod
Ali image sequences were processed using Image Processing toolbox available in MatLab (Abramoff et aI. 2004) and an automatic method is developed and tesled, Automatic Melhod.
Firstly a median filter with a 3 x 3 pixel mask was applied to each frame to reduce the noise of the images. Then, the intensity of each pixel in the frame sequence was evaluated to obtain an image with the maximum intensity, with this step is possible identified the region of biggest concentration of blood cells and the region where blood cells don't exist, the plasma layer. As a linal step, lhe image was converted inlO a binary image. (Fig. 5b). Finally, the region of interest is selected and the upper CFL trajectories are automalically measured. Figure 5 shows lhe image processing result for the developed method.
2.3.3 Procedures lo Measure lhe CFL Thickness
To analyze the CFL thickness, measurements were laken upslream (before) and downstream (after) the artificial contraction region, as show in Fig. 6: CFL"
corresponds lo the thickness 01' lhe CFL upslream the contraction, and theCFLd to the thickness downstream the contraction. The difference 01' lhe CFL upstream and downstream of the contraction is given by:
/',.CFL = CFLd - CFL" (2)
A positive difference indicates an expansion of the CFL.
3 Results and Discussion
126
Fig. 5 Rcsults from lhe aulomatic melhod: u Original image; b Binary image obtained by Automatic Method
S. Novais ct aI.
(b)
. Ccll-.tee layer ~: - .
Fig.6 Schematic view 01' lhe contraction-expansion geomelry, idenlifying lhe relevan! variables
In the first study, the geometry used is presented in (Fig, 3a). This geomelry has
ao expansion fatio af 20 and experiments with three distinct hematocrits. 5. I () and
15 %. and three different ftow rates, 2, 5 and lO ~lllmin have been performed. The resuhs of the CFL represented in lhe diagrams below show the effeel of
hematocrit at different ftow rates, and the effect af contraction ao the CFL
thiekness. To analyse the influenee of the eontraetion on CFL thiekness the CFL
ditference between upstream (CFL,,) and downstream (CFLd) lhe contraction was
eaJculated (see Fig. 6).
In Fig. 7, one ean analyze the elTeet ofthe Het and flow rale on the thiekness of lhe CFL.
Cell-Frce Layer (CFU Mcasurcmcnts 127
Fig. 7 CFL thickness upstream and downstream for
5. 10 and 15 % Hei
3S
30
2S
E
.:
20~
~ 15
u
'; j
O<>- __ ___ - - - -00- ____ - - _- --o
)(. - - - x·
e
--2
_ _ -- 0- __
5 Q{ul/min)
- --x
10
__ Hct S% upstream .. Hct S% downstream ~ Hct 10% upstream
- - Hct 10% downstream ~Hct 15% upstream - _ - Hct 15% downstrean
The results suggest that, for a 5 % of Het, the eell-free layer has signiJkantly higher values downstream of the eontraetion. In general tenns, nothing can be eoneluded regarding the inftuenee that ftow rate may have on the thiekness of the
CFL, but eomparing the CFL before and after the eontraetion, the results suggest
that the CFL is about 4.6 times bigger after lhe contraetion than before the eontraetion.
In addition to the considerations made previously, for a 10 % Het again it is visible the inerease in CFL lhiekness after the eontraetion, and this sustained an average increase of about 5.9 times. The data from the 15 % Het, it is eoncluded
again that the CFL. as for S and 10 % ofhematoerit, is higherthan upstream ofthe
eontraction, and this contraction dowIlstream of the CFL thickness is about 4.4 times larger than the upstream of contraetion.
These results suggest that the eontractian provides an inereased thickness af the CFL. Moreover, lhe results af lhe CFL abtained from downstream of the eon-traction suggest that increasing the Het promotes a slight decrease in the CFL
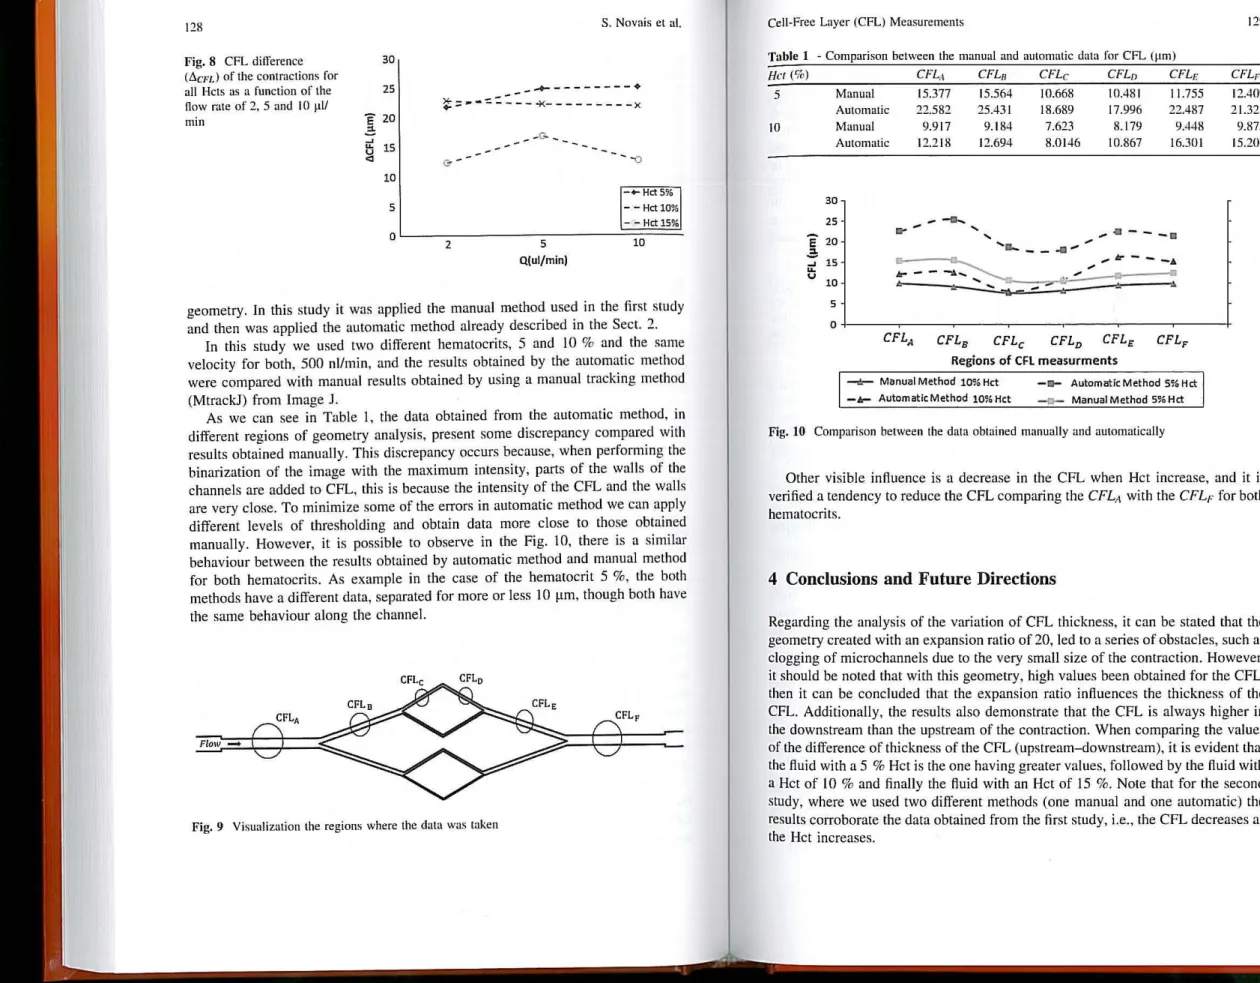
Figure 8 shows an analysis for ali Hcts in reIation to the CFL difi'erenee, /j, CFL,
of the CFL upstream and downstream af the contraction as a funetion af the ftow
rates 2, S and 10 ~l/min. GeneraUy, the result, ,uggest that an inerease in Het involves a reduetion in the di!!'erenee of the CFL. Taking as an example. for the
seeond ftaw rate (5 J.lllmin), the previous eonclusion is strengthened, sinee it is
found that for a 5 % Het there is a I'.CFL of 22.8 ~m, then with a Het 10 % there is a reduetion of 7.21 ~m for I'.CFL. FinaUy, for lhe Hei IS %, I'.CFL has lhe ,maUest
of 12.4 J.lm, i.e. the inerease in Het implies a reduction in /j, CFL and therefore a reduetian in the formation of the CFL.
For the seeond study we have used lhe geomelry presented in the (Fig. 2 b) and
the results were taken in the seetions represented in the Fig. 9, i.e., sections
CFLA.n.c represents the results obtained upstream of the middle of the geometry
128
Fig. 8 CFL dilference (6.cnJ of the contractions for
ali Hcts as a function of the Oow rate af 2. 5 and 10 ~11I
min
30
25
Ê 20
'"
~~ 15
u
.,
10 5 O 2__ G- _
_...
--5 Q(ulfmin)
S. Novais el aI.
- -o
- .... HctS% - - Hct 10%
- -- Hct 15%
10
geometry. In this study it was applied the manual method used in the first study and then was applied the automatic method already described in the Sect. 2.
In this study we used two different hematocrits, 5 and lO % and the same velocity for both. 500 nI/min. and the results obtained by the automatic method were compared with manual results obtained by using a manual tracking method (MtrackJ) from Image J.
As we can see in Table I, the data obtained from lhe automatic method, in different regions Df geometry analysis, present some discrepancy compared with results obtained manually. This discrepancy occurs because, when performing the binarization of the image with the maximum intensity, parts of the walls of lhe channels are added to CFL. this is because the intensity of the CFL and the walls are very c1ose. To minimize some of the errors in automatic method we can apply different leveis of thresholding and obtain data more c10se to those obtained manually. However, it is possible to observe in lhe Fig. 10, there is a similar behaviour between the results obtained by automatic method and manual method for both hematocrits. As example in the case of the hematocrit 5 %, the both methods have a different data, separated for more or less 10 flm. though both have the same behaviour along the channel.
FlolV _
Fig. 9 Visualization lhe regions where the data was lakcn
Ce ll-free Layer (CFL) Mcasuremcnts
Tablc I - Comparison between lhe manual and aulomatic data for CFL ütm) Hct ( %)
5 10
ê
-=
....
~v
CFL,j CFLII CFLc CFLD CFLE
Manual 15.377 15.564 10.668 10.481 11.755
Automatic Manual Aulomatic 30 25 20 15 10 5 O 22.582 9.917 12.218 25.431 9.184 12.694
... ...
18.689 7.623 8.0146 17.996 8.179 10.867 22.487 9.448 16.30 I_ .o - - _ a : ... 'o.. __ .., ~ ~ ~ .. ___ •
JJt- - - ; . -
_""""'-t.
..
_....
.
•
b _ _ ... =_ ;::: ~ _ :1.
RegiDos Df CFl measurments
~ Manual Method 10% Hct
-I&- Automatic Method 10% Hct
-o- Automatic Method 5% Hct Manual Method 5% Hct
Fig. 10 Comparison bctween the dma oblained manuully and aUlomalically
129
12.409 21.321 9.875 15.201
Other visible influence is a decrease in the CFL when Hct increase, and it is verified a tendency to reduce the CFL comparing the CFL" with the CFL,. for both hematocrits.
4 Conclusions and Future Directions
130 S. Novais et aI.
Image analysis plays un important role in this kind af studies but the image quality and the conditions af the recorded videos are also important steps for a reliable image processing. Although the proposed automatic method presenls satisfactory results, in the near future we plan to improve the quality and resolution af the images and also the processing steps to obtain results c10scr to the reality. Additionally, for the first study we also plan in the neur future to optimize the geomclry in arder to achieve cne biomedical microdevice with the capability af in ane single step. to separate the blood cells that exist in lhe CFL and measure the deformability af these cells. According to some researchers a microdevice with this skill will be interesting for a direct and rapid diagnosis of some diseases since it will allows studies with different blood cells in the presence of some diseases and separate a specific conslituent from blood.
Acknowlcdgrncnts The authors acknowlcdge the financiaI suppart provided by: PTDC/SAU-BEB/l 08728/2008, PTDC/SAU-PTDC/SAU-BEB/l 05650/2008, PTDC/EME-MFEI0991 09/2008 and PTDC/ SAU-ENB/11692912010 from FCT (Science and Technnlogy Foundation), COMPETE, QREN and European Union (FEDER). The authors are graterul to Mônica Oliveira for many valuable camments on this study.
References
Abramolf M. Magelhaes P. Ram S (2004) Image processing with image. J Int Biophotonics 11 :36-42
Bovik A (2(X19) The essential guide to image processing. Elsevier, Burlington
Caro C, Pedley T. Schroter R. Seed W (1978). The mechanics of the circulation. Oxford University Press, USA
Eddins SL. Gonzalez RC. Woods RE (2(K)2). Digital image processing using matlab. Prentice Hall, NJ
Faivre M, Abkarian M, Bickraj K, Stone H (2006) Geometrical focusing of cells in a micronuidic device: an approach to separate blood plasma. Biorheology 43: 147
Fedosov DA , Caswell B, Popel AS. Karnialiakis G (2010) Blood now and cell-free layer in microvessels. Microcirculation 17(8):615-628
Fujiwara H.lshikawa T, Lima R, Matsuki N,lmai y, Kaji H, Nishizawa M. Yamaguchi T (2009) Red blood cell motions in high-hematocrit blood flowing through a slenosed microchannel. J Biomech 42:838-843
Garcia V, Dias R. Lima R (2012). In vitro blood now hehaviour in microchannels with simple and complex geomelries. In: Dr. Ganesh R.N (ed) Applied biological engineering-principles and practice. ISBN: 978-953-51 -0412-4. lnTech. 393-416
Goldsmith H, Cokelet G, Gaehtgens P (1989) Robin Fahraeus: evollltion of his concepts in cardiovascular physiology. Am J PhysioI257:HIO05-HI0015
Hou HW. Bhagat AA, Chong AG, Mao P, Tan KS. Han J, Lim CT (2010) Deformability bused cell margination-a simple micronuidic design for malaria-infected erythrocyte separation. Lab Chip 10:2605- 2613
Kim S. Kong RL, Popel AS, lntaglietta M. Jonhson PC (2006) A computcr- hased for detennination of cell-free layer width in microcirculation. Microcirculation 13: 199-207 Kim S. Kai Ong P. YaJcin O. lntaglieua M, Johnson PC (2009). The cell-free layer in
microvascular blood flo\\'. Biorheology 46(3): 181-189
Cell-Free Layer (CFL) Measurcments 131
Leble V, Lima R. Dias~, Fe~nandcs.C.lshikawa T, Imai Y. Yamaguchi T (2011 ) Asymmetry 01' red blood ceU motiOns In a nucrochannel with a diverging and convcrging hirurcatinn. Biomicronuidics 5:044120
Lima R, Wada S. Takeda M, Tsubota K, Yamaguchi T (2007) In vitro confocal micro-PIV measurements of blood now in a square microchannel: the ell'ecl of lhe hematocrit on instantaneous velocity profiles. J Biomech 40:2752-2757
Lima R, Ishikawa T, Imai Y. Takeda M, Wada S. Yamaguchi T (2008) Radial dispersion 01' rcd
blo~d cells in blood Ilowing through glass capillaries: role 01' hcamatocrit and geometry.
J BiOmech 44:2188-2196
Lima R, Ishikawa T. Imai y, Takeda M. Wada S. Yamaguchi T (2009a) Measuremcnt 01' individual red blood cell motions under high hematocrit conditions using a confocal micro-PTV system. Ann Biomed Eng 37:1546-1559
Lima R, Oliveira MSN. Ishikawa T, Kaji H, Tanaka $. Nishizawa M. Yamaguchi T (2009b) Axisymmetric polydimethysiloxane micrnchannels for in vitro hemodynamic studies. Biofahrication 1:1-7
Lima R. Fernandes C. Dias R. Ishikawa T. Imai y, Yamaguchi T (1011). Microscale now dynamics af red blood ceUs in microchannels: an experimental and numerical analysi .~. In: Tavares J (ed) Compulalional vision and medicai image processing: recenl trends, vol 19. Springer 297-309
Lima R, Ishikawa T. Imai Y, Yamaguchi T (1012a). Blood /low behavior in microchannels: advances and future trends. In: Ricardo D.M, Rui L. Antonio A. Teresa M.M (eds) Single and Lwo-phase nows on chemical and biomedical engineering. Bcntham Sei 513-547
Lima R, Ishikawa T.lmai Y. Yamaguchi T (2012b). Confocal micro-PIV/PTV measurements of the blood now in micro-channels. In: Collins M.W, Koenig C.S (eds), Nano and micro no\\' syslcms for bioanalysis. Springer. New Ynrk, 131-152
Macda N (1996) Erythrocyte rheology in microeirculation. Jpn J PhysioI46:1-14
Maeda N, SlIzuki Y. Tanaka J. Tateishi N (1996) Erythrocyte fIow and elasticity of micrnvessels evaluated by marginal cell-free layer and now resistance. Am J Physiol 271 Heart Circ PhysinI40:H2454--H2461
MatLab (2010). The mathworks, Inc .• version 7.1 I. Image processing loolbox version 7.1 user's guide
Meijering E, Smal I, Danuser G (2006) Tracking in molecular bioimaging. IEEE Signal Process Mag 23:46--53
Nam~ung B, Ong PK. Wong YH, Lim D, Chun KC. Kim S (2010) A cnmparative study af
hlstogram-bascd thresholding of cell-frec layer wisth in small blood vessels. Physiol Meas 31:N61-N71l
Pinho. D. Lima R. Pereira AI. Gayubo F (2012) Automatic tracking of labeled red blood ceUs in mlcrochanncls. Int J for Numer Methods Biomed Eng. doi: 10. 1 002/cnm.2526
Pinho D, Lima R. Pereira AI, Gayubo F (2013). Tracking red blood cells in microchannels: a comparalive stu.dy ~el\Vee~ an [~utnmalic and a manual method. In Tavares JMRS, Natal Jorge RM (eds), Toplcs lO medicai tmage processing and computational vision. vai H. Springer
Heidelbcrg. doi 10.1007/978-94-007-0726-9 9 •
Pries AR. Neuhaus D, Gaehtgens P ( 1992) Blood viscosity in tube flnw-dependence on diameler and hematocril. Am J PhysioI263:HI770-HI778
Shevkoplyas SS. Yoshida T, Munn LL, Bitensky MW (2005) Biomimetic autnseparatioll of leukocylcs from whole blood in a microfluidic de vice. Anal Chem 77:933- 937
Sol1~er E. Cubizolles M, FouilJet Y. Achard JL (2010) Fast and continuous plasma extraction lrom whole human blood hased on expanding cell-free laycr deviccs. Biomed Microdevices
12:485-497
Suzuki Y. Tateishi N, Soutan M. Maeda N (1996) Del'onnation of erythrocytes in microvessels and glass capil1arics: cll'ects of erylhrocyte deformability. Microcirculation 3:49-57 Tatei~hi N. Suzu~. Y. Soulani M. Maeda N (1994) Flow dynamics of erythrocytes in
132 S. Novais ct aI.
Yaginumu T. Oliveira MSN. Lima R. Ishikawu T, Yamaguchi T (201 I). Rcd blood ceU dcformation in flows through a PDMS hypcrbolic microchunncl. In: Proccedings of TechConncct World 20! !- Microtech Conference and Expo, vol 2. Boston, USA, p 505 Yaginuma T, Oliveira MSN, Lima R, Ishikawa T, Yamaguchi T (2013). Human red blood cell