doi: 10.1590/0101-7438.2015.035.02.0363
VENDOR AND LOGISTICS PROVIDER SELECTION IN THE CONSTRUCTION SECTOR:
A PROBABILISTIC PREFERENCES COMPOSITION APPROACH
Pauli Adriano de Almada Garcia* and Annibal Parracho Sant’Anna
Received September 12, 2013 / Accepted February 20, 2015
ABSTRACT. The main purpose of the present work is to present an application of the probabilistic preferences composition method to the vendor and carrier selection process in the construction sector of the Southern Region of Rio de Janeiro state, in Brazil. The traditional measures associated with vendor and carrier evaluation are considered in the model and are combined through a preferences composition, which considers the options’ uncertainties. In the application, we considered three different suppliers of sand for construction and three different logistics providers, two of them outsourced. Our intention was to verify if outsourcing can be considered a better solution, as proposed by many authors. The results show that outsourcing is the best option for different probabilistic composition points of view as well as when the overall evaluation is obtained by average composition.
Keywords: probabilistic preferences composition, vendor and logistics providers selection, construction sector.
1 INTRODUCTION
The formation of alliances or outsourcing arrangements to satisfy certain logistics needs is not a new phenomenon. Laarhoven & Sharman (1994) already refer to many companies channeling efforts into forming partnerships with logistics service providers to reduce costs. Outsourcing of logistics services has increased over the past 30 years, as has academic interest in the arrange-ment. According to Blanchard (2008), annual spending on outsourced logistics services were at that time around USD 150 billion, while in 1993, according to Barks (1994), the figure was some USD 10 billion a year. This expansion has been even greater in Asia due to the rapid economic expansion of China and India (Bhatnagar, Sohal & Millen, 1999; Kim, Hoon Yang & Kim, 2008).
Economic growth in Brazil, along with the country’s great need to expand its infrastructure, has been a boon to the construction sector. In the last years the civil construction sector has
*Corresponding author.
accounted for above 5% of the country’s gross domestic product (GDP). In the words of Paulo Safady Sim˜ao, president of the Brazilian Construction Industry Chamber (CBIC), the sector has become “a big player” in the overall economy (Peduzzi, 2011). As a result, following the example of many other sectors, a small but significant number of construction companies have been adopting supply chain management (SCM) for the purpose of improving their performance in an increasingly competitive market (Saad, Jones & James, 2002).
As stated by Safa et al. (2014), in the construction sector, the cost of materials is around 55% of the total cost and may affect approximately 80% of the project schedule. Masi et al. (2013) stated that in engineering, procurement and construction companies, the average volume of acquisition can reach a peak of 97% of the costs.
According to Vrijhoef & Koskela (2000), supply chain management in the construction sector has four main aspects:
(i) focus on the interface between the supply chain and the building site with the objective of reducing costs and the duration of the activities at the site;
(ii) focus on the supply chain itself, seeking to reduce logistics costs, lead time and inventories;
(iii) focus on transferring activities from the worksite to the supply chain; and
(iv) focus on integrated management of the supply chain and building site.
Further according to the authors, in structural and functional terms, the supply chain for the construction industry has the following elements:
(i) it is a chain that converges to the construction site;
(ii) it is a temporary chain; and
(iii) it is a typical make-to-order chain, where each project creates a new model or prototype.
For this purpose, the next section summarizes the fundamentals of the assessment of supply and transport. Since this assessment involves multiple criteria, in the third section we discuss the probabilistic preferences composition method, before applying it to select combinations of vendors and logistics providers and discussing the results in the fourth section. In the fifth section we present our conclusions and recommendations for future research.
2 ASSESSMENT OF VENDORS AND LOGISTICS PROVIDERS
The present section succinctly discusses the evaluation of suppliers and logistics providers, to identify the criteria commonly employed in the literature for that assessment. This will serve as the basis for explaining the probabilistic preferences composition method and prepare its appli-cation to the selection problem here considered.
2.1 Evaluation of logistics provider
According to Wadhwa & Rivindran (2007), in the current competitive scenario it is impossible to produce at low cost and with high quality without adequate supply of materials. Therefore, the most important decision is the selection and maintenance of a competent group of vendors. Here our attention is focused on the prioritization of suppliers. According to Weber et al. (1991), the selection problem involves an assessment to reach two basic decisions: which supplier and how much to acquire from such supplier. Our focus here is not on the quantity to be acquired, but rather on which supplier should have priority.
The approaches commonly used for vendor selection, as stated by Bhutta (2002), are based on: (i) total cost, (ii) multi-attribute utility theory, (iii) multi-objective programming, and (iv) ana-lytical hierarchy processes. According to Wadhwa & Rivindran (2007), besides these aspects, different mathematical and/or statistical approaches, including models based on game theory, have been proposed to solve this type of problem. De Boer (2001) contains a review of the techniques used to aid the selection of vendors.
Further according to Wadhwa & Rivindran (2007), the choice of suppliers is basically a prob-lem with multiple criteria. Among the multi-criteria techniques, the standouts are data envelop-ment analysis (DEA) (Weber, 1991; Shirouyehzad, Hosseinzadeh & Dabestani, 2009; Azadeh & Alem, 2010), analytical hierarchy processes (Bai, 2008; Wen-wen et al., 2010) and grey rela-tional analysis (Li, Wang & Chen, 2008; Li, 2009; Yang & Wu, 2010; Rajesh & Ravi, 2015).
Hirakubo & Kublin (1998) reached the following conclusions: (a) the relative importance of selection criteria depends on the type of product or material, with price being the most important for standardized products and quality the most important in custom-made products, (b) price is most important in low-risk situations, (c) when such products are customized, more emphasis should be placed on the vendor’s characteristics, like location, technical capacity, manufacturing capacity, etc., (d) acquisition from a current supplier was not important for any of the products analyzed, since customers are disposed to change vendor when it is more convenient, (e) stan-dardized products are associated with low acquisition risk, and purchasing from suppliers with good reputations simplifies the decision process, and (f) for products associated with high risk the supplier’s capacities are more important and their customers are more willing to invest in the pursuit of quality.
It must be mentioned that the above study was carried out in Japan and focused on two products that are not related to the construction sector. Nevertheless, we believe it is possible to start an investigation based on these considerations, since we found no other study in the scientific literature for products in the construction area exploring the Brazilian context. Obviously this fact can cause uncertainties in the process, but these are contemplated in the method proposed for treatment of the data, i.e. composition of probabilistic preferences.
2.2 Assessment of logistics providers
According to Ballou (1993), transport is the most visible and important element of the logistics cost in most companies, accounting for up to 60% of their expenses. The transport costs, as stated by Fleury et al. (1997), are divided into fixed and variable, with the fixed costs further divided into operational and administrative overhead.
Therefore, adequate analysis/selection of logistics providers to compose the logistics chain with vendors is necessary. Bardi (1973) presented the relative importance of 21 factors employed to assess logistics providers, while Gibson et al. (1993) compared the level of importance of dif-ferent selection criteria used by shippers that have formal programs to choose logistics providers with those that do not have these programs. For the first group, the following priority ranking was found: (i) history of promptness, (ii) quality, (iii) availability of equipment, (iv) service to the client, and (v) discount rates. For the second group (firms without a formal logistics provider selection program), the authors found the following order of priority: (i) discount rates, (ii) his-tory of promptness, (iii) quality, (iv) availability of equipment, and (v) service to the client.
Murphy et al. (1997) compared different criteria to evaluate delivery services from the standpoint of shippers and carriers and concluded that there is a strong correlation between them.
As mentioned, the assessment of vendors as well as logistics providers involves analysis of multi-ple criteria, causing a certain commulti-plexity in the process. In this study we carry out a joint analysis of vendors and logistics providers. The next section presents the probabilistic preferences com-position method.
3 PROBABILISTIC PREFERENCES COMPOSITION
In addition to the existing techniques to support decisions involving multiple criteria mentioned in Section 2.1, the imprecision involved in the present application suggests the use of the com-position of probabilistic preferences (CPP) method. CPP, as proposed by Sant’Anna (2002a), is an approach developed to take into account the uncertainties in preference evaluations. Accord-ing to Roy (1985), multi-criteria support to decisions is an attempt to provide answers, through a clearly specified model, to questions raised by the entities involved in the decision-making process. By considering the uncertainties in the model specification, the CPP model more nearly reflects the reality.
CPP, according to Sant’Anna (2005), permits objectively combining classifications according to different criteria. In CPP, the classification of options is the result of the composing preferences according to each of the multiple criteria involved in the analysis measured as probabilities. After assessing the preferences based on each criterion by means of probabilities, the overall preference can be evaluated by comparing joint probabilities (Sant’Anna, Nogueira & Rabelo, 2011).
3.1 Probability of being the best or worst option
From an operational perspective, the starting point is to rank the options according to each cri-terion. For a measure of preferences based on the level or degree of presence of some attribute, the relative position of the option can be obtained by numerical values regarding cost, distance, etc. In other circumstances, the attributes cannot be measured quantitatively. In these cases, the base is composed of linguistic classifications such as low, moderate, high, etc., inducing a rep-resentation similar to fuzzy classifications (Zadeh, 1965). Regardless of the case, it is possible to establish an order of priority by means of determining the preferences, depending on the type of criterion – the higher the better, the smaller the better or the closer to some chosen value the better. For the case of linguistic classifications, a Likert scale can be considered.
The probability of an option being the best according to each criterion is computed by the integral of the joint density function of the option under analysis, considering an interval for which this option is the best among all options. To compute this probability, we recommend considering the amplitude of the data for the criterion, taking into account the interest in enabling the switching of position among all the options. Equation (1) presents this computation.
Mik =
Uik
Lik
⎡
⎣
n
j=1
Xik
Lj k
fXj k(x′)d x′
⎤
⎦fXik(x)d x (1)
In Equation (1), Lik andUik are, respectively, the lower and upper bounds of the domain of a
random variableXik that represents the preference for optionkaccording to criterioni, whilen
is the number of options being analyzed and f is the probability density function. The product sequence inside the brackets is the product of the probabilities that the variables are lower than Xik, P(X−k < Xik), for all the other options involved in the analysis. This product carries the
implicit hypothesis of independence of the disturbances of the evaluations of different options. Note thatXikis compared to the distributions of the other positions,Xj k. After making this
com-parison for each possible value ofXi, since it is a random variable, the next step is to calculate
the expected value of this product sequence according to the distribution ofXi. This calculation
must be performed for each option in each criterion. Therefore,Mikis the probability that option
kis the best one according to criterioni.
If the aim is to calculate the probability that the option is the worst, given the level of criterioni for optionk, equation (2) is used.
mik =
Uik
Lik
⎡
⎣
n
j=1
Uj k
Xik
fXj k(x′)d x′
⎤
⎦ fXik(x)d x (2)
Note that, in this case, the value of the variable Xik is the lower limit of the integrals in the
product sequence in brackets.
3.2 Composition of the probabilistic preferences
Having calculated the values of the options’ probabilities according to each criterion, the next step is to combine the probabilistic preferences to generate an overall probabilistic preference.
Pairwise comparison of the criteria may also be employed as in AHP in a first step to derive these probabilities of choice. The difficulties involved in the evaluation of inconsistencies in such an approach when the number of criteria is not small and the possibilities of rank reversal are discussed for instance by Gomes & Andrade (2012) and Ishizaka (2012).
To deal with more general situations, the dependence between the criteria can be considered di-rectly to determine the overall preferences in terms of joint probabilities of preference. Modeling the dependence is also subject to distortions, while the probabilistic assessment to the preferences allows for developing and comparing evaluations based on simple assumptions on dependence. Different joint probabilities can be employed, depending on the point of view considered. The viewpoints can be characterized in terms of the choices between extreme positions in two basic orientations, or axes: optimisticversuspessimistic and progressive versus conservative.
With respect to the progressiveversusconservative axis, the analyst pays more attention to the probabilities of maximizing the preference. The progressive evaluator looks at the options that are first in excellence, while the conservative evaluator examines them by their ability of not minimizing the preference. The term conservative can be defined as being risk averse, while the term progressive applies to the aim of attaining higher standards.
In the optimistic versus pessimistic axis, the optimistic evaluator is considered satisfied if at least one of the criteria is the best. All the criteria are considered, but the composition employs the conjunction “or”. The joint probability is computed so as to maximize the preference accord-ing to at least one of the criteria. On the other hand, the pessimistic evaluator prefers options that satisfy all the criteria simultaneously. In this case, the conjunction “and” is used and the joint probability is that which maximizes (or does not minimize) simultaneously the preference according to all the criteria. The expressions optimistic and pessimistic are related to the idea of believing that the most favorable, or least favorable, criterion will prevail, respectively.
By combining the positions at the extremes of the two axes, four measures are generated:
(i) optimistic-conservative (OC) –OCj =1−ci=1mi j,
(ii) optimistic-progressive (OP) –O Pj =1−ci=1(1−Mi j),
(iii) pessimistic-conservative (PC) – PCj =ci=1(1−mi j), and
(iv) pessimistic-progressive (PP) –P Pj =ci=1Mi j.
For all the cases, the product sequence varies ini, i.e., along the criteria considered. As described in Section 3.1, Mik is the probability that optioni is the best for criterionk andmik is the
probability that optioniis the worst criterionk. All the general probabilities described are based on the premise of independence of the criteria. For the case of dependent criteria, see Sant’Anna (2009).
4 CASE STUDY
The criteria considered are those described in Sections 2.1 and 2.2, combined according to Garcia (2005) in the following form:
• Price – unit price of the good supplied plus the unit delivery cost;
• Supply failures – number of times the store is unable to sell the product due to failure of
supply/delivery;
• Delivery – percentage of deliveries made on time;
• Quantity – percentage supplied that satisfied the quantity ordered;
• Quality – percentage supplied within the required specifications.
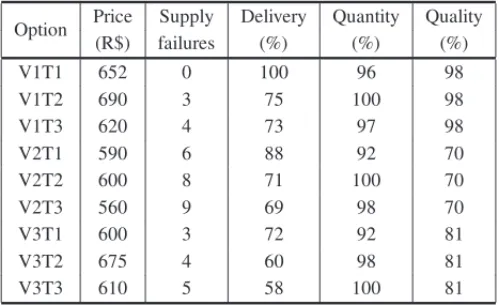
To obtain the price was considered the price charged by the supplier plus the delivery cost divided by the quantity transported. The supply failures were calculated based on the store’s history of being unable to make sales due to lack of the product. For delivery, were considered management documents indicating the interval between the moment the order was placed and the moment of delivery minus the promised delivery time frame. For the case of the quantity supplied, the delivery invoices and control records of orders placed and received were analyzed. For quality, the same documents were inspected to note any differences between the specifications of the products ordered and of those delivered. In the case of sand, the product considered in this study, there are three types by grain size (fine, medium and coarse) and two according to condition (washed or impure). Table 1 shows the consolidation of these data.
Table 1– Consolidated data for comparison of vendors and logistics providers.
Option Price Supply Delivery Quantity Quality (R$) failures (%) (%) (%)
V1T1 652 0 100 96 98
V1T2 690 3 75 100 98
V1T3 620 4 73 97 98
V2T1 590 6 88 92 70
V2T2 600 8 71 100 70
V2T3 560 9 69 98 70
V3T1 600 3 72 92 81
V3T2 675 4 60 98 81
V3T3 610 5 58 100 81
In Table 1, V1, V2 and V3 are the sand vendors considered in the study and T1, T2 and T3 are the logistics providers. T1 is the internal transporter (meaning the store picks up the product at the vendor’s establishment).
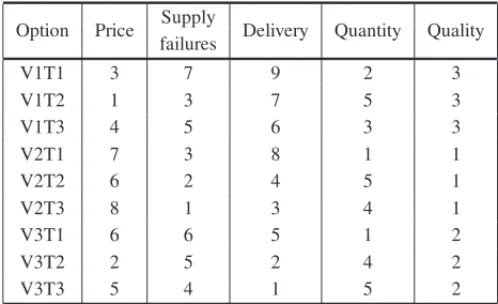
received a score of 1 for being the highest. For the case of supply failures, the lower the better was also the principle for ranking. For the criteria delivery, quantity and quality, the ranking was based on the higher the percentage the better. The results of this ranking procedure are shown in Table 2.
Table 2– Ranks associated with the options according to each criterion.
Option Price Supply Delivery Quantity Quality failures
V1T1 3 7 9 2 3
V1T2 1 3 7 5 3
V1T3 4 5 6 3 3
V2T1 7 3 8 1 1
V2T2 6 2 4 5 1
V2T3 8 1 3 4 1
V3T1 6 6 5 1 2
V3T2 2 5 2 4 2
V3T3 5 4 1 5 2
In the present case, for simplicity’s sake the triangular distribution was considered in the treat-ment of the uncertainties associated with every criterion. This distribution also has the advantage of, together with the transformation into ranks, allowing reduction of the influence of possible errors in the initial measures. This is due to the use of an asymmetric triangular distribution, which extends further to the side opposite the observed position for the option chosen. In the present case, this is done by adopting the following parameters for each criterion: (i) lower bound of the domain given by the lowest value among the options minus 10% of the amplitude, and (ii) upper bound of the domain given by the highest value plus 10% of the amplitude. As already indicated, a probability distribution is considered for each option and each criterion, with the mode being the value of the option according to the criterion.
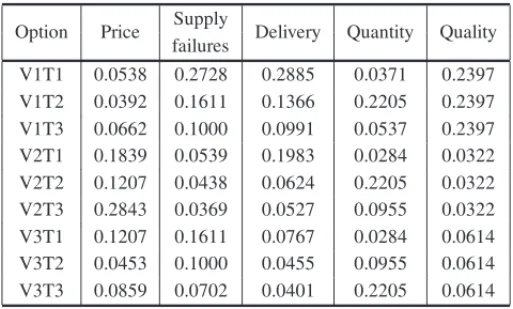
By applying Equation (1), was calculated the probability of each option being the best according to each criterion. Results are presented in Table 3.
To obtain the probabilities that the options are the worst according to each criterion, Equation (2) was used. The results are displayed in Table 4.
After calculatingMik andmik, it is necessary to ascertain the general preferences, as discussed
in Section 3.2. In the present case, we considered all types of compositions discussed. Table 5 presents the results.
Table 3– Probabilities of the options being the best by each criterion (Mik).
Option Price Supply Delivery Quantity Quality failures
V1T1 0.0538 0.2728 0.2885 0.0371 0.2397 V1T2 0.0392 0.1611 0.1366 0.2205 0.2397 V1T3 0.0662 0.1000 0.0991 0.0537 0.2397 V2T1 0.1839 0.0539 0.1983 0.0284 0.0322 V2T2 0.1207 0.0438 0.0624 0.2205 0.0322 V2T3 0.2843 0.0369 0.0527 0.0955 0.0322 V3T1 0.1207 0.1611 0.0767 0.0284 0.0614 V3T2 0.0453 0.1000 0.0455 0.0955 0.0614 V3T3 0.0859 0.0702 0.0401 0.2205 0.0614
Table 4– Probabilities of the options being the worst by each criterion (mik).
Option Price Supply Delivery Quantity Quality failures
V1T1 0.1309 0.0449 0.0401 0.1357 0.0322 V1T2 0.2993 0.0535 0.0527 0.0399 0.0322 V1T3 0.0932 0.066 0.0624 0.0765 0.0322 V2T1 0.049 0.1235 0.0455 0.2817 0.2397 V2T2 0.0582 0.1944 0.0991 0.0399 0.2397 V2T3 0.0423 0.3118 0.1366 0.0524 0.2397 V3T1 0.0582 0.0535 0.0767 0.2817 0.0614 V3T2 0.1972 0.066 0.1983 0.0524 0.0614 V3T3 0.0717 0.0864 0.2885 0.0399 0.0614
Table 5– General preferences compositions.
Option (1-OC)* OP PC PP Mean
V1T1 1.03E-06 6.42E-01 3.34E-01 3.77E-05 4.94E-01 V1T2 1.08E-06 5.88E-01 4.16E-01 4.56E-05 5.01E-01 V1T3 9.46E-07 4.55E-01 2.90E-01 8.44E-06 4.36E-01 V2T1 1.86E-05 4.18E-01 5.65E-01 1.80E-06 4.96E-01 V2T2 1.07E-05 4.05E-01 5.01E-01 2.34E-06 4.77E-01 V2T3 2.26E-05 4.28E-01 5.90E-01 1.70E-06 5.05E-01 V3T1 4.13E-06 3.79E-01 4.45E-01 2.60E-06 4.56E-01 V3T2 8.30E-06 3.04E-01 4.65E-01 1.21E-06 4.42E-01 V3T3 4.38E-06 4.03E-01 4.56E-01 3.27E-06 4.65E-01
Considering each form of composition, it was found V2T3 as the best option in the pessimistic and conservative approach. V1T2 is the best in the pessimistic and progressive approach, VIT3 is the best in the optimistic and conservative approach, and VIT1 is the best in the optimistic and progressive approach.
Since the priority is to maximize the company’s profit, the progressive approach should be adopted. Likewise, the prioritization of profit leads to the desire to stimulate the maximization of efficiency in each possible aspect, leading to the adoption of a pessimistic approach. Thus, the preferred combination of vendor and logistics provider would be V1T2.
Note that both the choice of V1T2 and of V2T3 excluded the use of T1, which is the internal transporter. In addition to this, both in the pessimistic-progressive ranking and that established by the mean, T1 is not the first option in any combination with vendors. With the fixing of any vendor (V1, V2 or V3), the internal transporter always is in second place.
From this analysis it can be concluded that independent of the vendor, logistics provider T1 is not an attractive option. That finding indicates that it is not a good option in the present case to maintain an internal carrier. Obviously a decision like this should be based on other factors as well. However, apart from these other factors not considered in this study, the result is that it is better to outsource the transport of this product.
5 CONCLUSIONS AND RECOMMENDATIONS
This article examines the selection of vendors and logistics providers in light of an approach that contemplates the uncertainties related to the evaluator’s preferences with respect to each of the criteria considered. This was done in two forms, first by considering each option’s probability of being the most preferred according to each criterion, leading to the results shown in Table 3, and second by considering each option’s probability of having the least preference according to each criterion, as shown in Table 4. Then, still within a probabilistic approach, we calculated the overall preferences, considering all the criteria simultaneously in the analysis. These results were obtained by considering two axes for evaluation, as discussed in Subsection 3.2, and can be seen in columns 2, 3, 4 and 5 of Table 5. The sixth column in this table presents a combination of the four preferences composition options by means of their arithmetic mean.
Our secondary aim was to verify the role of an internal transporter in light of the concept of outsourcing and its potential advantages. According to the results discussed after Table 5, the internal transporter (T1) was not preferred. From the standpoint of the individual approaches, only by the optimistic-progressive point of view was the internal transporter chosen as the best, combined with vendor 1. In contrast, in all other compositions, T1 was not the best in any combination.
REFERENCES
[1] AZADEH A & ALEM SM. 2010. A flexible deterministic, stochastic and fuzzy data envelopment analysis approach for supply chain risk and vendor selection problem: Simulation analysis.Expert System with Applications,37(12): 7438–7448.
[2] BAI H. 2008. A fuzzy AHP based evaluation method for vendor-selection. In: Annals of the 4th IEEE International Conference on Management of Innovation and Technology(ICMIT) 2008, 4, pp. 1077–1081.
[3] BARKSJV. 1994. Logistics for hire.International Business,7(5): 36–38.
[4] BHATNAGARR, SOHALAS & MILLENR. 1999. Third party logistics services: A Singapore per-spective.International Journal of Physical Distribution & Logistics Management,29(9): 569–587. [5] BHUTTAKS & HUQF. 2002. Supplier selection problem: A comparison of the total cost of
owner-ship and analytical hierarchy process.Supply Chain Management,7(3-4): 126–35. [6] BLANCHARDD. 2008. Strategic reasons for using a 3PL.Industry Week,257(6): 80.
[7] DEBOERL & LABROE & MORLACCHIP. 2001. A review of methods supporting supplier selection. European Journal of Purchasing and Supply Management,7: 75–89.
[8] FLEURYPF, AVILAM & WANKEP. 1997. Em busca da eficiˆencia no transporte terceirizado: estru-tura de custos, parcerias e eliminac¸˜ao de desperd´ıcios.Revista Gest˜ao & Produc¸˜ao,4(2): 219–233. [9] GARCIA PAA, NEVES JCS, JACINTO CMC & DROGUETT EAL. 2005. Utilizac¸˜ao de An´alise
Relacional Grey no gerenciamento da cadeia log´ıstica. In: XXXV Simp´osio Brasileiro de Pesquisa Operacional.
[10] GOMES LFAM & ANDRADERM. 2012. Performance evaluation in assets management with the AHP.Pesquisa Operacional,32(1): 31–53.
[11] HIRAKUBON & KUBLINM. 1998. The relative importance of supplier selection criteria: The case of electronic components procurement in Japan.International Journal of Purchasing and Materials Management,34(2): 19–24.
[12] ISHIZAKAA. 2012. Clusters and pivots for evaluating a large number of alternatives in AHP.Pesquisa Operacional,32(1): 87-101.
[13] KIMC, HOONYANGK & KIMJ. 2008. A strategy for third-party logistics systems: A case analysis using the blue ocean strategy.The International Journal of Management Science,36: 522–534. [14] LAARHOVENPV & SHARMANG. 1994. Logistics alliances: The European experience.McKinsey
Quarterly,1: 34–49.
[15] LI W, WANG Y & CHEN A. 2008. Grey relational evaluation on vendor selection based on e-business. In:Annals of the International Conference on Electronic Commerce and Security(ICECS), p. 509–513.
[16] LI W. 2009. Using grey multipurpose decision system for vendor selection based on e-business, Proceedings of the 2009 Information Technology and Computer Science Conference, pp. 27–30. [17] MASID, MICHELIGJL & CAGNOE. 2013. A meta-model for choosing a supplier selection
tech-nique within EPC company.Journal of Purchasing & Supply Management,19: 5–15.
[19] PEDUZZIP. 2011. Construc¸˜ao civil ser´a o grande destaque da economia brasileira em 2012, prevˆe entidade do setor. Agˆencia Brasil – Empresa Brasil de Comunicac¸˜ao. Available at:
< http://agenciabrasil.ebc.com.br/noticia/2011-12-08/construcao-civil-sera-grande-destaque-da-economia-brasileira-em-2012-preve-entidade-do-setor>. Retrieved on 8 September 2012.
[20] RAJESHR & RAVIV. 2015. Supplier selection in resilient supply chain: a grey relational approach. Journal of Cleaner Production,86: 343–359.
[21] SAADM, JONES M & JAMESP. 2002. A review of the progress towards the adoption of supply chain management (SCM) relationships in construction.European Journal of Purchasing & Supply Management,8: 173–183.
[22] SAFAM, SHAHIA, HAASCT & HIPELKW. 2014. Supplier selection process in an integrated construction materials management model.Automation in Construction,48: 64–73.
[23] SANT’ANNAAP. 2002. Aleatorizac¸˜ao e composic¸˜ao de medidas de preferˆencia.Pesquisa Opera-cional,22: 87–103.
[24] SANT’ANNA AP. 2005. Composic¸˜ao probabil´ıstica de crit´erios na avaliac¸˜ao de cursos. Revista Brasileira de P´os-Graduac¸˜ao,2(3): 40–54.
[25] SANT’ANNAAP. 2009. Probabilistic majority rules: a new approach to the composition of social preference.International Journal of Industrial and Systems Engineering,4: 19–31.
[26] SANT’ANNAAP. 2010. Probabilistic Composition of Criteria for Schedule Monitoring.Pesquisa Operacional,30(3): 751–767.
[27] SANT’ANNAAP, NOGUEIRAHD & RABELOLM. 2011. Comparac¸˜ao entre m´etodos multicrit´erios em um modelo para avaliac¸˜ao da qualidade de ativos de renda vari´avel.Revista de Financ¸as Apli-cadas,1(1): 1–21.
[28] SHIROUYEHZADH, HOSSEINZADEHLF & DABESTANIR. 2009. A data envelopment analysis approach based on the service quality concept for vendor selection.Annals of the International Con-ference on Computer & Industrial Engineering, pp. 426–430.
[29] VRIJHOEFR & KOSKELAL. 2000. The Four Roles of Supply Chain Management in Construction. European Journal of Purchasing & Supply Management, Netherlands,6(3-4): 169–178.
[30] WADHWAV & RAVINDRAAR. 2007. Vendor selection in outsourcing.Computers & Operations Research,34: 3725–3737.
[31] WEBERCJ, CURRENTJ & BENTONW. 1991. Vendor selection criteria and methods.Eur. J. Oper. Res.,50(1): 2–18.
[32] WEBERCA. 1991. A data envelopment analysis approach to measuring vendor performance.Supply Chain Management: An International Journal,1(1): 28–39.
[33] WEN-WEN W, TONG Z, YUAN W, XIAO-FEIZ & ZHEY. 2010. DEA/AHP two-stage evalua-tion model of vendor’s selecevalua-tion in apparel supply chain.E-Product E-Service and E-Entertainment, ICEEE2010, p. 1–3.
[34] YANGY & WUL. 2010. Improved grey correlative method for green vendor selection in coal group. International Conference on Internet Technology and Applications, 2010, pp. 1-4.