1
Click-Through Rate Prediction: A comparative study
of Ensemble Techniques in Real-Time bidding
Maria do Canto e Castro Faria Blanc
Dissertation presented as partial requirement for obtaining the
Master’s degree in Statistics and Information Management
2 NOVA Information Management School
Instituto Superior de Estatística e Gestão de Informação
Universidade Nova de Lisboa
CLICK-THROUGH RATE PREDICTION: A COMPARATIVE STUDY OF ENSEMBLE
TECHNIQUES IN REAL-TIME BIDDING
by
Maria Faria Blanc
Dissertation presented as a partial requirement for obtaining the Master’s degree in Information Management, with a specialization in Business Intelligence and Knowledge Management
Advisor: Prof. Roberto Henriques, PhD Co Advisor: Prof. André Melo, MsC
3 ABSTRACT
Real-Time Bidding is an automated mechanism to buy and sell ads in real time that uses data collected from internet users, to accurately deliver the right audience to the best-matched advertisers. It goes beyond contextual advertising by motivating the bidding focused on user data and also, it is different from the sponsored search auction where the bid price is associated with keywords. There is extensive literature regarding the classification and prediction of performance metrics such as click-through-rate, impression rate and bidding price. However, there is limited research on the application of advanced machine learning techniques, such as ensemble methods, on predicting click-through rate of real-time bidding campaigns. This paper presents an in-depth analysis of predicting click-through rate in real-time bidding campaigns by comparing the classification results from six traditional classification models (Linear Discriminant Analysis, Logistic Regression, Regularised Regression, Decision trees, k-nearest neighbors and Support Vector Machines) with two popular ensemble learning techniques (Voting and BootStrap Aggregation). The goal of our research is to determine whether ensemble methods can accurately predict click-through rate and compared to standard classifiers. Results showed that ensemble techniques outperformed simple classifiers performance. Moreover, also, highlights the excellent performance of linear algorithms (Linear Discriminant Analysis and Regularized Regression).
Keywords: Programmatic, Real-Time bidding, click-through-rate, classification, ensemble
4 1. INTRODUCTION
Online advertising is a multi-billion industry. In 2016 in Europe, the estimated value for digital was 48.3 billion euros (Knapp & Markit, 2017). Over the last two decades, the scale of internet exploded with a multitude of digital players entering in the arena, resulting in the rapid extension and fragmentation of the marketplace. New methods and technologies have emerged and changed the daily life of publishers and advertisers. The success and effectiveness of digital campaigns are measured by whether users click on ads. As a result, one of the main fields of study is the ability to predict the click-through rate (CTR), defined as the ratio of the number of clicks and number of impressions. In this paper, we will use the term impression to refer to an ad view. Considered as the main Key Performance Indicator (KPI) to user response in online advertising (Hua, Mei, & Hanjalic, 2011) a higher click-through rate indicates more consumers connecting with the brand, and as a result, more revenue. Traditionally, publishers and advertisers interacted with each other through personal negotiations and manual orders. Today, the industry is populated with a large number of automated multi-sided platforms that communicate without human intervention. Lately, the new paradigm is called Programmatic Advertising (PA), one of the most promising areas in digital marketing (Juanjuan Li, Yong Yuan, Xueliang Zhao, 2017). One type of PA is Real-Time bidding, an automated mechanism to buy and sell ads in real time that uses information collected from internet users to deliver the right audience to the best-matched advertisers accurately. The operation occurs in less than 100 milliseconds before the ad is placed (Yuan, Wang, Li, & Qin, 2014). Companies are now challenged to adopt big data analytics to better understand their customer behavior (Kitchens, Dobolyi, Li, & Abbasi, 2018).
5
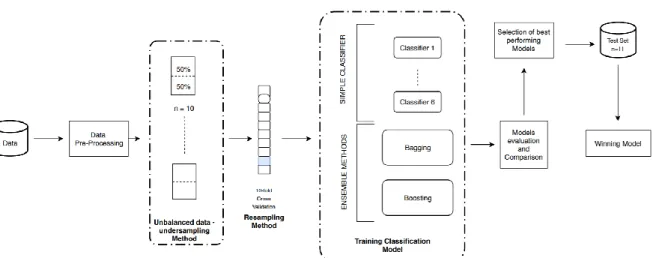
The emergence of Big Data tools and techniques provides new opportunities for researches to understand different types of phenomena through the analysis of the extracted data about user behavior (McAfee & Brynjolfsson, 2012). Real-Time Bidding is a new and challenging ecosystem which changed the landscape of the digital marketplace. The focus is now on user information rather than contextual data, when people are served with targeted advertising based on terms they search for or their recent browsing behavior (Yuan et al., 2014). A large number of studies about predicting CTR at the user level, on the RTB ecosystem, has been carried out (Chen, Berkhin, Anderson, & Devanur, 2011; W. Zhang, Yuan, & Wang, 2014a). However, as we are dealing with recent technology, it is still a field that requires research. This paper aims to study the CTR prediction problem by incorporating RTB advertising. The approach will be presented by integrating two ensemble methods, the Bagging, and Boosting techniques and the undersampling method to address the imbalanced learning sample distribution. We create ten different balanced datasets to cover a considerable number of observations from the majority class. Each classifier was processed and analyzed through all datasets. Also, to improve models performance, we applied 10-fold cross-validation. Finally, to evaluate models performance we used the area under the receiver operating characteristics curve (AUC) and the accuracy metric.
Specifically, the goal of the paper is to answer the following question:
• When combining multiple resampling methods how does ensemble techniques improve classifier performance?
6
This paper is organized as follow. We begin by summarizing the results of a literature search for click-through-rate and ensemble techniques. Next, we explicitly describe our methodology to present the results then and draw some conclusion in the final section.
2. BACKGROUND
Click through rate prediction is the ability to predict if a user clicks or not in an advertisement. In technical terms, we are facing a supervised machine learning problem. In particular, a binary classification problem. The dependent variable is an impression that is classified as non-click (class 0) or as a click (class 1) based on impression’s historical data.
Ensemble methods are a machine learning paradigm that improves pure classifier performance and stability by combining multiple learners during the training process. An ensemble contains many learners called base learners who are generated from the training data by a base learning algorithm such as decision tree and logistic regression (Z.-H. Zhou, 2012a). There are several effective ensemble techniques. In this paper we will focus on the following two methods, Bagging and Boosting.
Ensemble techniques are divided into two groups based on how base learners are combined. As presented in figure 1, Bagging is a parallel ensemble method that exploits the independence between the base learners, while Boosting exploit the dependence between the base learners and builds the new learner in a sequential form (Z.-H. Zhou, 2012b).
7
Figure 1: Bagging and Boosting architecture
The bagging method stands for bootstrap aggregation. Firstly, n training data sets are generated by random sampling replacement from the original set, and so observations may be repeated in each new data set. This technique is based on the assumption that any element has the same probability to appear in the new data set. During the training stage, each learner is building independent as presented in figure 1. Finally, to predict the class of unseen data results is obtained by the average or from the majority vote of responses of n learners. Bagging is a well-known method to improve classifier performance, used to reduce high-variance of machine learning algorithms (Z.-H. Zhou, 2012b).
On the other hand, for Boosting methods observations are weighted, and therefore some of them will have a higher probability of being part of new data sets. This method refers to a family of algorithms that can convert weak learners to active learners by adjusting the weight of an observation based on the last classification. After each training step, the weights are redistributed based on misclassified data in order to enable learners to focus on them during the training phase. When calculating prediction capability, the algorithm allocates weights to each resulting model to finally be able to take a weighted average of their estimates. This
8
simplified method adjusts iteratively the error faced by the previous model until the most accurate is built (Freund & Schapire, 1997).
Related Work
Preliminary work in this field of CTR focused on either the content of the ad or the query searched by the user that resulted in the display of a particular ad (Edelman, Ostrovsky, & Schwarz, 2007; Mehta, A., Saberi, A., Vazirani, U., 2007). The acronym PPC stands for pay-per-click, one of the most popular search engine advertising. It enables the capability to display highly targeted ads to each web user by matching the search term with the keywords used in the ad campaign. Every time a search is initiated and if the term is related to their business offer, advertisers bid for ad placement (Hua et al., 2011). Considered one of the most useful and informative metrics, click through rate prediction is the main subject in a large number of works.
On one study, for instance (Kumar et al., 2015) used a weekly advertisement data focusing on both position and impression as predictor variables. They achieve a 90% accuracy for CTR estimation by applying a Logistic Regression and conclude that ads can get more clicks depending on their position and depth. In another study, Richardson et al. (2007) proposed a model to predict CTR for new ads based on features of ads, terms, and advertisers. The approach of the author was based on a Logistic Regression algorithm. He highlights the right results and how it improves advertising system’s performance by increasing both revenue and user satisfaction.
The main shortcoming in the last two studies is that both models were developed based on the independent relationship between the query and the CTR. In the case of broad matching, having additional query-dependent features such as the degree of similarities between the
9
bid and query; the number of existent words per position could give them additional insights about CTR and as a consequence improve results. It has led authors such as Regelson & Fain (2006) to investigate an interesting approach based on the use of clusters for related terms. They performed the prediction model according to the similarities between the bid terms of the ads or topic clusters. Agarwal (2015) examined the performance of statistical learning methods and compared the performance between Linear and Logistic Regression to predict CTR focusing on three critical attributes: the app, the site, and domain. The author highly recommends the Logistic regression, due to its consistency in results and outstanding performance when compared with Linear models. He also draws our attention to the importance of data pre-processing and how it could affect results.
Various approaches have been suggested to solve this classification problem. For instance, the authors He et al. (2014) proposed a hybrid model that combines decision trees and logistic regression. The results revealed to be an outperforming method comparing with both models’ performance on their own. They registered an improvement of 3% with significant impact on the overall system performance and conclude that real-valued input features with boosted decision trees increase prediction accuracy in linear classifiers. New approaches have been investigated, and in the paper (G. Zhou et al., 2017), the authors proposed a new model, Deep Interest Networks (DIN) which reveals to be more effective than traditional models. On the other hand, the ensemble methods were also evaluated by King, Abrahams, & Ragsdale (2015). The authors compared the results of four classification models (Logistic Regression; Decision Tree; Support Vector Machines and Naïve Bayes) with four ensemble learning techniques (Voting, Bootstrap Aggregation, Stacked Generalization, and MetaCost). They conclude that the ensemble technique can improve the systems’ performance and
10
highlight the importance of using other evaluation metrics to compare with traditional methods such as classification accuracy.
In the last few years, we have seen the rise of audience targeting and personalization. Programmatic advertisement (PA) has been widely considered the ultimate technique of data-driven advertising. As mentioned in the previous section, one of the main delivery ad processes is via real-time bidding (RTB) auction. RTB is an automated mechanism to buy and sell ads in real time that uses data collected from internet users, to accurately deliver the right audience to the best-matched advertisers (Juanjuan Li, Yong Yuan, Xueliang Zhao, 2017). In this scenario, the study is no longer focused on the user’s keywords but the user’s profile. This mechanism that works in the order of milliseconds provides for one single impression, more than one hundred attributes that characterize it. Considering that a campaign can have more than one million impressions, this automated system brings new opportunities for researchers to study, through data mining and machine learning technologies, multiples ways of improving targeting capabilities (Wang, Zhang, & Yuan, 2016).
The information of the bid request generates a large number of categorical and numerical features. The authors Zhu, Wang, Shih, Peng, & Huang (2017) draw our attention to how important is to deal with those features and how it can compromise the classifier performance. First, they exploit the hashing trick method to transform variables into a large fixed size vector to then applied a Softmax-based Ensemble Model (SEM). Through this method, memory usage can significantly be reduced. The experimental results demonstrate that SEM outperforms Logistic Regression (LR) and Logistic Regression. Deep learning techniques were also investigated (Shioji & Arai, 2017; G. Zhou et al., 2017).
11
As mentioned, one of the biggest challenges of this real-world classification problem is how to manage the unbalanced data. The authors S. Zhang, Fu, & Xiao (2017) proposed an approach where first, they organized all the attributes per sections, such as user features, historical CTR features, ID features, and other numerical variables. Then, to address this problem, they combined Weighted-ELM (WELM) and Adaboost algorithm. The results showed a higher performance of the previous algorithms when compared with simple classifiers. In this mechanism, each advertiser bids for every single impression depending on how they value the ad opportunity. Another major field of study is the ability to predict the winning price of each bid in Real-Time Bidding. There is a considerable amount of literature around this topic (Weinan, Shuai, & Jun, 2016; Wush Chi-Hsuan, Mi-Yen, & Ming-Syan, 2015; W. Zhang, Yuan, & Wang, 2014). The authors Wush Chi-Hsuan et al. (2015) proposed a mixture model, which combines linear regression and censored regression. Experiments results prove that their approach highly outperforms linear regression regarding prediction accuracy. Unfortunately, for this study, we do not have access to the bids price information.
For this binary classification problem, a large number of machine learning algorithms have been explored such as Logistic Regression, Decision Trees, Neural Networks, Ensembles, and many others. Sponsored search advertising, contextual advertising, and real-time-bidding have all relied on the ability to learned models to predict ad click-through rate accurately. However, we are dealing with recent and sophisticated technology which in order to optimize and maximize its potential it is still a subject that requires further researches.
12 Table 1: Theoretical background on Click Through Rate Models
Topic Algorithms Methods and Results References
Predict Click Through Rate for new ads
Logistic Regression
The authors focus their study on new ads and how to use features of ads, terms, and advertisers to create an accurate model. As a result, their model increases both revenue and user satisfaction.
(Richardson et al., 2007) Practical Lessons from Predicting Clicks on ads at Facebook Combine decision trees and Logistic Regression
They highlight the importance of selecting the right features. Results showed that their hybrid model outperforms both classifiers independently. A certain number of parameters were applied.
(He et al., 2014) A comparative study of Linear learning methods in Click-Through Rate Prediction
Linear and Logistic Regression
This paper examines the accuracy of statistical learning methods (linear and logistic). They reduced dimensionality and used the Logistic loss to
evaluate model's performance. Linear models outperform Logistic in term of results and consistency. (Agarwal, 2015) Predicting clicks: CTR estimation of advertisements using Logistic Regression classifier Logistic Regression
The authors tested the Logistic Regression algorithm on a one-week advertisement data by considering position and impression as a predictor variable, and they achieved an accuracy of 90% for CTR estimation. (Kumar et al., 2015) SEM: A Softmax-based Ensemble Model for CTR estimation in Real-Time Bidding advertising Softmax-based Ensemble Model (SEM) compared with logistic and linear regression
The authors focus their study on the feature hashing trick, a method to deal with categorical variables and numerical variable by converting them into a largely fixed size vector. SEM model demonstrate better results than simple classifiers
(Zhu et al., 2017)
Deep Interest Network for Click-Through Rate Prediction
Deep Interest Network (DIN)
The authors proposed a new method to deal with user feature compressed into a fixed-length vector – Deep Interest Network (DIN). Results demonstrate the effectiveness of proposed approaches, which achieve superior performance compare with state-of-art methods.
(G. Zhou et al., 2017)
Ensemble learning methods for pay-per-click campaign management
Compare four base classification models with four ensemble methods (Voting; Boosting; Stacking and MetaCost).
Ensemble learning methods were superior
classifiers based on profit per campaign evaluation comparing with the four main simple classifiers. (Naïve Bayes, LR, DT, SVM) (King et al., 2015) Advertisement Click-Through Rate Prediction Based on the Weighted-ELM and AdaBoost Algorithm
Weighted-ELM (WELM) and Bagging (Adaboost)
The authors proposed a technique to address the problem of unbalanced data by combining two methods: Weighted-ELM (WELM) and Adaboost algorithm. Their approach outperforms simple classifier results.
(S. Zhang et al., 2017)
13
3. METHODOLOGY
The purpose of this study is to provide a method for Click-Through-Rate prediction through ensemble techniques. First, we applied the undersampling method, an imbalanced data mitigation technique that fixes the minority class and reduces the majority class until we have a balanced data set. In this study, we applied a ratio of 50 - 50. Ten different datasets were created in order to cover a considerable number of observations from the majority class. As a resampling method, we applied 10-fold cross validation over each dataset in order to increase models’ performance. After testing two different ensemble methods, we then compare their results based on AUC Curve and Accuracy with simple classifiers.
This approach is represented in Figure 2, and the description of each step is outlined in this section.
14
Dataset
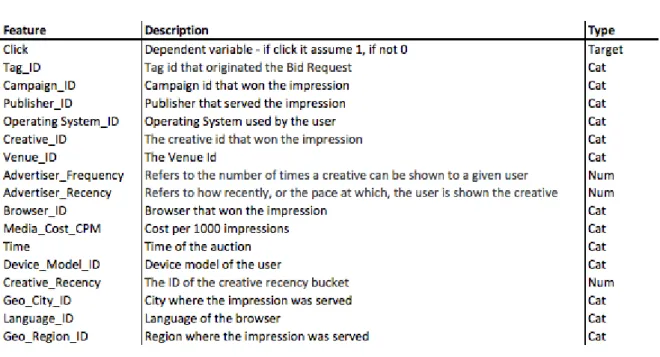
This work is performed on a real-world campaign data that was produced by a real-time bidding environment. It was collected and provided by a Digital Marketing Company. The dataset as approximately 1 GB, it contains 1.650.563 impressions of a digital campaign. For each impression we have 116 features including the dependent variable that we define as the Click – it assumes one if the user clicks on the ad and 0 if not The target class, defined as a click, contains 1222 records which represent global CTR of 0.074%. The campaign had a duration of 45 days, started on the 5th of July 2017 and ended on the 18th of August 2017.
Data pre-processing
Data pre-processing is an effective way of reducing dimensionality, removing irrelevant data, increasing learning accuracy and improving results interpretation (Yu & Liu, 2003). Our dataset has more than one hundred features which mean we are facing a high dimensional data problem.
A vast majority of the variables in the dataset were categorical, and several of them contained a large number of infrequent levels. In order to simplify interpretation, our solution was to reduce levels by infrequent group level into an 'others’ level. Then, we identify a large number of variables with a high amount of missing values. The solution was to drop these variables. Another method to improve prediction capability is by manipulating variables. We created new features by either extracting information from a single variable or by creating an interaction between two variables. We created time and weekday, which described the hour and the day of the week when the impression was served and the format (half-page or mrec) that described the format of the creative.
15
Selecting the right feature can be crucial to guarantee the highest performance of machine learning algorithms. We proceed our exploratory process based on the descriptive analysis; frequency and density diagrams, and correlation matrix (Yu & Liu, 2003). Finally, to evaluate the prediction capability of each variable we used the information value (IV), a metric that rank variables by their importance. A variable with an IV between 0.02 to 0.1 has weak predictive power, while a variable with an IV between 0.3 and 0.5 has a robust predictive Power (Howard, 1966).
Our final dataset is composed of 17 features as presented in Table 2.
Table 2: Final dataset
16
Unbalanced data
Deal with imbalanced data is considered a real-world data science problem. It can compromise the performance of learning algorithms and evaluation metrics (Chawla, 2009). To face this challenge, sampling techniques have been developed and tested to guarantee the excellent performance of balance datasets (Haibo He & Garcia, 2009b). Imbalanced data occurs when the number of observations for one class highly dominates the other (Haibo He & Garcia, 2009). In order to mitigate this problem, there are three main categories of solutions. Firstly, Resampling techniques, the most popular strategy used to rebalance the sample space by duplicating samples of the minority class (Oversampling) or by reducing samples of the majority class (Undersampling). Then, Cost-sensitive learning that assumes higher costs for misclassification of the minority class instances than for the majority class. Finally, ensemble methods that by combining multiple classifiers outperform each of them independently (Haixiang et al., 2017).
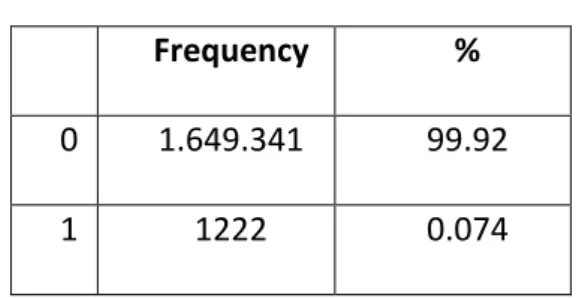
The authors (Jagelid & Movin, 2017), explore in their thesis multiples resampling methods with different ratios. They highlight the excellent performance of oversampling and undersampling techniques. As we can observe in table 3, our dataset is heavily unbalanced. For this study, we decided to apply the undersampling method with a class ratio of 50-50 due to its simplicity, consistency on results and computationally benefits. One of the weaknesses of this method is that by removing all those observations, we can eventually lose some critical information. In order to minimize the impact and to consider the computational capabilities, we decided to create eleven undersample datasets based on the following structure. First, for all datasets, the number of observations from the minority class (1- click) was fixed. It represents 1222 observations of the original dataset. Then, the other 50% of observations
17
were randomly selected from the majority class (0- not click) in order to cover a maximum number of hypothesis. It represents 0.74% of the majority class. Ten data sets were used to train classifiers and the last one to validate predictions with unseen data.
Table 3: Unbalanced dataset
Resampling Methods
Resampling methods are considered a valuable tool when dealing with machine learning problems. They are used to improve classifier performance and obtain further information about the quality of the model. A commonly used technique is cross-validation, applied to estimate the best error associated with a given statistical learning method. In this study, we adopted the 10-fold cross-validation technique that involves splitting the dataset into k-subsets. Each subset is held out while the model is trained on all other k-subsets. This process is repeated until accuracy is determined for each instance in the dataset, and an overall estimate is provided (Kohavi, 1995). Further, data were normalized and attributes with zero variance were removed (James, Witten, Hastie, & Tibshirani, 2013).
Frequency %
0 1.649.341 99.92
18
Training Classification Models
All the ten datasets were used to train learnable classification methods. First, we used six simple classifier algorithms including linear and non-linear algorithms based on their ability to predict a categorical dependent variable (F.Y et al., 2017; Kotsiantis, 2007) to then compare their performance with ensemble methods, Boosting and Bagging. A brief description of each model is presented below.
A linear classifier makes its classification based on a linear predictor function by combining a set of weights with the feature vector; its goal is to group items that have similar feature values into groups. A classical linear learning algorithm is Fisher’s linear discriminant analysis (LDA) that enables a separation of instances according to the distance calculated between them. We also applied Logistic Regression (GLM) and his regularized version with GLMnet package which implements a combined version of ridge and lasso. On the other hand, for non-linear classifiers, we applied the Decision Tree (CART) which consists of a tree structure where each node represents a feature in an instance to be classified, and each branch represents a value that the node can assume. We also used the K-nearest neighbor (KNN) algorithm, considered a lazy learner and finally, the Support Vector Machine (SVM), one of the most recent technique and closely related to classical multilayer perceptron neural network (F.Y et al., 2017).
Ensemble methods involve building a classification model from a set of base learners where accuracy can come to the forefront, and the errors tend to cancel out. Our research compares the performance of two well-known ensemble techniques, Bagging (Random Forest) and Boosting (Stochastic Gradient Boosting), with the six previously presented individual
19
classifiers. These ensemble methods were selected based on their extensive researches (Z.-H. Zhou, 2012b), Gradient Boosting, is used to improve iteratively base learners until it converts a weak learner into an active learner (Friedman, 2002) and Random Forest is known for its dominant performance as a classifier (Breiman, 2001).
To implement the data formatting and model training, Caret package was used. It is an open source library from R programming.
Model Evaluation and Comparison
As mentioned, after training all the algorithms on training data, the final step is to evaluate their performance based on unseen data. For that, we applied two methods. First, we used k-fold cross-validation with k =10, considered a standard method for validation when there is not enough data available. Then, to validate results, we decided to use the validation dataset, the last balanced dataset created during the pre-processing phase. The data set is composed with 50% of unseen data selected randomly from the majority class.
A confusion Matrix, also known as error matrix, is a table used to describe the performance of a classification model of a set of test data. In this model, two significant errors can occur: classifying a click as a non-click and classifying a non-click as a click. This errors, are known as false negative and false positive results. The structure is presented in table 4.
20
There are multiple metrics that we can use to evaluate machine learning algorithms. For binary classification problem, an accurate and well-known metric is ROC analysis based on results from the Confusion Matrix. (Bradley, 1997). AUC is the area under the receiver operating characteristics curve (ROC), an active and combined measure of sensitivity that depends on True Positive (TP) and False Negative (FN) and specificity that depends on the True negative (TN) and False Positive (FP) instances. If the AUC value is one, the prediction of clicks and non-clicks would be perfect. An area of 0.5 stands for a classification that stands for poorly results. We also used another essential and reliable metric, the accuracy value that calculates the ratio of the correct predictions to the total of input samples.
Furthermore, in all experiments, we conduct a Friedman test with the corresponding post-hoc tests used to compare more than two learning algorithms over multiple data sets proposed by the author Demšar (2006). Friedman test is a non-parametric that first, ranks the algorithms for each data set separately according to their performance. If the null hypothesis is rejected, that stands for that all algorithms are equivalent we can proceed with a post-hoc test. The Nemenyi Test is used when all classifiers are compared to each other. The performance of two classifiers is significantly different if the corresponding average ranks differ by at least the critical difference (CD)
where critical values qα are based on the Studentized range statistic divided by √ 2, k is the number of algorithms and N de number of data sets (Demšar, 2006b).
21 4. RESULTS
In this research study, there were two impression types, the Click and non-click. As previously discussed, we defined an impression click refers to an ad view that is clicked. This section is organized into three parts. The first part presents the results from experiments with both linear and non-linear classifiers and ensemble methods over the ten datasets. In the second part, we evaluate and compare classifiers performance based on the Friedman and post hoc Nemenyi test. To finally, select the bests classifiers and present results based on unseen data. Separately for each classifier method, we calculate the mean value and standard deviation of AUC measurements from models trained on the ten datasets. Also, in preliminary experiments, we measured the performance using the accuracy metric. Results of both evaluation metrics are presented in table 5.
Table 5: Mean of AUC performance and accuracy of the ten models of each classifier LDA: Linear Discriminant Analysis; GLM: Logistic Regression; GLMnet: Regularized Regression; Knn: k-nearest neighbor; DT: Decision Tree; SVM: Support Vector Machine; GBM: Gradient Boosting; RF: Random Forest.
22
Results showed us that Logistic Regression, k-nearest neighbor and decision tree performed poorly as compared to the remaining models. Regarding ensemble techniques, both registered an excellent performance especially the Boosting method that outperformed Random Forest (> 0.01 based on AUC and Accuracy metric). Another interesting fact is the outperforming results of Linear Algorithms. We need to highlight that Linear Discriminant Analysis (LDA) registered better results than Random Forest (> 0.008 based on AUC) and Regularized Regression performance had a higher performance than Stochastic Gradient Boosting (> 0.02 based on AUC). Also, Support Vector Machine (SVM) registered a higher accuracy than the Regularized Regression algorithm (> 0.032 based on accuracy).
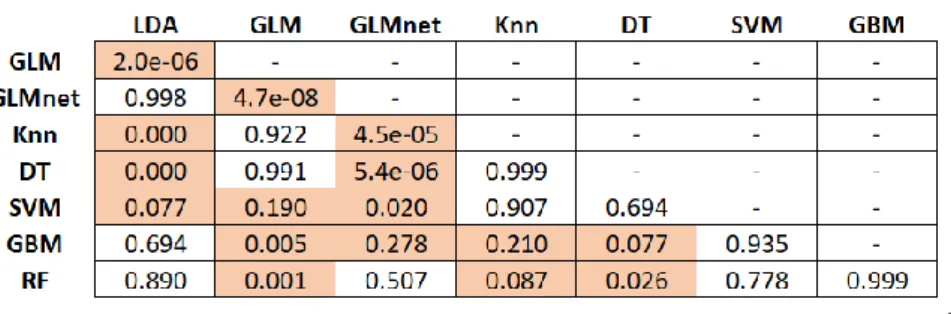
We proceed our analysis by exploring and evaluating if differences in AUC performance were significant. For that, we applied Friedman and post hoc Nemenyi tests. Friedman test is a statistical test used to answer the question if there is a difference between treatments across multiple test attempts. If the last statement is true, we proceed with the post hoc Nemenyi test used to calculate the critical difference value when all classifier is compared to each other (Demšar, 2006).
In this scenario, the null hypothesis states for all classifiers had the same performance based on AUC metric. Usually, the significant level (denoted as alpha) is 0.05. For all classification methods, the Friedman test showed that there was a significant difference in AUC results between the classifiers. It registered a p-value of 4.859 e-12 which confirmed those high differences between algorithms. Therefore, post hoc Nemenyi tests were conducted, and results gave us further information. Details are presented in table 6. Cells in red highlights mean that two algorithms registered a marked difference of AUC performance. On the other
23
hand, the white cells mean that the AUC results between two classifiers are very similar. Results highlighted and confirmed our previous conclusions.
Table 6: the Pairwise comparison using Nemenyi multiple comparison tests
LDA: Linear Discriminant Analysis; GLM: Logistic Regression; GLMnet: Regularized Regression; Knn: k-nearest neighbor; DT: Decision Tree; SVM: Support Vector Machine; GBM: Gradient Boosting; RF: Random Forest.
.
We proceed to our final step by evaluating the predictive capability of the selected classifiers. Based on the previous analysis, we first select the best performing models which mean LDA; GLMnet and both ensemble techniques, Bosting (Stochastic Gradient Boosting) and Bagging (Random Forest). Then, for each classifier, we analyze the AUC result per model, over the ten datasets independently and select the highest one (see Figure 2). Finally, based on the previous selection we tested each model using the test dataset. Results are presented in table 5.
24
Table 1: Models capability prediction - AUC values
LDA: Linear Discriminant Analysis; GLMnet: Regularized Regression; GBM: Gradient Boosting; RF: Random Forest.
Results support in part of our hypothesis. Ensemble methods are a kind of state of the art and can significantly register more accurate and stable results than a single learner (Table 2). However, when testing classifiers with a data set that is partially composed with unseen data (50%), only the invalid class ( 0 – not click) were randomly selected from the majority class and the others 50% are the same observations used during the training set, we registered biased results. Random Forest registered a score largely different from the other three tested models (AUC = 0.973) as we can observe in table 5.
5. CONCLUSIONS
The purpose of this study was to explore and compare the ability of ensemble methods to predict click-through rate. After a pre-processing process, to manage the unbalanced data we applied the undersampling technique and k-fold cross-validation to improve classifiers performance. We tested two different ensemble methods, Bagging and Boosting and compare results based on AUC Curve and Accuracy metric with simple classifiers. Our results support in part of our hypothesis. Ensemble methods are a kind of state of the art and can significantly register more accurate and stable results than a single learner but also, linear classifiers registered high scores (LDA an GLMnet).
25
Limits
In a Real-Time-Bidding environment for every bid, a large amount of data is generated. One of the most significant limitations of this study was the data quality. Unfortunately, due to confidential issues, a large amount of the available data in the original dataset was masked. Running campaigns in real-time-bidding enable systems to capture accurate and sensitive information that companies cannot share. Another challenge was to select the approach to manage the unbalanced data. Our dataset was considerable large (approximately 1GB) which by applying other techniques such as Oversampling and SMOTE it would duplicate de size, and consequently, we would lose computational power. Also, having data of more than one campaign could be very interesting to validate and confirm results or identify discrepancies across the algorithms.
Future work
Having full access to the original dataset would be interesting. Explore and manipulate more than a hundred features would undoubtedly bring us exciting and robust insights to optimize model performance. Thus, the feature selecting step would be highly accurate.
Deal with imbalanced data is considered a real-world data science problem. Exploring further methods would be interesting. First, to investigate the others main resampling techniques such as Oversampling (duplicate the majority class) or SMOTE. Another approach would be to explore different methods than resampling such as cost-sensitive and ensemble algorithms.
Finally, it would be interesting to explore further ensemble techniques such as AdaBoost and XGboost that are known for their efficient performance.
26 REFERENCES
Agarwal, A. (2015). A comparative study of Linear learning methods in Click-Through Rate Prediction. In International Conference on Soft Computing Techniques and
Implementations (pp. 97–102). IEEE. https://doi.org/10.1109/ICSCTI.2015.7489611 Bradley, A. P. (1997). The use of the area under the ROC curve in the evaluation of machine
learning algorithms. Pattern Recognition, 30(7), 1145–1159. https://doi.org/10.1016/S0031-3203(96)00142-2
Breiman, L. (2001). Random Forests. Machine Learning, 45(1), 5–32. https://doi.org/10.1023/A:1010933404324
Chawla, N. V. (2009). DATA MINING FOR IMBALANCED DATASETS: AN OVERVIEW. In Data Mining and Knowledge Discovery Handbok (pp. 853–867). Retrieved from
https://www3.nd.edu/~dial/publications/chawla2005data.pdf
Chen, Y., Berkhin, P., Anderson, B., & Devanur, N. R. (2011). Real-time bidding algorithms for performance-based display ad allocation. Proceedings of the 17th ACM SIGKDD
International Conference on Knowledge Discovery and Data Mining - KDD ’11, 1307. https://doi.org/10.1145/2020408.2020604
Demšar, J. (2006a). Statistical Comparisons of Classifiers over Multiple Data Sets. Journal of Machine Learning Research, 7, 1–30. Retrieved from
http://www.jmlr.org/papers/volume7/demsar06a/demsar06a.pdf
Demšar, J. (2006b). Statistical Comparisons of Classifiers over Multiple Data Sets. Journal of Machine Learning Research, 7, 1–30.
27
Edelman, B., Ostrovsky, M., & Schwarz, M. (2007). Internet advertising and the generalized second-price auction: Selling billions of dollars worth of keywords. American Economic Review, 97(1), 242–259. https://doi.org/10.1257/aer.97.1.242
F.Y, O., J.E.T, A., O, A., J. O, H., O, O., & J, A. (2017). Supervised Machine Learning
Algorithms: Classification and Comparison. International Journal of Computer Trends and Technology, 48(3), 128–138. https://doi.org/10.14445/22312803/IJCTT-V48P126 Freund, Y., & Schapire, R. E. (1997). A Decision-Theoretic Generalization of On-Line Learning
and an Application to Boosting. Journal of Computer and System Sciences S SS1504 Journal of Computer and System Sciences, 55, 1199139. Retrieved from
http://www.face-rec.org/algorithms/Boosting-Ensemble/decision-theoretic_generalization.pdf
Friedman, J. H. (2002). Stochastic gradient boosting. Computational Statistics & Data Analysis, 38(4), 367–378. https://doi.org/10.1016/S0167-9473(01)00065-2
Haibo He, H., & Garcia, E. A. (2009b). Learning from Imbalanced Data. IEEE Transactions on Knowledge and Data Engineering, 21(9), 1263–1284.
https://doi.org/10.1109/TKDE.2008.239
Haibo He, H., & Garcia, E. A. (2009a). Learning from Imbalanced Data. IEEE Transactions on Knowledge and Data Engineering, 21(9), 1263–1284.
https://doi.org/10.1109/TKDE.2008.239
Haixiang, G., Yijing, L., Shang, J., Mingyun, G., Yuanyue, H., & Bing, G. (2017). Learning from class-imbalanced data: Review of methods and applications. Expert Systems with Applications, 73(December), 220–239. https://doi.org/10.1016/j.eswa.2016.12.035
28
He, X., Bowers, S., Candela, J. Q., Pan, J., Jin, O., Xu, T., … Herbrich, R. (2014). Practical Lessons from Predicting Clicks on Ads at Facebook. Proceedings of 20th ACM SIGKDD Conference on Knowledge Discovery and Data Mining - ADKDD’14, 1–9.
https://doi.org/10.1145/2648584.2648589
Howard, R. (1966). Information Value Theory. IEEE Transactions on Systems Science and Cybernetics, 2(1), 22–26. https://doi.org/10.1109/TSSC.1966.300074
Hua, X.-S., Mei, T., & Hanjalic, A. (2011). Online multimedia advertising : techniques and technologies. Information Science Reference.
Jagelid, M., & Movin, M. (2017). A Comparison of Resampling Techniques to Handle the Class Imbalance Problem in Machine Learning Conversion Prediction of Spotify Users-A Case Study. KTH ROYAL INSTITUTE OF TECHNOLOGY. Retrieved from
https://www.kth.se/social/files/5a5ad14056be5b323d61de10/MJagelid.MMovin.pdf James, G., Witten, D., Hastie, T., & Tibshirani, R. (2013). Springer Texts in Statistics An
Introduction to Statistical Learning. Springer Texts in Statistics. https://doi.org/10.1007/978-1-4614-7138-7
Juanjuan Li, Yong Yuan, Xueliang Zhao, F.-Y. W. (2017). Research on Information Structure of Programmatic Advertising Markets. IFAC (International Federation of Automatic
Control). https://doi.org/https://doi.org/10.1016/j.ifacol.2017.08.2377
King, M. A., Abrahams, A. S., & Ragsdale, C. T. (2015). Ensemble learning methods for pay-per-click campaign management. Expert Systems with Applications, 42(10), 4818–4829. https://doi.org/10.1016/j.eswa.2015.01.047
29
Value Through Integration of Relatio...: Sistema de descoberta para FCCN. https://doi.org/https://doi.org/10.1080/07421222.2018.1451957
Knapp, D., & Markit, I. (2017). Adex Benchmark 2016. Retrieved from https://www.iab.com/wp-content/uploads/2017/05/IAB-Europe-AdEx-Benchmark_Interact-2017-Results.pdf
Kohavi, R. (1995). A Study of Cross-Validation and Bootstrap for Accuracy Estimation and Model Selection. e International Joint Conference on Arti_cial Intelligence. Retrieved from http://robotics.stanford.edu/~ronnyk
Kotsiantis, S. B. (2007). Supervised Machine Learning: A Review of Classification Techniques. Informatica (Vol. 31). Retrieved from
https://datajobs.com/data-science-repo/Supervised-Learning-[SB-Kotsiantis].pdf
Kumar, R., Naik, S. M., Naik, V. D., Shiralli, S., Sunil, V. G., & Husain, M. (2015). Predicting clicks: CTR estimation of advertisements using Logistic Regression classifier. In Souvenir of the 2015 IEEE International Advance Computing Conference, IACC 2015 (pp. 1134– 1138). IEEE. https://doi.org/10.1109/IADCC.2015.7154880
McAfee, A., & Brynjolfsson, and E. (2012). Big Data: The Management Revolution. Retrieved from
https://pdfs.semanticscholar.org/02c7/740af5540f23a2da23d1769e64a8042ec62e.pdf Mehta, A., Saberi, A., Vazirani, U., and V. (2007). AdWords and Generalized Online
Matching. Journal of the ACM, 54. https://doi.org/http://doi.acm.org/ 10.1145/1284320.1284321
30
Proceedings of the 19th ACM SIGKDD International Conference on Knowledge Discovery and Data Mining. Retrieved from
http://citeseerx.ist.psu.edu/viewdoc/download?doi=10.1.1.130.9999&rep=rep1&type= pdf
Richardson, M., Dominowska, E., & Ragno, R. (2007). Predicting clicks: estimating the click-through rate for new ads. Proceedings of the 16th …, 521–529.
https://doi.org/10.1145/1242572.1242643
Shioji, E., & Arai, M. (2017). Neural Feature Embedding for User Response Prediction in Real-Time Bidding (RTB). Retrieved from https://arxiv.org/pdf/1702.00855v1.pdf
Wang, J., Zhang, W., & Yuan, S. (2016). Display Advertising with Real-Time Bidding (RTB) and Behavioural Targeting. https://doi.org/10.1561/1500000049
Weinan, Z., Shuai, Y., & Jun, W. (2016). Optimal Real-Time Bidding for Display Advertising. UCL (University College London). Retrieved from
http://delivery.acm.org/10.1145/2630000/2623633/p1077-zhang.pdf?ip=193.136.119.249&id=2623633&acc=ACTIVE
SERVICE&key=2E5699D25B4FE09E.DE7F6CA86C6E574F.4D4702B0C3E38B35.4D4702B0 C3E38B35&__acm__=1538909209_47c6a26f3ec810e708947c9560010591
Wush Chi-Hsuan, W., Mi-Yen, Y., & Ming-Syan, C. (2015). Predicting Winning Price in Real Time Bidding with Censored Data. the 21th ACM SIGKDD International Conference. https://doi.org/10.1145/2783258.2783276
Yu, L., & Liu, H. (2003a). Feature Selection for High-Dimensional Data: A Fast Correlation-Based Filter Solution. Washington DC: Proceedings of the Twentieth International
31
Conference on Machine Learning. Retrieved from
http://www.aaai.org/Papers/ICML/2003/ICML03-111.pdf
Yu, L., & Liu, H. (2003b). Feature Selection for High-Dimensional Data: A Fast Correlation-Based Filter Solution. Washington DC: Proceedings of the Twentieth International Conference on Machine Learning.
Yuan, Y., Wang, F., Li, J., & Qin, R. (2014). A survey on real time bidding advertising.
Proceedings of 2014 IEEE International Conference on Service Operations and Logistics, and Informatics, SOLI 2014, 418–423. https://doi.org/10.1109/SOLI.2014.6960761 Zhang, S., Fu, Q., & Xiao, W. (2017). Advertisement Click-Through Rate Prediction Based on
the Weighted-ELM and Adaboost Algorithm. Hindawi. https://doi.org/10.1155/2017/2938369
Zhang, W., Yuan, S., & Wang, J. (2014a). Optimal real-time bidding for display advertising. In Proceedings of the 20th ACM SIGKDD international conference on Knowledge discovery and data mining - KDD ’14 (pp. 1077–1086). https://doi.org/10.1145/2623330.2623633 Zhang, W., Yuan, S., & Wang, J. (2014b). Optimal real-time bidding for display advertising. In
Proceedings of the 20th ACM SIGKDD international conference on Knowledge discovery and data mining - KDD ’14. https://doi.org/10.1145/2623330.2623633
Zhou, G., Song, C., Zhu, X., Ma, X., Yan, Y., Dai, X., … Gai, K. (2017). Deep Interest Network for Click-Through Rate Prediction. Retrieved from http://arxiv.org/abs/1706.06978
Zhou, Z.-H. (2012a). Ensemble Methods Foundations and Algorithms. A Chapman & Hall Book. Retrieved from http://www2.islab.ntua.gr/attachments/article/86/Ensemble methods - Zhou.pdf
32
Zhou, Z.-H. (2012b). Ensemble Methods Foundations and Algorithms. A Chapman & Hall Book.
Zhu, W. Y., Wang, C. H., Shih, W. Y., Peng, W. C., & Huang, J. L. (2017). SEM: A Softmax-based Ensemble Model for CTR estimation in Real-Time Bidding advertising. In 2017 IEEE International Conference on Big Data and Smart Computing, BigComp 2017 (pp. 5– 12). https://doi.org/10.1109/BIGCOMP.2017.7881698