DOI: 10.1590/2175-3369.010.SUPL1.AO15 ISSN 2175-3369
Licenciado sob uma Licença Creative Commons
transportation: Sao Paulo versus Shanghai
Emissões de CO
2e políticas de mitigação para o transporte rodoviário
urbano: São Paulo versus Xangai
Evaldo Costa[a,b], Julia Seixas[b], Patrícia Baptista[c], Gustavo Costa[d], Thomas Turrentine[a]
[a] University of California Davis (UCDAVIS), Institute of Transportation Studies (ITS), Plug-in Hybrid & Electric Vehicle
Research Center (PHEV), Davis, CA, United States of America
[b] Departamento de Ciências e Engenharia do Ambiente (DCEA), Universidade Nova de Lisboa (UNL), Faculdade de Ciências
e Tecnologia (FCT), Caparica, Portugal
[c] Universidade de Lisboa (UL), Instituto Superior Técnico (IST), Centro de Estudos em Inovação, Tecnologia e Políticas de
Desenvolvimento (IN+), Lisboa, Portugal
[d] Instituto Militar de Engenharia, Departamento de Engenharia, Rio de Janeiro, RJ, Brasil
Abstract
This paper compares the energy consumption, CO2 emissions and public policies of two mega-cities, Sao
Paulo (SP) and Shanghai (SH), in order to identify their GHG emissions mitigation policies. Both cities have experienced rapid growth of the automotive sectors resulting in sizable pollution and CO2 emission challenges. SP has successfully implemented the ethanol and encouraged the growth of the fleet of light-duty vehicles. SH has coal-based power generation and restricted the ownership of the vehicles in an attempt to reduce GHG emissions, invested in public transportation and electric mobility. Tabular analysis of secondary data was adopted in this study, revealing also that SP has considerably expanded individual transportation. Despite investments in ethanol, the city could not contain the increase in CO2 emissions from road transportation. SH invested in public transportation and inhibited individual transportation, but also failed to contain CO2
emissions. Mitigation policies and measures taken were not sufficient to prevent growth of CO2 emissions in
both cities. To reduce CO2 emissions in transportation, SP and SH should focus on public policies to encourage public and clean transportation and limit the burning of fossil fuels.
Keywords: Sao Paulo. Shanghai. Energy. CO2 emission. Urban road transportation.
EC is PhD invited researcher, Institute of Transportation Studies, PHEV Research Center, University of California Davis, evaldo. costa@vub.be
JS is university professor, PhD, Departamento de Ciências e Engenharia do Ambiente, Universidade Nova de Lisboa, Faculdade de Ciencias e Tecnologia, mjs@fct.unl.pt
PB is PhD researcher, Centro de Estudos em Inovação, Tecnologia e Políticas de Desenvolvimento do Instituto Superior Técnico, Universidade de Lisboa, patricia.baptista@tecnico.ulisboa.pt
GC is engineer, Departamento de Engenharia, Instituto Militar de Engenharia, Rio de Janeiro, grcosta04@gmail.com
TT is university professor, PhD in the Institute of Transportation Studies, PHEV Research Center, University of California Davis, and Centro de Estudos em Inovação, Tecnologia e Políticas de Desenvolvimento do Instituto Superior Técnico, Universidade de Lisboa, tsturrentine@gmail.com
Introduction
Urban centers are major greenhouse gas (GHG) sources, since cities produced about 75% of global CO2 emissions in 2008, with transportation as a major contributor regarding energy use and emissions (IEA, 2008; UNEP, 2015). Globally, in 2012, road vehicles were responsible for 90% of the energy consumed in transportation, and light-duty vehicles (LDV) accounted for 64% of this amount (IEA, 2015). Motorized road transportation imposes a great burden on the health of the population, resulting in more than 1.5 million deaths annually around the world (The World Bank Group, 2014).
These impacts are particularly visible in larger cities, with Sao Paulo (SP) in Brazil and Shanghai (SH) in China being two good examples regarding emerging economic and increasing population in developing countries. The growing numbers of motor vehicles in these cities has been a major issue for their authorities due to increasing local pollution, contributing to poor air quality. In SP, the rate of mortality due to air pollution is three times higher than those caused by traffic accidents (China, 2015; Vormittag et al., 2013).
The municipality of SP is the most populous metropolis in the southern hemisphere (IBGE, 2015a), with 11.2 million inhabitants in 2010 (IBGE, 2015b). SP has an area of 1,523 km2, a GDP of 151.8 billion
US$, a per capita income of 13.5 thousand US$, a Human Development Index (HDI) of 0.814, and an
urbanization rate of 99% (IBGE, 2010). Between 2000 and 2010 the GDP of SP grew 248%, while its per capita income increased 223% coupled with a population expansion of almost 8%.
In 2010, the municipality of SP had 10% of the Brazilian road vehicles, the largest concentration of Brazil’s fleet (Denatran, 2015a). The Sao Paulo’s vehicle fleet grew almost 60% since 2000. The main energy source for fueling vehicles in SP is ethanol due to the significant production of sugarcane ethanol. Furthermore, a small fraction of natural gas is also used in SP. Although more than 53% of the SP’s electricity generation mix is renewable (São Paulo, 2014a), the city does not have any policy focused on the promotion of electric vehicles (EV).
In China, the significant growth of the economy, especially since 1990, lead to a substantial growth in the number of vehicles, thus becoming the country with the largest automobile market in the world in 2014 (Newgeography, 2015). Hence, vehicle emissions have also become an environmental concern in China and especially in mega-cities like Shanghai, where the population and transportation demand are massive (Chan & Yao, 2008).
Shanghai is also one of the largest cities of the world, with 23 million inhabitants in 2010 (China, 2011). It has an area of 6,340 km2, GDP of 271,400 billion US$,
a per capita income of 11.7 thousand US$ (China, 2012), HDI of 0.814 and an urbanization rate of 88% in 2010 (Newgeography, 2015). Between 2000 and 2010, the city of SH experienced a GDP growth of
Resumo
Este artigo compara o consumo de energia, as emissões de CO2 e as políticas públicas de duas megacidades,
São Paulo (SP) e Xangai (XG), a fim de identificar suas políticas de mitigação de emissões de GEE. Ambas as cidades experimentaram um rápido crescimento dos setores automotivos, resultando em desafios consideráveis
de poluição e emissão de CO2. SP implementou com sucesso o etanol e incentivou o crescimento da frota de
veículos ligeiros. XG tem geração de energia baseada em carvão e restringe a compra de carros. Investiu na expansão do transporte público e encoraja a eletrificação da mobilidade. Análise tabular de dados secundários foi adotada neste estudo, revelando também que SP expandiu consideravelmente o transporte individual. Apesar
dos investimentos em etanol, a cidade não conteve o aumento das emissões de CO2. XG investiu em transporte
público e inibiu o transporte individual, mas também não conseguiu conter as emissões de CO2. As políticas
de mitigação não evitaram o aumento das emissões de CO2 em ambas as cidades. Para reduzir as emissões de
CO2 nos transportes, SP e XG devem se concentrar em políticas públicas para incentivar o transporte público
de baixo carbono e limitar a queima de combustíveis fósseis.
496%, its per capita income increased 333%, and the population expanded 37%. Although SH’s energy mix is predominantly carbon intensive, the city has active policies to promote EV.
The comparison of these cities by assessing their strategies to mitigate GHG emissions from road transportation will help better understanding the effectiveness of mitigation processes and may reveal the most adequate policies to reduce the impacts of transportation (Hannisdahl et al., 2013; Holtsmark & Skonhoft, 2014; Sierzchula et al., 2014).
Therefore, the aim of this study is to identify and compare the profile of energy consumption and CO2 emissions of urban road fleets of SP and SH,
during the first decade of the XXI century, in order to correlate the mitigation actions taken by both cities (Gibbs et al., 2014; Håkansson & Finnveden, 2015; Harris, 2001). This study will provide assistance for decision makers in other cities in the process of mitigating GHG emissions from road transportation.
The next section of this paper presents the methodology used to compare both cities, and the third section will reveal the data collection covering the urban road transportation sector both in SP and SH. The fourth section correlates and discusses the data, followed by the closing remarks.
Methodology
A methodology based on secondary data that applied the top-down guidelines recommended by the IPCC (Treanton et al., 2006) was used to estimate CO2 emissions based on fuel consumption from road vehicles in SP and SH. Data was processed in order to perform its equalization, enabling the comparison of both cities. In the first step, energy consumption data was harmonized in terms of energy units, as presented in Equation 1 for the Sao Paulo case (where fuel consumption data was available in volume), and Equation 2 for the Shanghai case (where data was available in tons of standard coal).
3 41,868 10 CC = CA x Fc x x −x Fr (1) Where: 1 tOE = 41,868 x PJ (terajoule = 1012 J). CC = energy consumption in TJ.
CA = fuel consumption based of fuel sales (m3).
Fc = the physical drive conversion factor measurement of the amount of fuel to toe on the basis of the fuel gross calorific value (HHV). The values used were gasoline 0.771 tOE / m3; anhydrous alcohol 0.534 tOE / m3;
hydrous ethanol 0.510 tOE / m3; diesel 0.848 tOE / m3;
dry natural gas 0.880 tOE / m3.
Fr = PCS correction factor for PCI (lower heating value). In BEN the energy content is based on the PCS but multiplying consumption by PCI should make conversion to common unit of energy. For solid and liquid fuels, the Fcorr = 0.95 and gaseous fuels, Fr = 0.90, according to Ministry of Science and Technology - MCT.
For the China case, the conversion from tons of standard coal to energy units was calculated using the following equation:
( )
/100
CC = CA x Fc (2)
Where:
CC = Energy consumption in PJ.
CA = Energy consumption in tons of standard coal based of fuel sales.
Fc = Conversion coefficient tons of coal for gigajoule of 29.39.
100 = Coefficient resulting mathematical rounding of 10,000 tons of coal to PJ.
The quantification of CO2 emissions was calculated using Equation 3: 2 * co Q = Ej Cj (3) Where: Q = Emissions of CO2 in tons.
Ej = Energy consumption in Joules per type of fuel. CjCO2 = CO2 Emission factor of CO2 (in tons per Joule)
per type of fuel.
Both the energy coefficient and the CO2 emissions
were calculated for each year of the periods assessed. This resulted mainly from the variations in the ratio of anhydrous ethanol mixed with gasoline. Consequently, the following information was used:
• Economic and social data of the cities of SP and SH;
• Data on the number of urban road vehicles; • Energy consumption of the fleets of both cities; • Values of CO2 emission rates by fuel type; and
The applied methodology for assessing energy consumption and CO2 emissions of urban road transportation is summarized in Figure 1. The comparison of energy consumption and CO2 fleet emissions for urban road vehicles in both cities was limited to the period of 2003-2010, due to data availability. In regards to fuel consumption in SP, there was not enough available data for other modes of transportation, such as trains and vessels, and these emission modes were not accounted for. Hence, the fuel consumptions associated to rail and waterway transportation (considered not relevant due to the low consumption of this type of transportation in SP) were incorporated into the roadway item and accounted under these emission factors. In SP, the moped and scooter emissions were accounted in the motorcycles category.
The applied methodology will allow assessing which of the fleets consumes more energy and emits more CO2, what kind of transportation each city prioritizes, what are the strategies of each city to reduce CO2
emissions, and how do we evaluate these strategies in light of the obvious differences in size, urban form and rates of economic and other forms of growth.
Data collection for SP and SH Vehicle fleet of SP
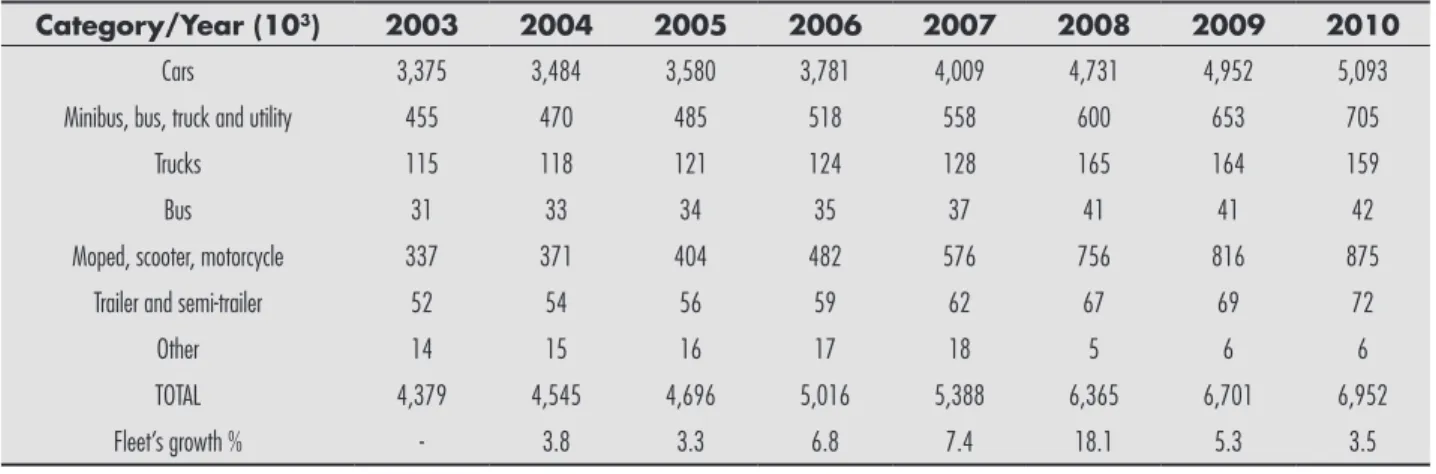
In 2010, with an urban road fleet estimated at nearly 7 million motor vehicles and a growth of almost 59% regarding 2003, SP has the largest fleet among Brazilian cities with 73% being LDV (Detran, 2015). The average annual growth of the fleet of SP in the analyzed period was 7%. In 2008, the greatest increase occurred due to government incentives to the automotive industry. From 2003 to 2010, the fleet segment grew 59%. The highest growth was motorcycles with an estimated increase of 160%, while the bus fleet grew 35%. The cars segment grew 51% and trucks, 55%, occupying thus the second place, as shown in Table 1.
In 2003, SP had around 42,000 vehicles per 100,000 inhabitants. In 2010, this proportion increased to almost 62,000 vehicles per 100,000 inhabitants, representing a 47% growth. In 2010, small passenger cars were more than 45,000 units for 100,000 inhabitants, leading in terms of volume.
Figure 1 - Model for research Source: authors.
Table 1 - Motor vehicle fleet evolution in SP: 2003-2010
Category/Year (103) 2003 2004 2005 2006 2007 2008 2009 2010
Cars 3,375 3,484 3,580 3,781 4,009 4,731 4,952 5,093
Minibus, bus, truck and utility 455 470 485 518 558 600 653 705
Trucks 115 118 121 124 128 165 164 159
Bus 31 33 34 35 37 41 41 42
Moped, scooter, motorcycle 337 371 404 482 576 756 816 875
Trailer and semi-trailer 52 54 56 59 62 67 69 72
Other 14 15 16 17 18 5 6 6
TOTAL 4,379 4,545 4,696 5,016 5,388 6,365 6,701 6,952
Fleet’s growth % - 3.8 3.3 6.8 7.4 18.1 5.3 3.5
However, the greatest evolution in percentage occurred for motorcycles, since it went from 3,000 units for 100,000 inhabitants in 2003 to almost 8,000 in 2010, representing more than 140% increase. This is a point of contrast with the city of SH, which outlawed sales of internal combustion motorcycles to reduce emissions, replacing them with e-scooters, e-bikes and bikes.
Energy consumption of the fleet of SP
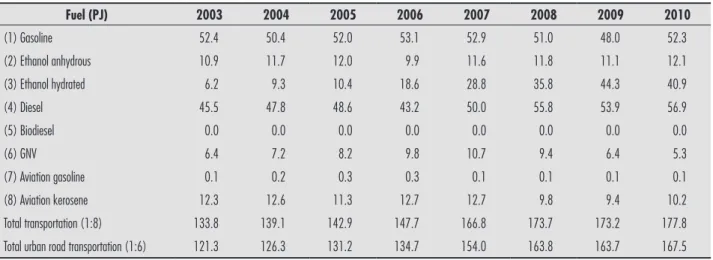
In 2010, the transportation energy consumption of the largest Brazilian metropolis transportation was about 177 PJ, and it grew about 33% over 2003.
The urban road transportation in the Sao Paulo municipality consumed around 167 PJ, which grew 38% since 2003 (the fleet grew 59% in the same period), accounting about 94% of the total consumption of SP road transportation (Table 2). The fleet growth (Table 1) was substantially higher than the energy consumption (Table 2), which indicates that the fleet has become more efficient throughout these years (more ethanol share). Regarding per capita energy consumption, in 2003, the consumption of SH was 32% higher than SP, increasing to almost 50% in 2010.
According to the Agência Nacional do Petróleo,
Gás Natural-ANP [National Agency of Petroleum,
Natural Gas and Biofuels], Brazil spent US$ 4.4 billion on gasoline imports in the triennium 2010/2012. In 2012, the country registered a record by importing
3.8 billion liters of gasoline (Governo do Estado de São Paulo: Secretaria do Meio Ambiente. Companhia Ambiental do Estado de São Paulo, 2014a).
In 2003, the share of gasoline in the total consumption of urban road transportation was 43%, having decreased to 31% in 2010. The start-analyzed period, consumption of diesel is about 37% and it dropped to 34% in 2010. It is the largest energy source used by SP’s fleet, mainly due to the heavy-duty vehicle (HDV) fleet. At the end of the first decade of this century, fossil fuel (gasoline and diesel) accounted for 65% of the energy consumption of urban road transportation in SP, as shown in Tables 2 and 10.
CO2 emissions of SP from road urban transportation
According to the Nature and Environment Secretary of the City of SP, the energy industry to which the transportation is integrated represents 82% of emissions, resulting from fuel combustion.
In 2010, the transportation sector in SP accounted for 71% of the emissions related to the energy sector, including fugitive emissions (São Paulo, 2013) and CO2 emissions from road urban transportation in the city of SP were 11.8 CO2PJ and have grown 38% if compared to 2003. Thus, CO2 emissions from diesel
grew 25% in the same period (from 3.3 to 4.2 CO2PJ) with gasoline emissions remaining stable, as shown in Figure 2.
Table 2 - Energy consumption of the transportation sector in SP: 2003-2010
Fuel (PJ) 2003 2004 2005 2006 2007 2008 2009 2010 (1) Gasoline 52.4 50.4 52.0 53.1 52.9 51.0 48.0 52.3 (2) Ethanol anhydrous 10.9 11.7 12.0 9.9 11.6 11.8 11.1 12.1 (3) Ethanol hydrated 6.2 9.3 10.4 18.6 28.8 35.8 44.3 40.9 (4) Diesel 45.5 47.8 48.6 43.2 50.0 55.8 53.9 56.9 (5) Biodiesel 0.0 0.0 0.0 0.0 0.0 0.0 0.0 0.0 (6) GNV 6.4 7.2 8.2 9.8 10.7 9.4 6.4 5.3 (7) Aviation gasoline 0.1 0.2 0.3 0.3 0.1 0.1 0.1 0.1 (8) Aviation kerosene 12.3 12.6 11.3 12.7 12.7 9.8 9.4 10.2 Total transportation (1:8) 133.8 139.1 142.9 147.7 166.8 173.7 173.2 177.8
Total urban road transportation (1:6) 121.3 126.3 131.2 134.7 154.0 163.8 163.7 167.5
Actions to mitigate the SP’s fleet CO2 emissions
SP has given some demonstrations of commitment to the mitigation of transportation emissions in order to improve air quality and prevent climate change. In spite of that, emissions - especially from motor vehicles - have increased, but they would have reached an even higher level if those actions had not been implemented. In this context, the main actions taken to reduce emissions in SP have been the following: A. In 2009, the creation of the law 14933 set the
goal of reducing GHG in SP by 30% by 2012, in comparison to 2003 (São Paulo, 2015a).
B. In 1997, the creation of the Restriction Program For Motor Vehicle Traffic in SP. This regulation applied based on license-rotation to restrict vehicle access in some areas of the city (São Paulo, 2015a). However, this action has not been sufficient to prevent the growth of vehicle emissions in the analyzed period.
C. In 1993, the Secretariat of Green and Environment was created to carry out emission inventories (São Paulo, 2015b).
D. In 1975, the National Alcohol Program (Proálcool) was created in order to produce ethanol as an alternative to gasoline consumption. The Brazilian federal government funded the program after the oil crisis of 1973. The Proálcool allowed Brazil
to replace 25% of the gasoline consumption (Cavalcanti, 1992; Ferreira & Ruas, 2000). E. The Brazilian legislation of road vehicle emissions
control follows the characteristics of Euro directive (Ministério do Meio Ambiente, 2015) but with its own nomenclature (P= heavy, L= light).
After the analyzed period, the municipal law 15997/2014 was created, implementing tax incentives for the ownership of electric and hybrids cars in Brazil’s largest city (São Paulo, 2014b). The owners had a discount of 50% on the registration fee and they were released from the system of license control. Nonetheless, the total number of EV part of the fleet of SP is so small that they are not relevant from an energy consumption standpoint.
SH urban road transportation
China is the largest market for automobiles in the world, but its statistics regarding the automotive sector are so far quite limited (Huo et al., 2012). With an urban road fleet estimated of 2.5 million motor vehicles in 2010 (Annual Report, 2015a, 2015b), and a growth of 42% from 2003 to 2010, SH’s fleet grew at an average annual rate of 5% in the analyzed period. In 2004, occurred the greatest increase (15%). The Chinese road transportation sector is dominated by LDV that represent 68% of
Figure 2 - CO2 emissions from fuel consumption of motor vehicles in SP: 2003-2010
the total fleet of vehicles (HDV account for 17%), as shown in Table 3. Although private cars have a large participation in transportation, the SH government has kept a restrictive policy towards car ownership (Gordon & Sperling, 2009).
From 2003 to 2010, SH maintained a share of 10,000 vehicles for each 100,000 inhabitants. This fact was due to the population growth, which has been higher than the growth of the city’s vehicle fleet. Small passenger cars registered the highest growth (95%).
Energy consumption of the SH urban road transportation
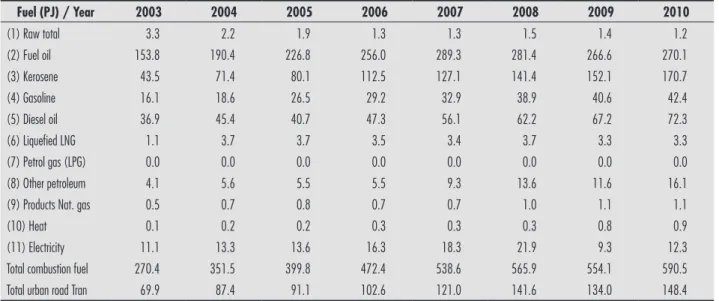
The total energy consumption in SH in 2010 is around 590 PJ, and urban road transportation about 148 PJ.
Around 25% of the total energy consumed is burned fuel by road vehicles, as shown in Table 4. Diesel (49%) and gasoline (29%) together accounted for 78% of the total energy consumed in urban road
Table 3 - Current urban road transportation of Shanghai Municipality: 2003-2010
Categories (103) 2003 2004 2005 2006 2007 2008 2009 2010
Car Small Passenger* 505 609 715 819 936 1,046 1,180 1,355
Large coach 33 34 35 36 39 47 54 63 Truck 185 199 204 201 209 213 216 230 Other 30 30 34 39 45 49 52 58 (A) Subtotal 753 872 988 1,095 1,229 1,355 1,502 1,707 Motorcycle Motorcycle 125 111 98 81 73 67 63 58 Moped 863 1,024 1,019 944 956 909 853 706 (B) Subtotal 988 1,135 1,117 1,025 1,029 976 917 764 Other 8 9 10 11 12 13 14 16
Total Vehicle (A+B) 1,749 2,016 2,115 2,131 2,270 2,344 2,434 2,488
Fleet’s evolution % - 15.3 4.9 0.8 6.6 3.3 3.8 2.2
*It includes small buses and vans. Data source: (Annual Report, 2015a, 2015b).
Table 4 - Energy consumption of the urban road transportation of Shanghai: 2003-2010
Fuel (PJ) / Year 2003 2004 2005 2006 2007 2008 2009 2010 (1) Raw total 3.3 2.2 1.9 1.3 1.3 1.5 1.4 1.2 (2) Fuel oil 153.8 190.4 226.8 256.0 289.3 281.4 266.6 270.1 (3) Kerosene 43.5 71.4 80.1 112.5 127.1 141.4 152.1 170.7 (4) Gasoline 16.1 18.6 26.5 29.2 32.9 38.9 40.6 42.4 (5) Diesel oil 36.9 45.4 40.7 47.3 56.1 62.2 67.2 72.3 (6) Liquefied LNG 1.1 3.7 3.7 3.5 3.4 3.7 3.3 3.3 (7) Petrol gas (LPG) 0.0 0.0 0.0 0.0 0.0 0.0 0.0 0.0 (8) Other petroleum 4.1 5.6 5.5 5.5 9.3 13.6 11.6 16.1
(9) Products Nat. gas 0.5 0.7 0.8 0.7 0.7 1.0 1.1 1.1
(10) Heat 0.1 0.2 0.2 0.3 0.3 0.3 0.8 0.9
(11) Electricity 11.1 13.3 13.6 16.3 18.3 21.9 9.3 12.3
Total combustion fuel 270.4 351.5 399.8 472.4 538.6 565.9 554.1 590.5
Total urban road Tran 69.9 87.4 91.1 102.6 121.0 141.6 134.0 148.4
transportation. In 2010, the gasoline consumption of the SH urban road transportation grew 163% in relation to 2003. In the same period, diesel increased by 96%, as shown in Table 4.
The emissions of road vehicles have become a dominant source of local air pollution in major Chinese cities. (Huo et al., 2011).
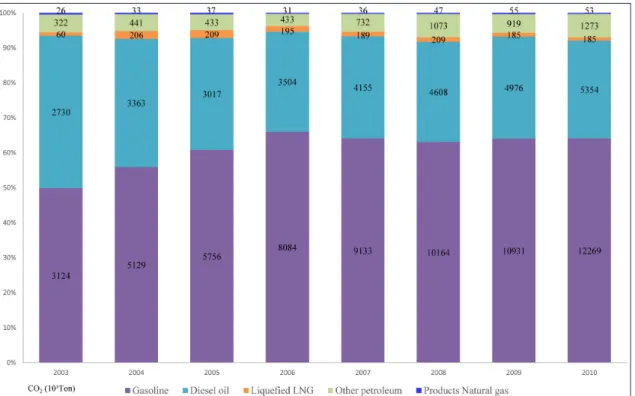
SH is among the three largest cities in the country and Government policies have failed to prevent the increase in emissions from motor vehicles (Huo et al., 2011). From 2003 to 2010, CO2 transportation emissions
from burning fuels in SH grew about 120%. In this period, CO2 emission from urban road transportation increased 306%. The energy consumption of road urban transportation grew significantly more than it did for other types of transportation - diesel (28%) and gasoline (64%) together accounted for 92% of CO2 emissions of SH urban road transportation,
dominating road transportation emissions - as shown in Figure 3 and Table 11.
Air pollution has increased faster than the global average in many Chinese cities. The Chinese government has increasingly focused its attention in reducing emissions from motor vehicles. Air pollution related to transportation costs about 8.7 million US$ to the
country (Bhalla et al., 2014). The main measures implemented by the government to reduce air pollution from road urban transportation in SH have been the following (The World Bank Group, 2015; China, 2014; International Council on Clean Transportation, 2015; Feng & Li, 2013; Lohry et al., 2014):
A. In 2002, SH banned the circulation of internal combustion motorcycles in urban centers. B. Since 2001, China adopted control emissions
standards (Euro equivalent).
C. In 1986, SH adopted the auction system for Private Car Licenses whereby the government sells permit for car buyers, facilitating control of the private fleet expansion, and in 2000 the rules have become more restrictive.
D. The SH government states that during peak hours, vehicles that are not registered in the city cannot drive in the city.
After the analyzed period, three other measures were adopted:
Figure 3 - CO2 emissions of the SH municipal urban road transportation: 2003-2010
A. From 2014 on (until 2020), SH offers free license to buyers of green vehicles (license costs around US$ 12,000), plus other benefits, like not being subject to limited circulation. However, to be eligible, vehicles need to be manufactured in China and, in some cases, in the region where the benefit is offered. The control of the fleet in SH is being accomplished without major disruptions to the economy. The same cannot be said about the attempts of the central government to remove the yellow label vehicles because many of them are being sold in the black market in rural areas where it is not easy to control them.
B. In 2015, SH has provided licenses only for owners of class V Chinese vehicles, and
C. The Chinese government adopted the China V emission standard (equivalent to Euro V) for gasoline and diesel vehicles [10].
Correlation analysis
SP selects the fleet based on the type of vehicles (LDV and HDV) and SH on fuel type (gasoline and diesel). The CO2 emission mitigation policies are
shown in Table 5.
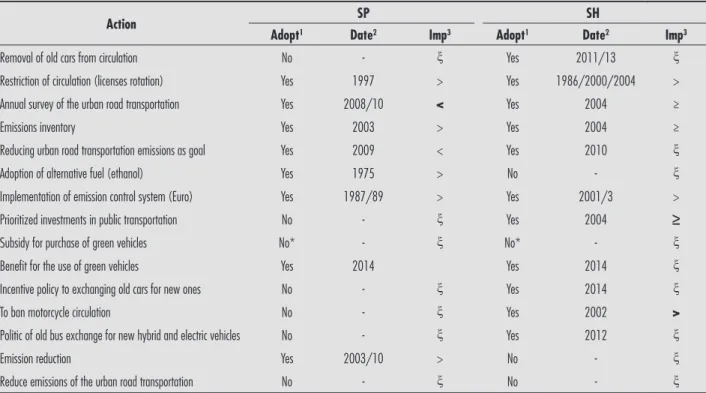
Correlation of the actions to mitigate CO2 emissions in SP and SH’s urban road transportation
In the analyzed period, not all the CO2 emission mitigation actions taken by these cities have been unsuccessful. Mitigation actions taken prior to 2000 had the most impact to mitigate emissions in the first decade of this century. During the analyzed period, the policies adopted did not have significant impact, since many of them only came into force after 2010, as shown in Table 5.
Table 5 - Actions to mitigate CO2 emissions from 2000 to 2010 in SP and SH
Action SP SH
Adopt1 Date2 Imp3 Adopt1 Date2 Imp3
Removal of old cars from circulation No - ξ Yes 2011/13 ξ
Restriction of circulation (licenses rotation) Yes 1997 > Yes 1986/2000/2004 >
Annual survey of the urban road transportation Yes 2008/10 < Yes 2004 ≥
Emissions inventory Yes 2003 > Yes 2004 ≥
Reducing urban road transportation emissions as goal Yes 2009 < Yes 2010 ξ
Adoption of alternative fuel (ethanol) Yes 1975 > No - ξ
Implementation of emission control system (Euro) Yes 1987/89 > Yes 2001/3 >
Prioritized investments in public transportation No - ξ Yes 2004 ≥
Subsidy for purchase of green vehicles No* - ξ No* - ξ
Benefit for the use of green vehicles Yes 2014 Yes 2014 ξ
Incentive policy to exchanging old cars for new ones No - ξ Yes 2014 ξ
To ban motorcycle circulation No - ξ Yes 2002 >
Politic of old bus exchange for new hybrid and electric vehicles No - ξ Yes 2012 ξ
Emission reduction Yes 2003/10 > No - ξ
Reduce emissions of the urban road transportation No - ξ No - ξ
1In the case, the city implemented the policy. 2Date the city implemented the policy. 3How important was the policy to mitigate CO
2 in the first 2000 decade, where: > Very Large
Impact; ≥ Relevant; < Low relevance; ξ No relevance. *SH offers free license and SP discount, both considered in this study as “Benefit to use green vehicles”. Data source: (Minis-tério do Meio Ambiente, 2015; China, 2012b; Chan & Yao, 2008; International Council on Clean Transportation, 2015; Lohry et al., 2014; São Paulo, 2014c; São Paulo, 2015a).
Recent case studies compared electric and hybrid mobility between seven regions: Norway, Netherlands, California, United States, Japan, France and Germany showing how useful it is for policy makers, society and other stakeholders.
These studies help to understand the social, economic, political and environmental contributions in adopting electric and hybrid vehicles (Vergis et al., 2014).
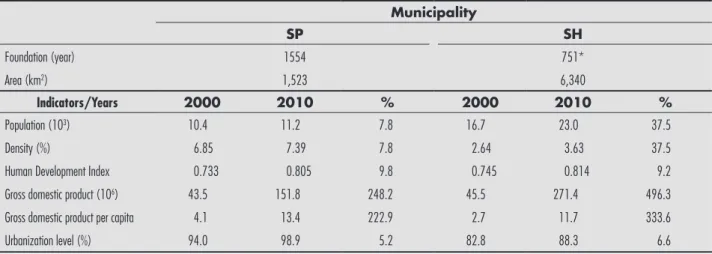
Correlation economic and social data from SP and SH municipalities
Albeit SH has twice the area and population of SP, the Brazilian city has a larger concentrated population and urbanization rate: this rate is 11% higher if compared to the Chinese metropolis. Even though in 2010 SH GDP was 179% higher, SP’s per capita income is 14% higher than in the Chinese city (Table 6). SH was driven by substantial growth of the Chinese economy with an average annual rate of 8% in the analyzed period (The World Bank Group, 2015) and a significant population growth (Table 6) due to the migration from the countryside to the city. On the other hand, the city of SP did not have the same trend, because of low economic growth (around 2% (The World Bank Group, 2015)) and the tax competition among Brazilian states to attract producers (Macedo & Angelis, 2013; Torres, 2012).
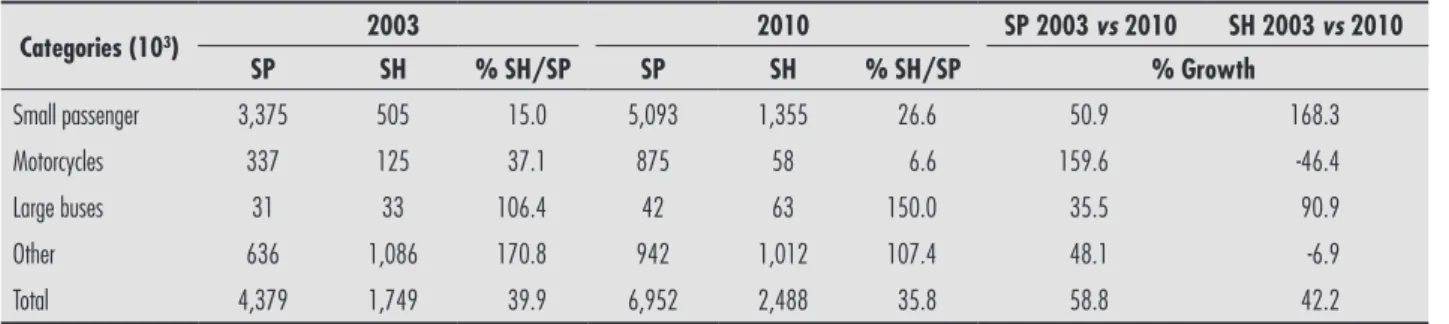
Performance of urban road transportation of SP and SH
From 2003 to 2010, the Brazilian city fleet experienced a noticeable growth, higher than SH. In SP, the largest increase in fleet segment occurred in small passenger vehicles (51%) and motorcycles (160%). In China, the most significant growth was LDV’s (168%) and buses (100%). While in the beginning of this century SH and SP had quite a similar bus fleet size, by the end of the first decade the fleet of the Chinese city has surpassed the Brazilian city’s fleet by 50%, as shown in Table 7.
The data suggests that SH prioritized public transportation while SP expanded individual transportation. In this stage, the question “what kind of transportation does each city prioritize?” was answered. In the analyzed period, SH halved its motorcycle fleet while SP more than doubled its motorcycle fleet.
This fact is explained by the restrictive policy of circulation of this type of vehicle (equipped with internal combustion engine) in SH and in major Chinese cities (Yang, 2010).
Comparison of urban road transportation of SP and SH for 100,000 residents
In 2003, SP had four times more urban vehicles per 100,000 residents than SH (Table 8).
Table 6 - Economic and social data from SP and SH municipalities Municipality SP SH Foundation (year) 1554 751* Area (km2) 1,523 6,340 Indicators/Years 2000 2010 % 2000 2010 % Population (103) 10.4 11.2 7.8 16.7 23.0 37.5 Density (%) 6.85 7.39 7.8 2.64 3.63 37.5
Human Development Index 0.733 0.805 9.8 0.745 0.814 9.2
Gross domestic product (106) 43.5 151.8 248.2 45.5 271.4 496.3
Gross domestic product per capita 4.1 13.4 222.9 2.7 11.7 333.6
Urbanization level (%) 94.0 98.9 5.2 82.8 88.3 6.6
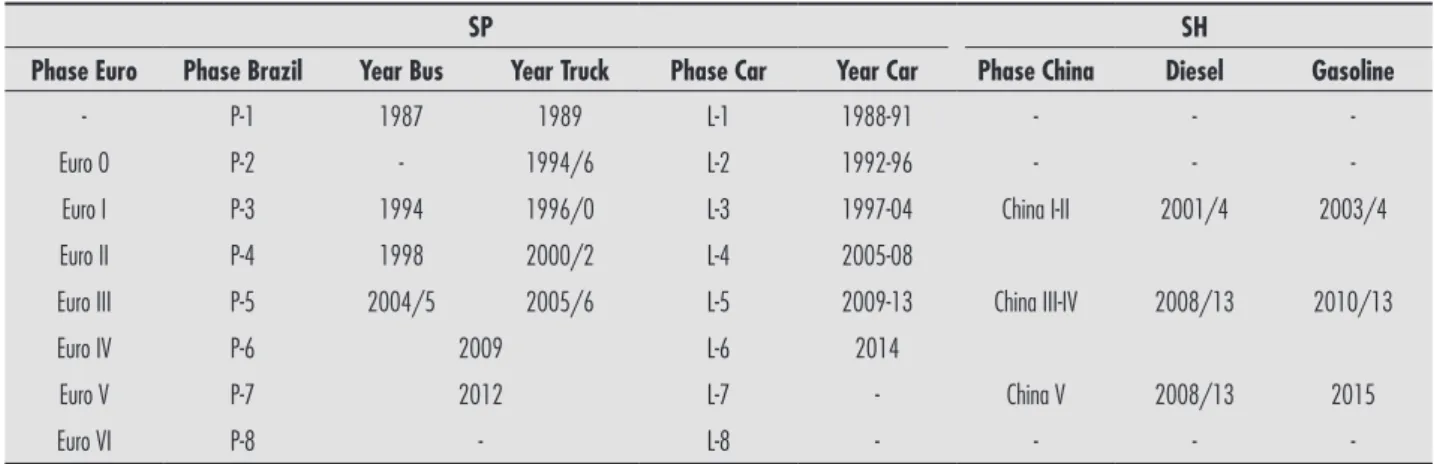
Correlation by emission of urban motor vehicle of SP and SH in the 2000s
The largest Brazilian city implemented emission controls a few years ahead of the Chinese city. In 1994, SP started diesel control (equivalent to Euro I) and SH started it in 2001, as shown in Table 9.
Regarding gasoline consumption, SP adopted norms equivalent to Euro I in 1997 and SH started it in 2003 (Table 9), suggesting that the Brazilian city fleet should have less emissions than the Chinese city.
Correlation between the energy consumption of SP and SH’s urban road transportation
From 2003-2010, the energy consumption of SH fleet grew more than four times compared to SP. The Chinese city significantly increased gasoline consumption (163%), while in SP almost no growth
was observed in the same period. The significant increase in consumption of urban transportation in the Chinese city (with a low fleet growth) can be explained by a greater use of public transportation. The restriction of the use of motorcycles and LDV has forced an increase in the public transportation offer in SH. In 2010, the consumption of gasoline in SH was about 30% (in 2010, it was 36%) of the SP gasoline consumption (Table 10) due to the SH’s car fleet that was about six times smaller than SP.
Regarding the consumption of diesel, in 2003 SP consumed about 20% more diesel than SH. In 2010, it was the opposite, and SH began to use around 27% more than SP (Table 10). The increase of diesel consumption in SH (96%) is explained by the increase of about 25% of the truck fleet, 91% of the bus fleet, and the public transportation growth. The population of SH in the first decade of the 21st century increased
37%, as shown in Table 10. From 2003 to 2010, the energy consumption grew about 38% in SP (Table 10),
Table 7 - Analysis of urban road transportation in Sao Paulo (SP) and Shanghai (SH)
Categories (103) 2003 2010 SP 2003 vs 2010 SH 2003 vs 2010 SP SH % SH/SP SP SH % SH/SP % Growth Small passenger 3,375 505 15.0 5,093 1,355 26.6 50.9 168.3 Motorcycles 337 125 37.1 875 58 6.6 159.6 -46.4 Large buses 31 33 106.4 42 63 150.0 35.5 90.9 Other 636 1,086 170.8 942 1,012 107.4 48.1 -6.9 Total 4,379 1,749 39.9 6,952 2,488 35.8 58.8 42.2
Data source: (Annual Report, 2015a, 2015b; DENATRAN, 2015b).
Table 8 - Urban road transportation for 100,000 residents: SP vs SH-2003/2010
SP vs SH: vehicle 100,000 residents 2003 2010
Per capita rate / Vehicle type SP SH SP/SH* SP SH SP/SH*
Small passenger 32,353 0.302 107 45,259 0.589 77 Large coach 0.299 0.020 15 0.374 0.027 14 Truck 1,111 0.111 10 1,416 0.100 14 Motorcycle 3,231 0.075 43 7,783 0.025 309 Other 5,011 0.538 9 6,969 0.339 21 Total 42,005 10,448 4 61,801 10,807 6
while the fleet of vehicles grew 59% during the same period, revealing that the fleet has become more efficient.
In 2003, SH’s road fleet was about 55% less energy consuming than the SP’s fleet. In 2010, it was 11% less energy consuming. From 2003 to 2010, SP per capita energy consumption grew 38%, while SH grew 112% (Table 10), revealing that ethanol had an important role in preventing the growth of energy consumption in SP (SP fleet grew 59% in the same period). The growth of the truck fleet (Table 7) that is powered by diesel oil (38%) causes higher energy consumption in the Brazilian city in 25% (Table 10). This data also reveals that both cities are increasing the energy consumption of urban road transportation.
The substantial increase in ethanol consumption is explained by the significant growth of the flex fuel vehicle fleet in SP (and in Brazil). A study about the SP fleet showed that the number of flex cars continued to grow even after 2010, representing 53% of the total city fleet in 2012 (Costa & Seixas, 2014). In addition, the low energy consumption of the SP’s fleet compared to SH fleet is because LDVs are relatively new, benefiting from legislation regarding the control of automotive pollutants and the developments in the energy efficiency of the automobile industry (Zamboni et al., 2015).
Even though this study focused on urban road fleet, it revealed that SH also uses water as main transportation due to the seaport connection with various areas of the city by the Huangpu River. In contrast, the city of
Table 9 - Implementation phases of the standards for vehicle emissions: SP vs SH
SP SH
Phase Euro Phase Brazil Year Bus Year Truck Phase Car Year Car Phase China Diesel Gasoline
- P-1 1987 1989 L-1 1988-91 - -
-Euro 0 P-2 - 1994/6 L-2 1992-96 - -
-Euro I P-3 1994 1996/0 L-3 1997-04 China I-II 2001/4 2003/4
Euro II P-4 1998 2000/2 L-4 2005-08
Euro III P-5 2004/5 2005/6 L-5 2009-13 China III-IV 2008/13 2010/13
Euro IV P-6 2009 L-6 2014
Euro V P-7 2012 L-7 - China V 2008/13 2015
Euro VI P-8 - L-8 - - -
-Data source: (Huo et al., 2011; São Paulo, 2015a; China, 2011).
Table 10 - Analysis of energy consumption of urban road transportation SP and SH
Categories (PJ) 2003 2010 SP 03 vs 10 SH 03 vs 10 SP SH % SH/SP SP SH % SH/SP % Growth Gasoline 52.4 16.1 30.7 52.3 42.4 36.3 0.0 163.3 Diesel oil 45.5 36.9 81.1 56.9 72.3 27.1 25.0 95.9 Ethanol anhydrous 10.9 0.0 - 12.1 0.0 - 11.0 0.0 Ethanol hydrated 6.2 0.0 - 40.9 0.0 - 659.6 0.0 Other 6.4 16.9 89.9 5.3 33.7 635.8 (17.2) 99.4
Total urban road transportation 121.4 69.9 55.1 167.5 148.4 88.6 38.0 112.3
Per capita consumption (MJ) 30.2 39.9 32.3 35.1 59.6 69.9 16.2 49.2
SP does not have this feature, which is the reason why this mode of transportation is negligible.
Correlation of CO2 emissions of urban road transportation of SP and SH municipalities
In the period analyzed, SH doubled its emissions while SP had a 25% growth. In 2003, the urban fleet of SP was responsible for more than twice the CO2
emissions than the SH fleet. In 2010, this situation was reversed and SH registered nearly 20% more CO2
emissions in relation to SP. To paraphrase Sperling, “From Paris to Fresno, and Delhi to Shanghai, conventional motorization, conventional vehicles and conventional fuels are choking cities, literally and figuratively” (Sperling & Gordon, 2010, p. 1).
The figures show that government efforts to limit individual transportation — even though significantly — reduced the number of motorcycles in circulation.
In 2003, CO2 emission from gasoline consume by
the SH fleet was around 39% of the SP emissions. In 2010, there was another reversal of values and the Chinese city exceeded the emissions from the Brazilian city by 152%. Regarding CO2 emission from diesel oil, in 2003, SH was 81% of the SP emission (Table 11). In 2010, it grew to 127%.
In 2003, the SH’s per capita emissions of CO2 were 21% higher than the SP’s. In 2010, per capita emissions of the Chinese city fleet were 329% higher than in the Brazilian. Between 2003 and 2010, SP increased 26% its fleet CO2 emissions, and SH in the period prescribed, increased it in about 206%. Ethanol helped to keep SP’s CO2 emissions even higher.
However, the EV has greater potential of mitigation. A study on the potential mitigation of emissions in SP adopting EV concluded that replacing 100% of the gasoline cars would provide a reduction of 11 GtCO2 in 2030 (Costa & Seixas, 2014).
Conclusion
The comparative analysis of CO2 emissions between
SH and SP indicated that mitigation policies and measures taken in that period were not sufficient to prevent the growth of CO2 emissions in both cities. Actions beyond those already implemented are needed to curb CO2 emissions and its contribution to climate
change. SP should act mainly to reduce the individual transportation by increasing public transportation, while SH should reduce the consumption of dirty fuel. This study also revealed that in order to reduce transportation emissions, in addition to restricting vehicle ownership and use of individual vehicles, it is necessary to ensure that the purchases of new vehicles, if they happen, are of low emission vehicles. In this case, there should be a package of measures that includes incentives capable of making the TCO of low emission vehicles attractive to its owner.
Regarding the urban road transportation, some actions have the potential to mitigate the burning of fossil and CO2 emissions, as: a) improve vehicle’s efficiency; b) replace polluting vehicles (old) by low emission vehicles; c) discourage the use of internal combustion engines; and d) encourage the use of green mobility. In this context, it is recommended that future studies be performed to update public
Table 11 - Analysis of CO2 emissions from urban road transportation of SP and SH
CO2 emission (PJ) 2003 2010 SP 2003 × 2010 SH 2003 × 2010 SP SH % SH/SP SP SH % SH/SP % Growth Gasoline 8,014 3,124 39.0 8,082 12,268 151.8 0.8 292.7 Diesel oil 3,369 2,729 81.0 4,213 5,353 127.1 25.1 96.1 Ethanol hydrous 425 0.0 - 2,821 0,0 - 563.8 0.0 Other 1,111 407 36.6 1,133 1,511 133.4 1.9 271.5 Total 12,919 6,261 48.5 16,249 19,133 117.7 25.8 205.6
Per capita emission 2.95 3.58 21.4 2.34 7.69 328.6 (20.7) 214.8
policies and evaluate the effects of the mitigation measures adopted by both cities in the ongoing decade. The scarcity of data limited in some ways the performance of this study.
Acknowledgements
The authors would like to thank the Hengbing Zhao for their support in some translation and reviewers: Daniel Sperling, Lew Fulton, Sonia Yeh of UC Davis; Emma Hanley, Tarun Sharma of University College Cork, Jair Rattner of Nova University of Lisbon and blind peer reviewers and editor’s review for their generous help. The third author thanks Fundação para a Ciência e Tecnologia for the IN+Strategie Project UID/EEA/50009/2013.
REFERENCES
Annual Report, (2015a). Shanghai comprehensive transportation sportation Annual Report 2003-07. Retrieved in 2015, April 17, from http://wenku.baidu. com/view/7bded93c2af90242a895e5e7.htm
Annual Report, (2015b). Shanghai comprehensive transportation sportation Annual Report 2009-10. Retrieved in 2015, April 19, from http://wenku.baidu. com/view/2b160f8384868762caaed57f.html
Bhalla, K., Shotten, M., Cohen, A., Brauer, M., Shahraz, S., Burnett, R., Murray, C. (2014). Transport for health: the global burden of disease from motorized road transport. Washington: The World Bank.
Cavalcanti, G. A. (1992). A dinâmica do proálcool: acumulação e crise 1975-1989. Revista Brasileira de Energia, 2(1), 1-9. Retrieved in 2015, April 10, from: https://sbpe.org.br/ index.php/rbe/article/view/33/33
Chan, C. K., & Yao, X. (2008). Air pollution in mega cities in China. Atmospheric Environment, 42(1), 1-42. http:// dx.doi.org/10.1016/j.atmosenv.2007.09.003.
China. (2011). China monthly statistic book. Beijing: National Bureau of Statistics of China, Government of China. China. (2012). China economic monitoring & analysis center national bureau of statistic. Beijing: Government of China. China. (2014). China’s policies and actions on climate change. Retrieved in 2015, March 11, from http://
en.ccchina.gov.cn/archiver/ccchinaen/UpFile/Files/ Default/20141126133727751798.pdf
China. (2015). State council on the issuance of energy-saving and new energy automotive industry development plan (2012-2020) of the notice. Retrieved in 2015, March 02, from http://www.gov.cn/zwgk/2012-07/09/ content_2179032.htm
Costa, E., & Seixas, J. (2014). Contribution of electric cars to
the mitigation of CO2 emissions in the city of Sao Paulo. In
Proceedings of The Vehicle Power and Propulsion Conference (pp. 1-5). Coimbra: IEEE.
Departamento de Trânsito – DETRAN. (2015). Estatísticas de trânsito. São Paulo: Detran. Retrieved in 2015, April 09, from http://www.detran.sp.gov.br/wps/portal/portaldetran/ detran/estatisticastransito
Departamento Nacional de Trânsito – DENATRAN. (2015a). Anuário frota de veículos automotores. Brasília: Denatran. Retrieved in 2015, July 21, from http://www.denatran. gov.br/frota.htm
Departamento Nacional de Trânsito – DENATRAN. (2015b). Frota de veículos. Brasília: Denatran. Retrieved in 2017, June 11, from http://www.denatran.gov.br/frota2013.htm Feng, S., & Li, Q. (2013). Car ownership control in chinese mega cities: shanghai, beijing and guangzhou. Journeys (LTA Academy Singapore), 40-49. http://dx.doi.org/10.2139/ ssrn.3106623.
Ferreira, E. R., & Ruas, D. (2000). As políticas da agroindústria canavieira e o Proálcool no Brasil. Marília: Unesp Marília Publicações.
Gibbs, D., Rigot-Muller, P., Mangan, J., & Lalwani, C. (2014). The role of sea ports in end-to-end maritime transport chain emissions. Energy Policy, 64(1), 337-348. http:// dx.doi.org/10.1016/j.enpol.2013.09.024.
Gordon, D., & Sperling, D. (2009). Surviving two billion cars: China must lead the way. New Haven: Yale Environment 360. Retrieved in 2015, May 13, from https://e360.yale.edu/ features/surviving_two_billion_cars_china_must_lead_the_way Håkansson, C., & Finnveden, G. (2015). Indirect rebound and reverse rebound effects in the ICT-sector and emissions of CO2. In Proceedings of 29th International Conference on Informatics for Environmental Protection and 3rd International Conference on ICT for Sustainability (pp. 66-73). Paris: Atlantis Press. http://dx.doi.org/10.2991/ ict4s-env-15.2015.8.
Hannisdahl, O. H., Malvik, H. V., & Guro, B. (2013). The future is electric! The EV revolution in Norway — explanations and lessons learned. Proceedings of The Electric Vehicle Symposium and Exhibition – EVS27 (pp. 1-13). Barcelona: IEEE. http://dx.doi.org/10.1109/EVS.2013.6914921. Harris, H. (2001). Content analysis of secondary data: a study of courage in managerial decision making. Journal of Business Ethics, 34(3), 191-208. http://dx.doi. org/10.1023/A:1012534014727.
Holtsmark, B., & Skonhoft, A. (2014). The Norwegian support and subsidy policy of electric cars. Should it be adopted by other countries? Environmental Science & Policy, 42, 160-168. http://dx.doi.org/10.1016/j.envsci.2014.06.006. Huo, H., He, K., Wang, M., & Yao, Z. (2012). Vehicle technologies, fuel-economy policies, and fuel-consumption rates of Chinese vehicles. Energy Policy, 43, 30-36. http:// dx.doi.org/10.1016/j.enpol.2011.09.064.
Huo, H., Zhang, Q., He, K., Yao, Z., Wang, X., Zheng, B., Streets, D. G., Wang, Q., & Ding, Y. (2011). Modeling vehicle emissions in different types of Chinese cities: importance of vehicle fleet and local features. Environmental Pollution, 159(10), 2954-2960. http://dx.doi.org/10.1016/j.envpol.2011.04.025. PMid:21601969.
Instituto Brasileiro de Geografia e Estatística – IBGE. (2015a). Produto Interno Bruto dos municípios. Rio de Janeiro: IBGE. Retrieved in 2015, July 12, from http://www.ibge. gov.br/home/estatistica/pesquisas/pesquisa_resultados. php?id_pesquisa=46
Instituto Brasileiro de Geografia e Estatística – IBGE. (2015b). Sinopse do censo demográfico 2010. Rio de Janeiro: IBGE. Retrieved in 2015, May 13, from http://www.ibge. gov.br/home/estatistica/populacao/censo2010/sinopse/ sinopse_tab_rm_zip.shtm
Instituto Brasileiro de Geografia e Estatística – IBGE. Ministério do Planejamento. (2010). Produto Interno Bruto dos Municípios. 2010. Rio de Janeiro: IBGE. 105 p. Retrieved in 2015, May 14, from http://biblioteca.ibge. gov.br/visualizacao/livros/liv62930.pdf
International Council on Clean Transportation. (2015). Conventional pollutant emission limits. DieselNet. Retrieved in 2015, May 17, from http://transportpolicy.net/index. php?title=China:_Heavy-duty:_Emissions
International Energy Agency – IEA. (2008). World energy outlook. Paris: IEA. Retrieved in 2015, March 11, from
https://www.iea.org/media/weowebsite/2008-1994/ WEO2008.pdf
International Energy Agency – IEA. (2015). Hybrid and electric vehicles: the electric drive plug in. Illinois: IEAHEV. Retrieved in 2015, March 11, from http://www.ieahev. org/assets/1/7/Report2015_WEB.pdf
Lohry, G., Yiu, A., & Lu, Y. (2014). China’s emission standard policy and its unprecedented car-scrapping program. Beijing: Government of China.
Macedo, F. C., & Angelis, Â. (2013). Guerra fiscal dos portos e desenvolvimento regional no Brasil. Redes (Bernal), 18(1), 185-212.
Ministério do Meio Ambiente. (2015). Programa de controle de poluição do ar por veículos automotores – PROCONVE. Programa de controle da poluição do ar por motociclos e veículos similares – PROMOT. Brasília: MMA. Retrieved in 2015, August 07, from http://www.mma.gov.br/ estruturas/163/_arquivos/promot_163.pdf
Newgeography. (2015). China: urbanizing and moving east: 2010 census. Retrieved in 2015, June 11, from http://www. newgeography.com/content/002218-china-urbanizing-and-moving-east-2010-census
São Paulo. Secretaria Municipal do Verde e do Meio Ambiente. (2013). Inventário de emissões e remoções antrópicas de gases de efeito estufa do Município de São Paulo de 2003 a 2009, com atualização para 2010 e 2011 nos setores Energia e Resíduos. São Paulo: Associação Nacional de Transportes Públicos. Retrieved in 2015, August 03, from http://issuu. com/svmasp/docs/sum__rio_executivo_invent__rio_gee_ São Paulo. Governo do Estado. (2014a). Balanço energético do Estado de São Paulo. São Paulo: Secretaria de Energia. Retrieved in 2015, April 23, from http://www.energia. sp.gov.br/a2sitebox/arquivos/documentos/724.pdf São Paulo. Prefeitura Munipal. (2014b). Lei Nº 15.997-política municipal de incentivo ao uso de carros elétricos ou movidos a hidrogênio. São Paulo: Secretaria de Documentação. Retrieved in 2015, April 10, from http://camaramunicipalsp. qaplaweb.com.br/iah/fulltext/leis/L15997.pdf
São Paulo. Governo do Estado. Secretaria do Meio Ambiente. (2014c). Emissões veiculares no Estado de São Paulo. São Paulo: Cetesb. Retrieved in 2015, June 12, from http:// veicular.cetesb.sp.gov.br/relatorios-e-publicacoes São Paulo. Prefeitura Municipal. (2015a). Lei N. 12.490 - de 3 de outubro de 1997. Retrieved in 2015, April 15, from
http://www3.prefeitura.sp.gov.br/cadlem/secretarias/ negocios_juridicos/cadlem/integra.asp?alt=04101997L 124900000
São Paulo. Prefeitura Municipal. (2015b). Secretaria do Verde e do Meio Ambiente. Retrieved in 2015, April 21, from http://www.prefeitura.sp.gov.br/cidade/secretarias/ meio_ambiente/organizacao/index.php?p=3246
Sierzchula, W., Bakker, S., Maat, K., & van Wee, B. (2014). The influence of financial incentives and other socio-economic factors on electric vehicle adoption. Energy Policy, 68, 183-194. http://dx.doi.org/10.1016/j.enpol.2014.01.043. Song, M., Wu, N., & Wu, K. (2014). Energy consumption and energy efficiency of the transportation sector in Shanghai. Sustainability, 6(2), 702-717. http://dx.doi.org/10.3390/ su6020702.
Sperling, D., & Gordon, D. (2010). Two billion cars: driving toward sustainability. Oxford: Oxford University Press. The World Bank Group. (2014). Transport for health: the global burden of disease from motorized road transport. Washington: The World Bank. Retrieved in 2017, March 15, from https://openknowledge.worldbank.org/bitstream/ handle/10986/17613/863040IHME0T4H0ORLD0BANK 0compressed.pdf?sequence=1
The World Bank Group. (2015). GDP growth (annual %). Washington: The World Bank. Retrieved in 2017, March 15, from http://data.worldbank.org/indicator/NY.GDP. MKTP.KD.ZG
Torres, H. G. (2012). Afinal, a desconcentração produtiva é ou não relevante? A cidade de São Paulo no olho do furacão. Novos Estudos CEBRAP, 11(94), 69-88. http:// dx.doi.org/10.1590/S0101-33002012000300003. Treanton, K., Ibitoye, F., Kainou, K., Olivier, J. G. J., Pretel, J., Simmons, T., & Yang, H. (2006). Reference approach. In
S. Eggleston, L. Buendia, K. Miwa, T. Ngara, & K. Tanabe (Eds.), Guidelines for national greenhouse gas inventories. Kanagawa: Intergovernmental Panel on Climate Change – IPCC. chap. 6. pp. 5-6.
The United Nations Environment Programme - UNEP. (2015). Cities and climate change. Nairobi: UNEP. Retrieved in 2015, May 17, from http://www.unep.org/resourceefficiency/Policy/ ResourceEfficientCities/FocusAreas/CitiesandClimateChange/ tabid/101665/Default.aspx
Vergis, S., Turrentine, T. S., Fulton, L., & Fulton, E. (2014). Plug-in electric vehicles: a case study of seven markets. Davis: Institute of Transportation Studies, University of California. Vormittag, E.M.P.A., Rodrigues, C. G., Miranda, M. J. (2013). Avaliação do impacto da poluição atmosférica no Estado de São Paulo sob a visão da saúde. Retrieved in 2015, May 12, from http://www.saudeesustentabilidade.org.br/site/ wp-content/uploads/2013/09/Documentofinaldapesqui sapadrao_2409-FINAL-sitev1.pdf
Wang, H., Fu, L., Zhou, Y., Du, X., & Ge, W. (2010). Trends in vehicular emissions in China’s mega cities from 1995 to 2005. Environmental Pollution, 158(2), 394-400. http:// dx.doi.org/10.1016/j.envpol.2009.09.002. PMid:19775789. Yang, C.-J. (2010). Launching strategy for electric vehicles: Lessons from China and Taiwan. Technological Forecasting and Social Change, 77(5), 831-834. http://dx.doi.org/10.1016/j. techfore.2010.01.010.
Zamboni, A., Tsai, D. S., Pires, E. C., & Cremer, M. S. (2015). Análise preliminar sobre a implantação do padrão Euro VI no Brasil. Retrieved in 2015, May 02, from http://www. energiaeambiente.org.br
Received: Oct. 18, 2017 Approved: Apr. 18, 2018