M
ASTER OF
S
CIENCE IN
FINANCE
M
ASTERS
F
INAL
W
ORK
PROJECT
EQUITY RESEARCH
:
ADIDAS
AG
EDUARDO
FIGUEIREDO
FARIA
DA
SILVA
M
ASTER OF
S
CIENCE IN
FINANCE
M
ASTERS
F
INAL
W
ORK
PROJECT
EQUITY RESEARCH
:
ADIDAS
AG
EDUARDO
FIGUEIREDO
FARIA
DA
SILVA
S
UPERVISOR
:
CARLOS
MANUEL
COSTA
BASTARDO
3
Abstract
This report is about a valuation of Adidas AG, elaborated in according with ISEG’s Finance
Master’s Final Work. This Equity Research follows the structure of a research report recommend
by the CFA Institute. The research note was prepared based on the information publicly disclosed
by Adidas AG with reference to December 31
st, 2018. Therefore, this report does not contemplate
any events that may have occurred after this date. To obtain the Target price of the company,
the method chosen was the Discounted Cash Flow (DCF) and the Relative Valuation through the
multiples of peer companies. The price target reached was 284.61€. This valuation results in a
Hold recommendation. It is considered of medium risk since, despite Adidas being one of the two
big companies in this industry, the deceleration of the economy appears as a potential risk.
JEL classification: G10 ; G32; G34
Keywords: Equity Research; Valuation; Adidas; Reebok; DCF; Multiples; Apparel; Footwear;
Hardware;
4
Resumo
Este relatório centra-se na avaliação da Adidas AG, que foi elaborado de acordo com o Trabalho
Final de Mestrado do Master in Finance. Este Equity Research segue a estrutura de um reporte
de research recomendado pelo CFA Institute. Esta nota de research foi preparada com base na
informação pública disponibilizada pela Adidas com referência a 31 de Dezembro de 2018.
Assim, este reporte não comtempla eventos que possam ter ocorrido após essa data. Para
chegar ao preço alvo para a empresa, o método escolhido foi o Discounted Cash Flow e a
Avaliação Relativa, através de múltiplos de empresas concorrentes. O Price target obtido foi de
284.61€. Esta avaliação resulta numa recomendação de Manter. É considerada de risco médio
uma vez que apesar da Adidas ser uma das duas grandes empresas desta indústria, o
desaceleramento da economia surge como um potencial risco.
Classificação JEL: G10 ; G32; G34
Palavras-Chave: Equity Research; Avaliação de Empresas; Adidas; Reebok; DCF; Múltiplos;
Apparel; Footwear; Hardware.
5
Acknowledgements
This project represents the culmination of one of the most important stages of my life.
First of all, to God, for being the One who sustains me each time and through His mercy and
grace enable me to complete this stage.
To my beloved parents, João Paulo Martins Faria da Silva and Olga Maria Mendes Figueiredo.
They are the ones responsible for having come this far, through all their sacrifices so that they
can give me everything I needed to make this outcome a reality. To my brother Rúben Silva and
my aunt Edite Figueiredo for every word of discernment and wisdom.
To my girlfriend, Rita Rodrigues, who was always at my side with her patience and
encouragement in times when her strength and will were lacking. "Love bears all things, believes
all things, hopes all things, endures all things.".
Finally, but with an enormous importance to have arrived here, to my supervisor, Professor Carlos
Bastardo. Throughout this time he was always present, open to questions and advice and always
tried to motivate me to reach the finish line.
6
Index
List of Appendix... 7
List of Figures ... 8
List of Tables ... 9
Glossary... 10
INVESTMENT SUMMARY... 11
COMPANY DESCRIPTION ... 12
BUSINESS OVERVIEW... 13
HISTORICAL FINANCIAL ANALYSIS ... 13
CORPORATE GOVERNANCE ... 15
INDUSTRY OVERVIEW ... 16
Key Drivers of Industry Profitability... 17
SWOT Analysis... 17
5 Porter’s Forces... 18
PEER COMPANIES ... 19
VALUATION... 20
INVESTMENT RISKS... 22
SCENARIO ANALYSIS ... 23
Appendix ... 24
Appendix 1 - Balance Sheet ... 24
Appendix 2 - Income Statement... 25
Appendix 3 – Cash Flow Statement ... 26
Appendix 4 – Financial Ratios ... 27
Appendix 5 – Common-size Balance Sheet ... 28
Appendix 6 – Common-size Income Statement... 29
Appendix 7 – DCF Assumptions ... 30
Appendix 8 – Discounted Cash Flow... 31
Appendix 8 – Discounted Cash Flow... 32
Appendix 9 – Relative Valuation ... 33
Appendix 10 – Risk Matrix ... 34
Appendix 11 – Adidas Global Headquarters ... 35
Appendix 12 – Monte Carlo Simulation ... 36
References ... 37
7
List of Appendix
Appendix ... 24
Appendix 1 - Balance Sheet ... 24
Appendix 2 - Income Statement... 25
Appendix 3 – Cash Flow Statement ... 26
Appendix 4 – Financial Ratios ... 27
Appendix 5 – Common-size Balance Sheet ... 28
Appendix 6 – Common-size Income Statement... 29
Appendix 7 – DCF Assumptions ... 30
Appendix 8 – Discounted Cash Flow... 31
Appendix 8 – Discounted Cash Flow... 32
Appendix 9 – Relative Valuation ... 33
Appendix 10 – Risk Matrix ... 34
Appendix 11 – Adidas Global Headquarters ... 35
8
List of Figures
Fig. 1 Potencial Upside... 11
Fig. 2 Revenue Growth... 11
Fig. 3 Margins Outlook ... 11
Fig. 4 Adidas Employees... 12
Fig. 5 Adidas... 12
Fig. 6 Reebok... 12
Fig. 7 Company Strategy ... 12
Fig. 8 Net sales € in millions ... 12
Fig. 9 Net sales by brand ... 13
Fig. 10 Net sales by segment ... 13
Fig. 11 Net sales by product category ... 13
Fig. 12 EBITDA € in millions ... 14
Fig. 13 Net income from continuing operations € in millions ... 14
Fig. 14 Equity ratio in %... 14
Fig. 15 Capital expenditure by type in % of total CAPEX ... 14
Fig. 16 5Y Share Performance... 14
Fig. 17 Basic earnings per share in € ... 15
Fig. 18 Shareholder structure by investor group ... 15
Fig. 19 Regional GDP development in % ... 16
Fig. 20 Sportswear Revenue Worldwide (Us dollars) ... 17
Fig. 21 5 Porter’s Forces ... 18
Fig. 22 Nike ... 19
Fig. 23 Puma ... 19
Fig. 24 Skechers... 19
Fig. 25 Under Armour ... 19
Fig. 26 Earnings per Share ... 20
Fig. 27 Depreciation & Amortization ... 20
Fig. 28 Risk Matrix ... 22
9
List of Tables
Tab. 1 Analyst Risk Assesement ... 11
Tab. 2 Market Profile ... 11
Tab. 3 ADS Price Target... 11
Tab. 4 Net sales by segment ... 13
Tab. 5 Dividend Policy... 15
Tab. 6 Performance of the Adidas AG share and important indices at year-end 2018 in % ... 15
Tab. 7 Executive Board ... 15
Tab. 8 Executive Board ... 16
Tab. 9 WACC Assumptions ... 21
Tab. 10 P/E Ratio – Peer Companies ... 21
Tab. 11 Multiples Price Target ... 21
10
Glossary
CAGR - Compound annual growth rate. CapEx- Capital Expenditures
CAPM - Capital Asset Pricing Model CEO - Chief Executive Officer
D&A - Depreciation and Amortization DCF - Discounted Cash Flow
EBITDA - Earnings Before Interest Taxes Depreciation and Amortization EPS – Earnings per Share
EV - Enterprise Value
GDP - Gross Domestic Product P/E - Price Earnings Ratio ROA – Return on Assets ROE – Return on Equity
WACC - Weighted Average Cost of Capital YE - Year End
11
“Through sport we have the power to change lives”
INVESTMENT SUMMARY
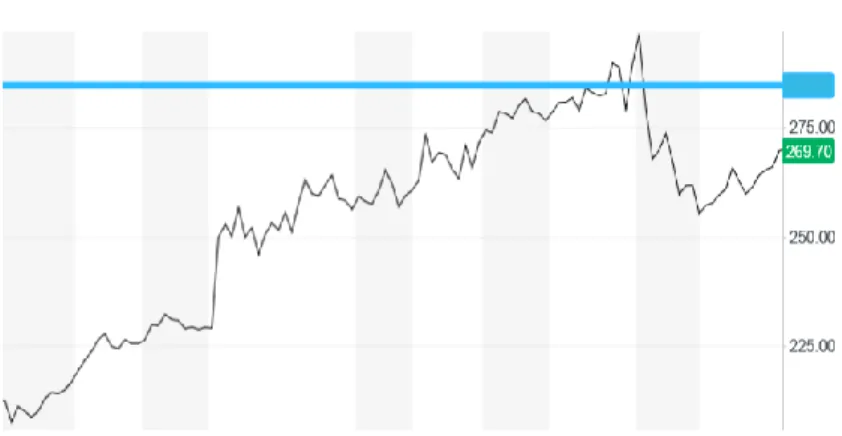
I issue a HOLD recommendation with a YE19 target price of 284.61€. This target price is the result of a careful valuation
and represents a potential upside of 5.53% in comparison to the current price of 269.70€.
Revenue Growth: Adidas has traditionally maintained a pronounced growth trend in its sales. 2019 YE represents an
important stage in sales growth in markets such as North
America and Asia-Pacific. As a result, a CAGR of 4.43% is expected in the following years.
Positive outlook of Adidas' Margins: In 2019, improvement s
in the company's margins are expected. First of all, the growt h of gross margin to 53.5% which is largely the main factor for an increase of 30% in operating margin to 13.30%.
Valuation: Through the DCF method, we achieved a YE19 price
target for Adidas. The target price of 284.61€ represents an increase of 5.53%. A Terminal Growth Rate of 2.0% and a WACC of 4.363% contributed to reach this YE19 Price target.
ADIDAS AG
HOLD
Medium Risk
14 October 2019
Fig. 1 Potencial Upside
Source: Yahoo Finance
Tab. 1 Analyst Risk Assesement
Source: Bloomberg Tab. 2 Market Profile
Source: Bloomberg Fig. 2 Revenue Grow th
Source: Own estimations
Tab. 3 ADS Price Target
Source: Own estimations Fig. 3 Margins Outlook
12
COMPANY DESCRIPTION
Adidas AG is a German company and was founded by Adolf Dassler, in 1949. Adidas has its headquarters in Herzogenaurach. The company is one of the largest players in the footwear industry.Adidas AG is known by the signature of the "three parallel bars". Recognized worldwide, it is present in Western Europe, North America, Russia/CIS, Asia-Pacific, Latin America and Emerging Markets.
In 1987, until then in control of the Dassler family, the company was sold. However, the change of management and the adoption of dubious decisions resulted in the worst results in the company's history. This poor performance led the company into a pre-bankruptcy situation.
The change of paradigm happens when Robert Louis-Dreyfus is appointed as the new CEO of the group. Three years later, the company decides to go public. This new stage comes with a slogan that goes down in history, "We knew then, we know now". Aiming to consolidate itself as one of the major companies in this industry, driven by the positive evolution of financial results, the strategy is to acquire competitive companies. The new policy begins with the acquisition of the Salomon Group, in a US$1.4 billion deal, which resulted in the creation of the second largest group in this industry.
In 2005, in a favourable situation the company decides to sell the company Salomon, for in the following year acquire its rival Reebok, in a deal valued at US$3.8billion. After this deal, Adidas' revenues at the end of 2006 grew 52%, becoming a historic milestone.
Over the years, Adidas has invested in sponsoring different renowned athletes and teams from different sports such as David Beckham, Lionel Messi, Manchester United, Real Madrid and Derrick Rose. Through them were carried out different marketing campaigns that went down in history.
Fig. 8 Net sales € in millions
Source: Company Data Fig. 7 Company Strategy
Source: Company Data
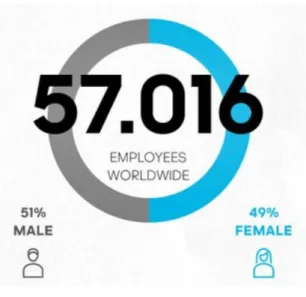
Fig. 4 Adidas Employees
Source: Company Data
Fig. 5 Adidas
Source: Company Data Fig. 6 Reebok
13
BUSINESS OVERVIEW
Adidas AG discriminates its business by brands, geographic al regions, product category and distribution channel.In figure 9, it is possible to see Adidas as the primary source of revenues with 19.851bn€ and 91% of total revenues. Reebok has 8%, with 1.687bn€ in Revenues. In a currency-neutral revenues basis, Adidas brand increase 9% and Reebok brand decrease 3%.
As mention before, this is a worldwide company. Asia-Pacific is responsible for 33% of total revenues, with 7.141m€. The increasing weight of this market is sustained by an increase
of 12% of its revenues. Europe and North America follows with
27% and 21% of total revenues respectively. In 2018,
Asia-Pacific and North America were the only with positive
evolutions. Europe, Russia/CIS, Latin America and Emerging
Markets registered negative changes in terms of revenues .
In a currency-neutral scenario, excluding Emerging Markets (-3%), all the others segments accounted positive changes on revenues.
Adidas AG separates its products by apparel, footwear and
hardware. In 2018 footwear and apparel products revenues
increased due to the Sport Inspired and Sport Performanc e. In other hand, hardware products were down by 9% in a currency neutral scenario. In figure 11 is represented the sales by product category. Footwear with 58% continues being the most relevant category of products.
Adidas has the majority of its production outsourced to more than 55 countries, mainly in the Asian region. Vietnam has the largest weight, followed by Indonesia and China.
HISTORICAL FINANCIAL
ANALYSIS
Over the last 5 years Adidas improved its revenue from 14,534€b
up to 21,915€b, which represents a growth of 50,78%. The growth in revenue is explained mostly by the strong
performance of North America and Asia-Pacific segments in particular, recording above double digit growth.
The gross margin has been increasing year on year. In the last period, the 1.4% increase was achieved mainly through better prices, channel and product, as well as lower input costs.
EBITDA increase around 14.77%, largely due to the increase in PPE. In terms of operating profit there was also an increase of 14%. Regardless of the increase in operating expenses, the increase in the gross margin allowed the operating margin to grow by 1.1%. The Net income from continuous operations
had also registered an increase of 19.51%, the Earnings per share also registered an increase of 20%.
Fig. 9 Net sales by brand
Source: Company Data
Source: Company Data
Source: Company Data Fig. 10 Net sales by segment
Fig. 11 Net sales by product category
Tab. 4 Net sales by segment
14
Average operating working capital dropped by 1.4%, maintaining its downward trend. Over the years the company has been characterized by the investment it has been making, which explains the increase in CapEx recorded in the different categories, such as continuing operations, PPE and intangible assets.
In terms of liquidity metrics, we can measure an increase of almost 100% when compared to last year. This is largely
explained by the increase in net cash from operating activities, however it was outweighed by the cash invested in the acquisition of fixed assets, the repurchase of shares and the payment of dividends to shareholders.
A particularly attractive aspect is the capital structure in this company. Although the equity ratio has decreased, it remains above 40%, being counterbalanced by the increase in the balance sheet. This metric also shows your low appetite for increasing your debt level.
The main financial indicators of Adidas show the robustness and strength of the company. On the one hand, the rise in revenues as well as in Gross Margin, which have allowed a very positive operational performance. And on the other hand, the dividend police is very attractive to shareholders, with an increase in the dividend paid while remaining relatively constant in its Dividend Payout Ratio.
STOCKS INFORMATION
Company shares are listed on various stock exchanges and indexes in the world: DAX-30 Index in Germany, EURO S TOXX 50 and MSCI World Textiles, Apparel & Luxury Goods Index, which also includes its main competitors.
STOCKS PERFORMANCE
Over the past 3 years ADG's market performance has been remarkable, which lead to the market capitalization reached €51.98bn. As long as the main indices like DAX 30 and EURO STOXX 50 recorded performances of 9.15% and 9.48% respectively, its performance is even more evident as it recorded a return of 67.10%. When compared to its main competitor NIKE (45.23%), its superiority is even more evident.
Fig. 12 EBITDA € in millions
Source: Company Data
Fig. 13 Net income from continuing operations € in millions
Source: Company Data Fig. 14 Equity ratio in %
Source: Company Data
Fig. 15 Capital expenditure by type in % of total CAPEX
Source: Company Data
Source: Company Data Fig. 16 5Y Share Performance
15
SHAREHOLDER STRUCTURE
In respect of Adidas’ Shareholder Structure, the shares are split among different types of investors. Institutional investors have 92% of total shares, followed by the private investors and undisclosed holdings (7%). Finally, the company holds 1% of the shares as Treasury Shares. This smallest percentage is due to the Buyback Shares Program that is ongoing by the company. Regarding the distribution of investors per geographic region, the North American (41%) market appear as the primary, followed by United Kingdom (21%) and Germany (10%).
DIVIDEND POLICY
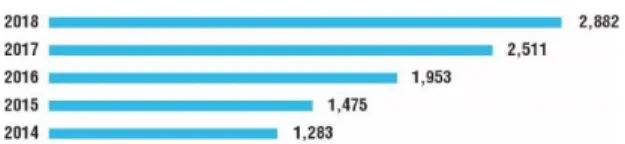
In the last few years the company has significantly increased its dividends per share, accounting an increase of 29% compared with the previous year (2017), settling a dividend of 3.35€ per share. This increase is the consequence of the excellent operational performance during the year 2018, and a clear sign that the company has a robust and healthy financial position.
CORPORATE
GOVERNANCE
Adidas AG, as well as all public corporations based in Germany, is subject to the regulations established by the German Stock Corporation Law. This law requires the existence of two distinct
boards, which although independent from each other, a cooperative relationship allows the company to achieve the
consistency and stability that shareholders strongly appreciate. On the one hand, the Executive Board, which is directly responsible for the entire operation and management of the company. On the other hand, the Supervision Board is in charge of supervising and advising on the main issues of the company. The Executive Board is made up by six members. It is in this board that the most important management decisions are made,
namely in establishing the company's strategy, the targets to be achieved in its operations as well as its risk mitigation and
compliance policies.
Fig. 17 Basic earnings per share in €
Source: Company Data
2018 2017 2016 2015 2014
Dividend Payout Ratio % 39.00 37.00 37.40 44.50 47.20
Dividend/share (€) 3.35 2.60 2.00 1.60 1.50
# shares outstanding 199.17 203.86 201.49 200.2 204.33
Total dividends paid (m€) 667 530 403 320 306
Tab. 5 Dividend Policy
Source: Company Data
Fig. 18 Shareholder structure by investor group
Source: Company Data
Tab. 6 Performance of the Adidas AG share and important indices at year-end 2018 in %
Source: Company Data
Tab. 7 Executive Board
16
In order to be in line with the German Co-Determination Act, the Supervision Board is formed by 16 members, who are divided equally between shareholder representatives and employee representatives, who are elected at the Shareholders' General Meeting and by employees respectively.
As the Supervisor Board is responsible for supervision, it has the
duty to review and approve the group's financial statements, as well as the management team's proposals regarding the
earnings to be distributed by the company.
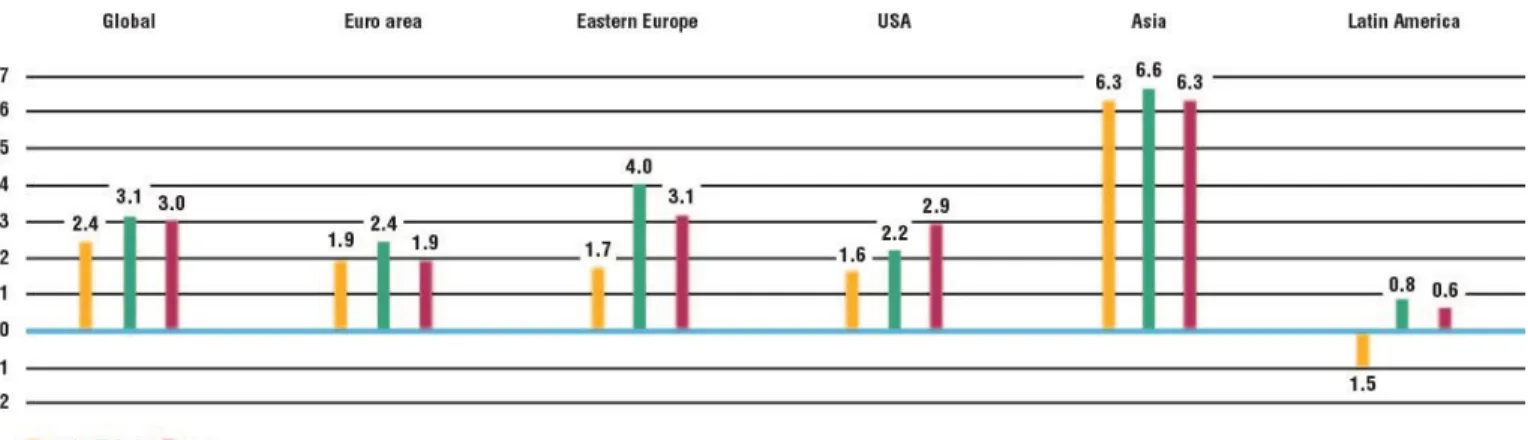
INDUSTRY OVERVIEW
The World real GDP has been increasing since 2016, from 3.1% to 3.66% annual growth rate in 2018. Employment rate has always been increasing from 2013 to 2018, in European Union and United States. In 2017, 60.1% of people from United States and 70.2% from European Union were employed.The raise of GDP and the increase in the employment rate have a positive influence in the environment, it can reflect an increase in the purchasing power of families which leads to a higher demand for footwear products, and consequently, will increase the supply and generate more revenues for the companies of the industry.
Adidas is part of the Sporting Goods Industry, which recorded a solid growth in 2018. Globally, China once again outgrew the global industry, North America returned to growth and Europe maintained its constant growth.
The sharp growth of this industry is explained by different reasons and trends. There is a high sensitivity on the part of the world population towards the importance of having a healthy lifestyle. The adoption of healthy practices and consequently a better quality-of-life. Another reason for this growth is the attention given by the authorities to the issue of a healthy lifestyle. Different strategies are followed in order to educate younger generations to adopt a healthy lifestyle.
Fig. 19 Regional GDP development in %
Source: Company Data
Tab. 8 Executive Board
17
Sporting Goods Industry is also constantly in evolution due to digital progress. A dynamic strength in social networks for Social Fitness and the growth of e-commerce are evidence of the growing technological evolution in this industry.
This industry faces a number of challenges, such as the environmental impact of production, sportswear companies have been pressured to change their production methods, since the use of materials that are very harmful to the environment and cannot be recycled. Supply chain visibility, as the channels to generate revenue increase, so does the complexity of the supply chain. Tracking inventory and creating efficiencies can be key differentiators in the footwear sector. Limited fulfilment capabilities, the technology and process of heritage systems and
operations are quickly becoming ineffective. Upgrades to warehouse management systems, inventory controls and the
development, or optimization, of an e-commerce platform are essential.
Key Drivers of Industry Profitability
MAIN REVENUE DRIVER
Brand Power: The biggest companies such as Nike and Adidas
will always have advantage over the other brands, since they are
well established in the industry and the increasing number of stores helps them boosting their revenues.
Innovation: In a sector like Footwear, trend is an important
factor, so you cannot always make the same product over and over. Therefore, creating new products and pushing through the “status-quo” will attract new customers and thus increase revenues.
MAIN COST DRIVER
Marketing: To convince athletes/teams to sign contracts and
to make ads, footwear companies spend a lot of money. For example, Real Madrid signed a contract of €100M/ year during 10 years with Adidas.
SWOT Analysis
Strength:
- The diversification of its products on apparel, footwear and hardware.
- Adidas’ legacy and heritage.
- The supply chain is very strong and efficient.
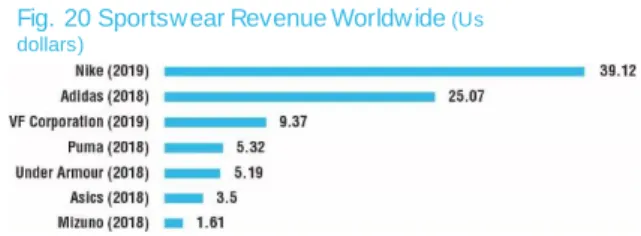
Fig. 20 Sportsw ear Revenue Worldw ide (Us dollars)
18
Weakness:
- The products to sell have a large range of prices.
- Adidas have its production outsourced on Asia, being a factor of instability.
- Slightly increase of Revenues in traditional markets like Europe.
Opportunities:
- Increase market share in Emerging Markets, China and North America.
- People are becoming more conscious about their lives, adopting healthy lifestyles.
Threats:
- In footwear industry the competition is very high due to the presence of a lot of firms operating in the same markets, becoming potential chooses to the costumers.
- Fraud products are becoming a several threat to company’s revenues.
- Supplier dominance.
5 Porter’s Forces
Bargaining Power of Buyers: High. In a Footwear industry,
the quantity of suppliers is very low compared with the number of buyers, leading to low switching costs from one sneaky brand to another. Product differentiation is also relevant since in the market there are thousands of shoes. Nowadays, customers can access a lot of information about the different characteristics of the shoes and to find out where is cheaper to buy the desired product. Finally, the brand identity is a reason why customers may or may not choose to overpay because of the brand name.
Competitive Rivalry: High. Adidas operates in a segment
composed by a large number of firms, even being one of the biggest companies, all of its competitors are present worldwide. To increase their market share the firms are focusing their strategies in increase the range of products. Design and looks over price. Brand identity and customer loyalty is a strong factor to be successful on this industry. Marketing and Advertising campaigns are also very important to reach the contact with the clients.
Bargaining Power of Suppliers: Low. Adidas holds a large
number of suppliers. Some of them are very small, which represents a weakness for them since they are not able to make the rules or exercise any pressure in big companies like Adidas. Footwear companies have the possibility to switch to new suppliers easier.
Barriers to entry: High. In footwear industry, a new joiner will
have to face the heritage from the famous brands. To compete with companies like Adidas, a new brand has to made high
investments in whole of its business, from production to distribution.
Source: Company Data Fig. 21 5 Porter’s Forces
19
Threats of Substitutes: Moderate. For the costumers,
the switching costs for choosing a brand over another are very low. Buyer inclination to substitute may be a different type of design/sneaker type the client is looking for. The quality and performance of the product is also very relevant, since not all sneakers perform in the same way, specifically the athletic ones.
PEER COMPANIES
In order to choose the peer companies group, the criteria applied was: market capitalization of over $1B, Footwear as the primary source of revenues, publicly traded and headquarters and stronger markets in USA and Europe. The restricted group obtained was composed by Nike, Puma, Under Armour and Skechers.
With our peer companies well defined, there are some common practices in the strategies of this industry. Endorsements , Advertising, Distribution, Product and Environment are examples of its identical path.
NIKE INC
Nike Inc is faced as the most valuable brand among this industry. This American company is engaged in a strategy based on Product, Digital, Manufacturing & Engineering, Marketing and Communication, Supply Chain and Technology. In 2018, Nike’s revenues increased 6% to $36.4 billion.
PUMA SE
Puma SE is an important player in the sporting goods industry. This is a German company that designs, manufactures and sells
footwear, apparel and accessories. Over the last years, they have executed a strategy with five priorities: Brand Heat, Product, Women’s, Distribution and Organization. They are experiencing a good moment, with their sales reaching €4.6B in 2018 and a growth in EBITDA from €154 million in 2015 to €419 million in 2018.
SKECHERS
Skechers designs and manufactures lifestyle footwear. In 2018, the company’s revenues reached $4.6B, with a Global Retail Growth of 8%. This American corporation accounted an increase of 50% on its operational income.
UNDER ARMOUR
This American Company manufactures footwear and apparel and was founded in 1996. The company’s strategy focuses on to become more than just a brand, making great products but reducing unnecessary costs. The revenues increase from $4.833B to $5.193B over the period from 2016 to 2018.
Source: Company Data Data
Fig. 22 Nike
Source: Company Data Data
Fig. 23 Puma
Source: Company Data Data
Fig. 24 Skechers
Source: Company Data Data
20
VALUATION
First of all, it is important to mention the methods chosen to value Adidas AG were the Discounted Cash Flow (DCF), which consists of obtaining the Enterprise's Value based on the projections of its financial statements. The second approac h used was Relative Valuation, which consists of evaluating the company on the basis of a comparison of key indicators from peer companies.
DCF
This is considered to be the most appropriate method to estimate the value of a company, taking into account the information available. To define the assumptions, the intention was to maintain the current situation as much as possible, so that the valuation would be meaningful.
Revenues: Following the same method as the company, the
total value of revenues was obtained by estimating the evolution of the revenues in the different 7 markets in which it operates. Nevertheless, for a better understanding, it is necessary to understand that Adidas has been recording double-digit increases in revenues on a currency neutral basis.However, due to a slowdown in the world economy, I strongly believe that the company's sales evolution will slow down, expecting revenues to grow 5.10% in 2019 and 4.43% in the future.
North America, China and Emerging Markets continue to be the key segments that allow the company to record remarkable growth. In these 3 segments is expected a growth of 12%, 12% and 10% respectively. In the remaining segments the outlook for the future is not particularly bright, with Latin America and Europe recording a decrease in their revenues of 8% and 0.5%.
The remaining assumptions used, with the exception of Shareholder Equity, were derived as a percentage of sales.
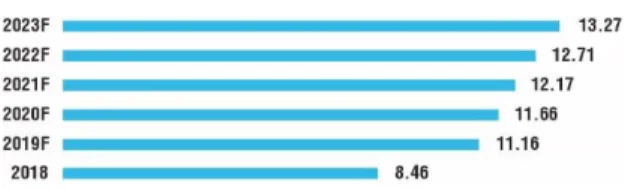
Terminal Growth Rate: To determine the Terminal growth rate,
we have to consider the fact that Adidas is a company with its operation spread all over the world, which forces us to take into account the overall evolution of the economy. As Adidas is a German company, and the German GDP growth rate for 2023F is expected to be 1.3%. Since more than a third of its revenues will be from Asia-Pacific segment is important to take in consideration the GDP growth rate in that region, in the case 5.2%. Based on this information, the Terminal Growth rate chosen was 2.0% to obtain the Terminal Value. This small value is also an indicator of the adoption of a conservative perspective.
CapEx + D&A + Net Working Capital: Over the past few years
the relationship between CapEx and Sales has been constant. In order to keep this relationship present, CapEx will account for 3.2% of Sales. Another relationship that has been constant is D&A and PPE, on average D&A is 22% of PPE. In order to explore this topic and take into consideration the historical distributions of CAPEX and D&A, they will be replicated in the period of Valuation.
Source: Own estimations Data
Fig. 26 Earnings per Share
Source: Own estimations Data
21
Net Working Capital is the difference between all assets and all liabilities included in the company's operation. Throughout the Valuation period, Net Working Capital is always positive, which indicates that the current assets are higher than the company's liabilities.
WACC Assumptions: The method chosen to determine the
discount rate to be used to discount the Cash Flows was WACC. Since Adidas' capital structure is both debt and equity, it is necessary to calculate the cost of each individually.
Analyzing the available financial information about the company's debt, I found that the average cost of debt is 2.1%. Therefore, this was the figure I assumed for the entire period. The cost of equity was achieved using the Capital Asset Pricing Model (CAPM). To apply this model, it is necessary to determine the Risk Free Rate, the Levered Beta and the Equity Risk Premium. For the Risk Free Rate was used the current 10 Year German-Bond with a negative yield of 0.585%. Despite being negative, no significant changes are expected in the short/medium term. For that reason, during the valuation process the Risk Free Rate used was the same.
Based on Damodaran’s estimation for US companies, we obtained the values for the Levered Beta and Equity Risk Premium, which accounts 0.93 and 5.96% respectively.
Taking into account the weight of Debt and Equity in the company's capital structure and its costs, the WACC reached is 5.32%.
RELATIVE VALUATION
The relative valuation was performed based on multiples of selected peer companies. Selected them, the next step was to identify the key multiples. Therefore, the chosen to the analysis were P/E ratio, EV/Sales and EV/EBITDA.
P/E Ratio: By applying P/E ratio, the price target obtained is
199.21€. Compared with the price of DCF methodology, there is a very sharp discrepancy due to the Under Armour ratio which is null.
EV/Sales: For EV/Sales ratio, the price target reached was
175.02€. The value achieved is also not in accordance with price target from DCF calculations. This happens since the industry average ratio is much lower than that of Adidas.
EV/EBITDA: Using EV/EBITDA ratio, the target price reached is
359.50€. As the previous ones, this is not in consonance with the DCF target price.
The analysis of these ratios allows us to conclude that Adidas, along with Nike, is one step ahead of the rest. Assigning the same weight to these three ratios, we obtained the target price of 244.58€.
Source: Own estimations Data
Tab. 9 WACC Assumptions
Tab. 10 P/E Ratio – Peer Companies
Source: Own estimations Data
Tab. 11 Multiples Price Target
Source: Own estimations Data
22
INVESTMENT RISKS
In order to assess and determine the main industry risks it was created a risk matrix. The creation of the matrix was based on four main risk areas: Operational risk, Financial risk, Strategic Risk and Political/Legal risk.
OPERATIONAL RISKS
Business Partner Risks: The company establishes partnerships with various third parties, such as athletes, creative
partners, innovation partners, retail partners or suppliers of goods or services. Consequently, the company is exposed to a wide spectrum of business partner risks. Injuries to individual athletes or poor on-field performance on the part of sponsored teams or athletes could reduce their consumer appeal and eventually result in lower sales and diminished attractivenes s of our brands.
FINANCIAL RISKS
Exchange Risks: Currency risks for Adidas are a direct result
of multi-currency cash flows within the company, in particular the mismatch of the currencies required for sourcing the products versus the denominations of the sales.
STRATEGIC RISKS
Consumer demand Risks: Being a successful player in the
sporting goods industry depends on the ability to create new and innovative footwear and apparel products. In this respect, it is essential to anticipate and respond quickly to changes in consumer demand or consumer trends. Changes in consumer demand can be sudden and unexpected, particularly when it comes to the fashion-related part of the business. Thus, the failure to anticipate consumer demand, as well as the creation and supply of products that do not resonate with consumers, is a critical risk to the success of all brands.
Macroeconomic Risks: The growth of the sporting goods
industry depends of a large extent on consumer spending and consumer confidence. Economic slowdowns , disruptions in financial markets and socio-political factors such as military conflicts, changes of government, nationalization or expropriation, particularly in regions where Adidas is strongly involved, therefore, could have a negative impact on the company's business activities and on its performance in terms of top results and operating results.
Fig. 28 Risk Matrix
23
POLITICAL AND LEGAL
Legal Framework Risks: Numerous laws and regulations
regarding competition, trade, customs and taxes affect the Adidas Group’s business practices worldwide. Non-complianc e with regulations could lead to substantial financial losses and consequentially reputational damages.
Data Privacy Risks: As a worldwide company, Adidas is subject
to various laws and regulations concerning data protection and privacy. Non-compliance with regulations could lead to substantial financial losses and fines. For example, Non -compliance with EU- General Data Protection Regulation may result in fines up to 4% of net sales. In addition, this risk could result in reputational damages.
SCENARIO ANALYSIS
To execute the Monte Carlo Simulation, we used the Crystal Ball tool, with 100000 trials. The results showed a mean target price of 300.34€ and a median of 283.92€, under the range of the target price obtained by DCF. The results show a skewedness with an asymmetry of 1.94, which can be observed on the right tail, since it is longer. Moreover, the recorded Kurtosis value is 10.07, which is higher than the Kurtosis value of a normal distribution,3, something we can see in its fatter tails. The confidence interval is 95%.The simulation was based on two assumptions to which the target price is very sensitive. In this case, the Terminal Growt h Rate because represents the growth in the terminal period and the Long Term WACC, for being the rate used to discount the Cash Flows, also the Terminal Value.
Fig. 29 Monte Carlo Simulation
Source: Own estimations
Source: Own estimations Tab. 12 Target Price Sensitivity
24
Appendix
25
Appendix 2 - Income Statement
26
Appendix 3 – Cash Flow Statement
27
Appendix 4 – Financial Ratios
28
Appendix 5 – Common-size Balance Sheet
29
Appendix 6 – Common-size Income Statement
30
Appendix 7 – DCF Assumptions
31
Appendix 8 – Discounted Cash Flow
32
Appendix 8 – Discounted Cash Flow
33
Appendix 9 – Relative Valuation
34
Appendix 10 – Risk Matrix
35
Appendix 11 – Adidas Global Headquarters
36
Appendix 12 – Monte Carlo Simulation
37
References
Adidas AG Annual Financial Statement Reports from 2016 to 2018. Adidas AG Corporate Governance Report from 2016 to 2018 Bloomberg Database
Damodaran website. Disponível em: pages.stern.nyu.edu/~adamodar/
Felsted, Andrea, “At Least Adidas Nailed the Trend for Investors”. Disponível em
https://www.bloomberg.com/opinion/articles/2019-03-13/at-least-adidas-nailed-the-trend-for-investors. International Monetary Fund, Real GDP Growth. Disponível em
https://www.imf.org/external/datamapper/ NGDP_RPCH@WEO/FRA/DE U/USA/JP N?year=2023 Mourdoukoutas, Panos, “Adidas is beating Nik e on Wall Street”. Disponível em
https://www.forbes.com/sites/panosmourdouk outas/2019/04/13/adidas -is-beating-nike/ #4866dff1150d Statista, Sporting Goods Revenues.
Statista, Marketing Advertisement. Disponível em: https://www.statista.com/statistics/540836/adidas -marketing-spend/