Braz. J. of Develop.,Curitiba, v. 6, n. 10, p.80216-80235, oct. 2020. ISSN 2525-8761
Prediction of alkaline treatment effect on the slow pyrolysis of the Pachira
aquatica Aubl.fruit bark using artificial neural networks
Predição do efeito do tratamento alcalino na pirólise lenta da casca da fruta
Pachira aquatica Aubl. utilizando redes neurais artificiais
DOI:10.34117/bjdv6n10-444
Recebimento dos originais: 13/09/2020 Aceitação para publicação: 21/10/2020
Cesário Francisco das Virgens
Doutor em Química
Instituição: Universidade do Estado da Bahia
Endereço: Universidade do Estado da Bahia - UNEB, Departamento de Ciências Exatas e da Terra – DCET I, Rua Silveira Martins, 2555, Salvador, Bahia, CEP: 41150-000
E-mail: cvirgens@uneb.br
Lucas Lima Carneiro
Graduado em Engenharia Elétrica
Instituição: Universidade Estadual de Santa Cruz
Endereço: Universidade Estadual de Santa Cruz, Departamento de Ciências Exatas e Tecnológicas, Rod. Jorge Amado, Km 16, bairro Salobrinho, Ilhéus, Bahia, Brazil. CEP:
45662-900
E-mail: llcl2.llc@gmail.com
Erik Galvão Paranhos da Silva
Doutor em Química
Instituição: Universidade Estadual de Santa Cruz
Endereço: Universidade Estadual de Santa Cruz, Departamento de Ciências Exatas e Tecnológicas, Rod. Jorge Amado, Km 16, bairro Salobrinho, Ilhéus, Bahia, Brazil. CEP:
45662-900
E-mail: erikgps@gmail.com
Thiago Pereira das Chagas
Doutor em Engenharia Eletrônica e Computação Instituição: Universidade Estadual de Santa Cruz
Endereço: Universidade Estadual de Santa Cruz, Departamento de Ciências Exatas e Tecnológicas, Rod. Jorge Amado, Km 16, bairro Salobrinho, Ilhéus, Bahia, Brazil. CEP:
45662-900
Braz. J. of Develop.,Curitiba, v. 6, n. 10, p.80216-80235, oct. 2020. ISSN 2525-8761
ABSTRACT
The increasing concerns about fossil fuel sources have generated growth in investment in renewable sources. The slow pyrolysis of lignocellulosic materials has become favourable because to producing energy and is capable of supplying products with high added value. Accordingly, through the application of artificial neural networks, this study evaluated the kinetics of the slow pyrolysis of the powder obtained from the fruit peel of Pachira aquatica Aubl. in natural and chemical modified form to determine the kinetic parameters using the Friedman, Kissinger and Ozawa isoconversion methods and introduction of Fraser-Suzuki deconvolution method to obtain the individual kinetic parameters for the pseudo-cellulose component. The results allowed the conclusion that the applied neural network was efficient in the prediction of the thermal data, obtaining similar thermogravimetric profiles to experimental ones and high determination values. The Friedman method was the best fit for the data, and the activation energies showed that the samples submitted to chemical treatment obtained lower activation energy, due to the modification of the components of the lignocellulosic matrix.
Keywords: Biomass, Kinetic Parameters, Artificial Neural Network, Activation Energy, Chemical
Treatment, Pyrolysis.
RESUMO
A crescente preocupação com as fontes de combustíveis fósseis gerou um crescimento no investimento em fontes renováveis. A lenta pirólise de materiais lignocelulósicos tornou-se favorável porque produz energia e é capaz de fornecer produtos com alto valor agregado. Assim, através da aplicação de redes neurais artificiais, este estudo avaliou a cinética da pirólise lenta do pó obtido a partir da casca da fruta de Pachira aquatica Aubl. de forma natural e química modificada para determinar os parâmetros cinéticos usando os métodos de isoconversão Friedman, Kissinger e Ozawa e a introdução do método de deconvolução Fraser-Suzuki para obter os parâmetros cinéticos individuais para o componente pseudo-celulósico. Os resultados permitiram concluir que a rede neural aplicada foi eficiente na predição dos dados térmicos, obtendo perfis termogravimétricos semelhantes aos experimentais e valores de determinação elevados. O método Friedman foi o mais adequado para os dados, e as energias de ativação mostraram que as amostras submetidas ao tratamento químico obtiveram menor energia de ativação, devido à modificação dos componentes da matriz lignocelulósica.
Palavras-chave: Biomassa, Parâmetros Cinéticos, Rede Neural Artificial, Energia de Ativação,
Braz. J. of Develop.,Curitiba, v. 6, n. 10, p.80216-80235, oct. 2020. ISSN 2525-8761
1 INTRODUCTION
Non-renewable sources of energy, especially fossil fuels, still predominate in the world energy matrix, as well as in all countries individually. However, it is impossible to maintain this state due to the limits of available reserves and the environmental impacts, especially those concerningclimate change[1] competition for oil and regional conflicts[2, 3]. Renewable energies become favourable; in addition to being considered an inexhaustible reserve [4], its environmental impact is far lessthan that caused by the fossil energy sources, thus, reducingthe emission of greenhouse gases[5, 6]. In this sense, lignocellulosic biomassesarehighlighted as a possible alternative among other sources because it is widely available and is neutral in the production of carbon dioxide [7]. In addition, lignocellulosic biomasses produce not only energy, but also other products of high economic value [8–12]by the application of different technologies [11, 13, 14]. Among the technologies using inbiomass processing, pyrolysis [8, 15]has advanced in research because it is a thermochemical process of thermal decomposition in the absence of oxygen and can be classified as slow or fast, depending on the working temperature, providing liquid, gaseous and solid products [16]. Compared toother thermal methods, such as gasification and combustion, pyrolysis allows for the detailed characterization of thermal and kinetic behaviour, permitting the determination of the activation energy of the process, which is useful for other stages of the operation and comparative studies [17]. The use of artificial neural networks in these systems has increased significantly [18–21],and in this work, the multi-layer feed-forward neural network was implemented through MATLAB software with the objective of predicting the thermokinetic behaviour of the samples obtained from the fruit peel of Pachira aquatica Aubl. in its natural form (P) and chemically modified via treatment with 1.22 mol L-1C3H9N (PBO) or2.5 mol L-1 NaOH(PBI)
by evaluating the TG/DTG curves atheating rates of 5, 10, 15 and 20ºC min-1. The Fraser-Suzuki deconvolution procedure was performed for the evaluation of kinetic parameters by the Friedman, Kissinger and Ozawa isoconversion methods.
2 MATERIALS AND METHODS
2.1 PREPARATION OF BIOMASSES
2.1.1 Natural samples
Samples were obtained following the procedure proposed by Carvalho and Virgens (2018) by washing the fruit peel of Pachira aquatica Aubl. with tap water to remove impurities. The shells were then washed with ultrapure water and decontaminated in a nitric acid bath, HNO3 (10% v v-1),
Braz. J. of Develop.,Curitiba, v. 6, n. 10, p.80216-80235, oct. 2020. ISSN 2525-8761
performed with ultrapure water. Thesampleswere dried using the conventional method in an SL100 oven for 24 h at1.01 x 105Paand 378 K. The samples were ground in a knife mill and passed through an80-mesh sieve. The natural sample was referred to asP.
2.1.2 Treatment of Pachira aquatica Aubl. samples
The chemical treatment of the P sample was performed following the procedure proposed by Carvalho and Virgens (2018), where C3H9N (REATEC, 1.22 mol L-1) or NaOH (VETEC, 2.5
mol L-1) solution were added at a ratio of 1:10 and stirred (NOVA ETHIC MOD.109) for 24 h at 120 rpm. The samples were then filtered, and the solids obtained were dried in an air-circulating oven (SL100 model) at 378 K for 24 h. Subsequently, the solids were ground and passed through an 80-mesh sieve, generating the PBO and PBI, which were treated with C3H9N and NaOH,
respectively [22].
2.2 MOISTURE CONTENT
The moisture content was determined according to ASTM E1756-08, Method A [23]. For the analysis, 1g of natural (P) or modified (PBO orPBI) sample was weighed in a crucible and oven dried (105±3°C) for 2h. Then, the crucible containing the sample was cooled in a desiccator and weighed using an analytical balance. The moisture content was calculated according to Equation 1:
%moisture =𝑚1−𝑚2
𝑚1 𝑥100 (1)
where m1 is the mass of the wet sample (g) and m2 is the mass of the dry sample (g).
2.3 THERMAL ANALYSIS
The thermogravimetry (TG) of P, PBO and PBI samples were performed under atmospheric pressure using a TG/DTA analyser (Shimadzu model DTG 60). Approximately 8 mg of the sample was analysed in a dynamic nitrogen atmosphere (N2) with a constant flow of 50 mL min-1 using a
platinum crucible atfour heating rates (5, 10, 15 or 20°C min-1). From the TG data, the analyserprovided the DTG results.
Braz. J. of Develop.,Curitiba, v. 6, n. 10, p.80216-80235, oct. 2020. ISSN 2525-8761 2.4 PYROLYTIC KINETIC MODELLING
2.4.1 Kinetic model
Generally, in TG the solid-state material is heated at a constant heating rate (β = dT/dt K s
-1), under controlled conditions, which is characterized as a non-isothermal analysis:
𝛽𝑑𝛼
𝑑𝑇 = 𝑓(𝛼)𝑘(𝑇) (2)
The conversion form of the reaction rate according to Arrhenius law can be expressed as:
𝑑𝛼 𝑑𝑇= 𝐴 𝛽exp ( −𝐸 𝑅𝑇)𝑓(𝛼) (3)
where E denotes the apparent activation energy (J mol-1), A denotes the pre-exponential factor (s-1), T is absolute temperature (K), R is the ideal gas constant (8.3145 J mol-1 K-1),𝑓(α) denotes the mechanism model thatdepends on the conversion (α), which is known as the normalized mass(α∈ [0,1]) and is dimensionless. The conversion factor can be expressed as:
𝛼 = 1 − 𝑥 = (𝑚0− 𝑚𝑇)/(𝑚0− 𝑚𝑓) (4)
where𝑚0, 𝑚𝑇 and 𝑚𝑓 denotes the normalized mass of the sample at the initial temperature
(T0), given temperature T and final temperature (Tf), respectively; 𝑥 denotes the normalized mass
remaining. The integral of Equation3gives:
𝑔(𝛼) = ∫ 𝑓(𝛼)𝑑𝛼 = 𝐴 𝛽∫ exp ( −𝐸 𝑅𝑇) 𝑑𝑇 𝑇 𝑇0 𝛼 0 (5)
where g(α) is an integral form of the 𝑓(α), which is also dependent on the conversion factor, α.
Several kinetic methods have been presented in the literature, but they can be classified into two main groups: fitting-model or model-free. Although model-free methods (also called iso-conversion methods) propose the determination of the activation energy without proposing any specific reaction mechanism or model for the transformation, it is believed to be accuratefor a single step. The E values at given α values, Eα, can be estimated by using 3–5 runs at different heating
Braz. J. of Develop.,Curitiba, v. 6, n. 10, p.80216-80235, oct. 2020. ISSN 2525-8761
rates without known 𝑓(α) or g(α) values. Although there are many iso-conversional methods, one of the most widely used is the Friedman method, which is expressed as:
ln[[𝛽𝑖(𝑑𝛼
𝑑𝑇)𝛼] = ln[𝐴𝛼𝑓(𝛼)] − 𝐸𝑎
𝑅𝑇𝛼,𝑖 (6)
where the subscript i means i-th heating rate,𝑇𝛼,𝑖 is the temperature corresponding to given α of i-th
heating rate, (dα/dT)α,𝐸𝑎,𝐴𝛼 denotes differential α versus T, the apparent activation energy,
pre-exponential factor of given α, respectively. In the linear fittings of ln[[𝛽𝑖(𝑑𝛼
𝑑𝑇)𝛼] vs -1/Tα,i, Eα can
be estimated from the slope Eα/R, and Aα can be calculated from the intercepts once the most suitable
𝑓(α) is known.
2.4.2 Fraser-Suzuki deconvolution procedure
Sometimes due to the complexity of the reagents and the substantial number of simultaneous reactions, it is necessary to apply the deconvolution procedure of the global curves toindividual curves. The deconvolution method of the dα/dT signal for the n-th pseudo component as a Fraser-Suzuki (FSF) temperature function, such that:
𝑑𝛼 𝑑𝑇|𝑛 = 𝐻𝑝,𝑛exp {− 𝑙𝑛(2) 𝐴𝑠,𝑛2 ln [1 + 2𝐴𝑠,𝑛 𝑇−𝑇𝑝,𝑛 𝑞ℎ𝑓,𝑛 ] 2 } (7)
where Tp, As, Hp and qhf indicate peak (K) temperature, curve asymmetry (dimensionless),
curve height (K-1) and half-width (K) of dα/dT peak vs. n-th pseudo component, respectively.
2.4.3 Calculation details
For the FSF application, the Fityk software (distributed under the terms GNU General Public License) version 0.9.8 [36] was used, withthe Log-normal function defined as:
𝑦 = ℎ exp {− 𝑙𝑛(2) [𝑙𝑛 (1+2𝑏 𝑥−𝑐 𝑤 ) 𝑏 ] 2 } (8)
Braz. J. of Develop.,Curitiba, v. 6, n. 10, p.80216-80235, oct. 2020. ISSN 2525-8761
where h is the parameter Hp, c is the parameter Tp, w is the parameter qhf, b is the parameter
As. Withthese parameters, the same designations are also true as those outlined for the Fraser-Suzuki
function presented in Equation 7.
2.5 ARTIFICIAL NEURAL NETWORK
In this paper, the Neural Network Toolbox from MATLAB software version R2017a was used to implement Artificial Neural Network’s (ANN) training, validation and test algorithms.Multilayer Feedforward Neural Network architecture, which presents one or more hidden layers, was applied to build the predictive model. Hyperbolic tangent sigmoid and linear transfer functions were used as input-to-hidden layer and hidden-to-output layer activation functions, respectively.The dataset was randomly distributed in three groups: 54% in training, 23% in validation and 23% in test. One input variable (temperature [ºC]) and two output variables (DTA [uV] and TG [mg]) were used for training, for which the Levemberg-Marquart algorithm was utilized. This way, 50 ANN were created, each one with one input layer, two hidden layers and one output layer, and a different number of hidden neurons (processing units) that varied from 5 to 54. Four ANNs, relative to four heating rates, were created for each sample (P, PBI and PBO).
After training, the ANNs performances were evaluated through mean squared error (mse) and determination coefficient (R²) values, and the network that had the best values (low mse and R² value close to one) were selected for each case (sample and heating rate). Later, data prediction was done with preestablished inputs.
3 RESULTSANDDISCUSSION
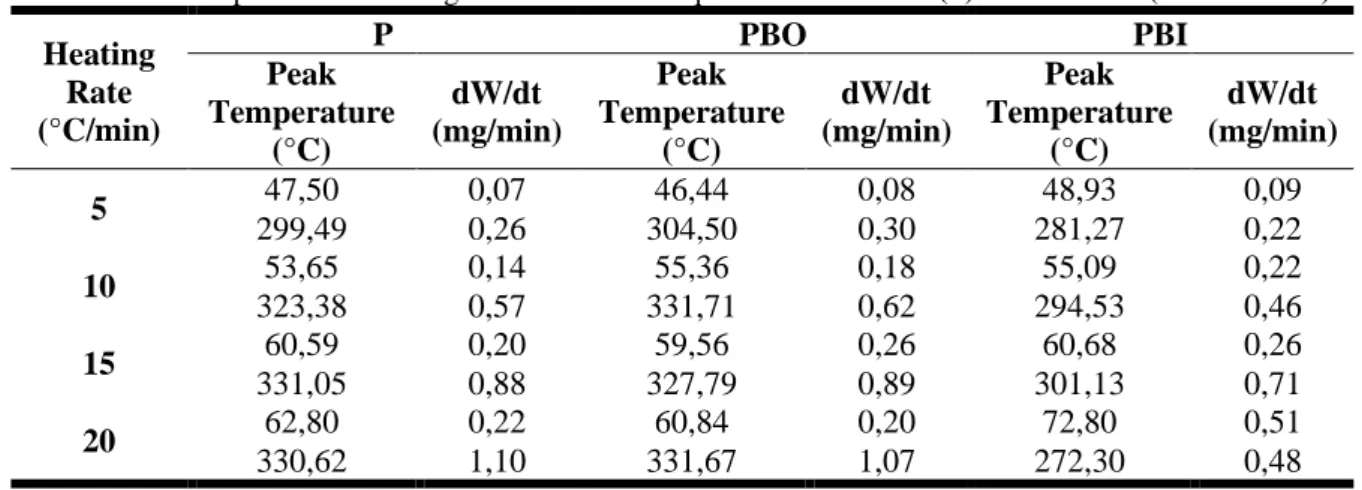
The DTG curves at different heating rates are shown in Figure 1, while peak conversion temperatures and mass loss rates are shown in Table 1.
Braz. J. of Develop.,Curitiba, v. 6, n. 10, p.80216-80235, oct. 2020. ISSN 2525-8761 Figure 1.DTG profiles for samples P (a), PBO (b) and PBI (c)
The first decomposition event related to the first peak present in the graph profile is generally attributed to the evaporation of volatile materials and physically adsorbed water present on the surface of the material [17, 24]. This higher variation to PBI samplecan be attributedto the incorporation of hydroxyl groups (-OH) on the surface of this solid [22]due to the network’s interaction with water molecules, thereby increasing its moisture content [25].
Table 1 Peak temperatures and weight loss of Pachira aquatica Aubl. nature (P) and modified (PBO and PBI).
Heating Rate (°C/min) P PBO PBI Peak Temperature (°C) dW/dt (mg/min) Peak Temperature (°C) dW/dt (mg/min) Peak Temperature (°C) dW/dt (mg/min) 5 47,50 0,07 46,44 0,08 48,93 0,09 299,49 0,26 304,50 0,30 281,27 0,22 10 53,65 0,14 55,36 0,18 55,09 0,22 323,38 0,57 331,71 0,62 294,53 0,46 15 60,59 0,20 59,56 0,26 60,68 0,26 331,05 0,88 327,79 0,89 301,13 0,71 20 62,80 0,22 60,84 0,20 72,80 0,51 330,62 1,10 331,67 1,07 272,30 0,48
Braz. J. of Develop.,Curitiba, v. 6, n. 10, p.80216-80235, oct. 2020. ISSN 2525-8761
The PBO sample also had higher volatile and moisture content relative to the natural sample P because the chemical treatment step was performed with a highly volatile chemical substance, probably impregnated on the surface of the released material duringsample heating.Table 2 compares the moisture content results with loss of mass in the first event for the samples, where evidence suggests that more than 50% of the loss of mass in the first event is associated with the presence of water molecules.
Table 2 Moisture content and mass loss percentage of the first event for chemically treated and natural samples
Sample Moisture content(%) Loss of mass first event (%)
Reference
Pine Wood 9,18 - (Hu et al., 2016)
Bamboo 9,45 - (Hu et al., 2016)
P 7,75 9,35 This work
PBO 9,12 9,60 This work
PBI 11,78 13,08 This work
The second event, mostly related to the degradation of hemicellulose, cellulose and the onset of the decomposition of lignin, which is a component of the matrix of the material [13, 26, 27], extends from 200–500°C with higher degradation.ThePBI sample obtained lower mass variation in this region, due to the partial removal of lignin[28]by the inorganic base, with a loss of 42.40%, while the other samples had losses of 52.57% and 55.54% for P and PBO, respectively, indicating greater thermal stability in relation to the other samples in this temperature range.The influence of partial lignin removal can be observed in the DTG results (Figure 1), where the second peak related to the decomposition of the major lignocellulosic matrix components inthe PBI sample appears atlower temperatures. In fact, the alkaline treatment with sodium hydroxide modified the surface properties of the solid due to the partial removal of the components of the lignocellulosic matrix of the material, resulting in a higher crystallinity index, zero load point (pHpcz) and the polymorphic transition of cellulose [22, 29]. The main decomposition of lignocellulosic materials (240–350°C) includes the reduction of the degree of polymerization by the appearance of free radicals with the loss of water and the formation of CO, CO2 and residues such as coal[30]and lignin (280–500°C)
starting in the second stage and extending to the third stage of decomposition[13].The first stage occurs at a temperature below 100°C, which is related to the loss of residual water.The third stage of mass loss, in which lignin degradation continued up to approximately 500°C, is characterized by a ‘pseudo-stationary’ stage, in which a gradual loss of mass occurs until reaching the limit temperature of the analysis (1000°C).
Braz. J. of Develop.,Curitiba, v. 6, n. 10, p.80216-80235, oct. 2020. ISSN 2525-8761
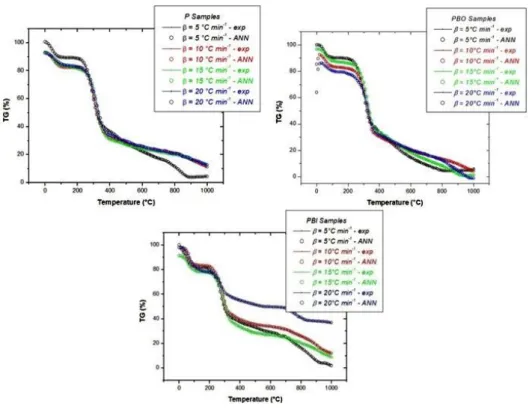
Figure 2 Comparison of experimental and ANN predicted thermal data at varying heating rates to P (a), PBO (b) and PBI (c) samples.
Figure 2 compares the profiles of the mass loss events obtained by the experimental TG with the decomposition results predicted by the artificial neural network applied to the thermogravimetric data.Similar thermogravimetric profiles indicate that the application of the artificial neural network can satisfactorily describe the thermokinetic behaviour of the natural and chemically treated samples, presenting small low temperature deviation (b) by neural network extrapolations inherent to the intrinsic characteristics of the sample. This characteristic suggests that, despite the high performance indices, there is still an associated error, as seen in Table 3.
Table 3 Determination index of the thermogravimetric profile predicted by the neural network
β (°C min-1)
Samples 5 10 15 20
P 0,9999 0,9998 0,9991 0,9998
PBO 0,9999 0,9999 0,9999 0,9999
PBI 0,9999 0,9999 0,9999 0,9999
3.1 FRASER- SUZUKI DECONVOLUTION RESULTS
Due to the complexity and heterogeneity of the lignocellulosic samples, in the stages of decomposition the deconvolution procedure was performed usingthe Fraser-Suzuki method in order to determine the kinetic parameters of the individual pseudo-components [31], since the pyrolysis
Braz. J. of Develop.,Curitiba, v. 6, n. 10, p.80216-80235, oct. 2020. ISSN 2525-8761
of the lignocellulosic biomass can be considered a weighted sum of the pyrolysis of cellulose, hemicellulose and lignin[32].
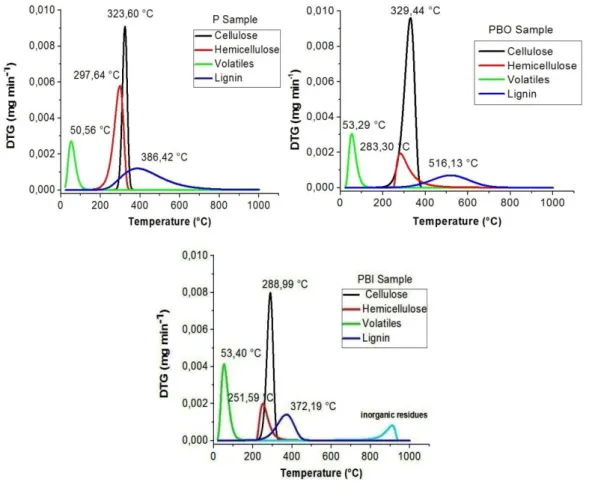
Figure 3 DTG curves of the pseudo-components for the samples P (a), PBO (b) and PBI (c), after deconvolution by the Fraser-Suzuki method
In Figure 3 shows the DTG plots for the P, PBO and PBI samples deconvoluted by the Fraser-Suzuki method at arate of β = 10°C min-1. The presence of four main peaks was observed
that obeyed the same sequence of decomposition of the samples (humidity, hemicellulose, cellulose and lignin, respectively).The deconvolution of the three major peaks associated with the main components of the lignocellulosic matrix [33]provided the second DTG peak seen in Figure 1. The DTG results provide greater clarity of the highmoisture content present in the PBI sample compared to the other samples, corroborating the values found in the moisture content analysis. The peak related to the cellulose decomposition in the PBI sample was at alower intensity than the other samples. The opposite effect was observed for the PBO sample, which presented a higher cellulose-related peak than the natural sample P. This isbecausethe alkaline treatment with the organic base was capable of promoting the reorganization ofthe material structure, due to the rupture of the hydrogen bonds present in the cellulose structure [29].
Braz. J. of Develop.,Curitiba, v. 6, n. 10, p.80216-80235, oct. 2020. ISSN 2525-8761
Table 4 Activation energy values by the Friedman method and Fraser-Suzuki parameters for the pseudo cellulose component in the P, PBO and PBI samples
Samples
Friedman (cellulose)
Parameters of Fraser Suzuki
β (°C min-1) 𝐸𝑎 ̅̅̅(kJ mol-1) T p(K) As Hp(K-1) qhf(K) P PBO PBI 115,42 596,75 -9,14x10⁻² 9,10 x10⁻² 28,54 10 91,34 602,59 -3,35x10⁻¹ 9,62x10⁻² 54,98 10 4,95 562,14 -1,73x10⁻¹ 7,98x10⁻² 36,63 10
Since the alkaline treatment performed can promote changes in the structure of the material [22, 28, 29, 34]the values of Ea of activation by the Friedman method and the Fraser-Suzuki parameters for the cellulose pseudo-component in the samples were determined. As shown in Table 4, the Ea related to the decomposition of cellulose suffered a large decrease in the PBO and PBI samples, due to the structural modification caused by the chemical treatment.
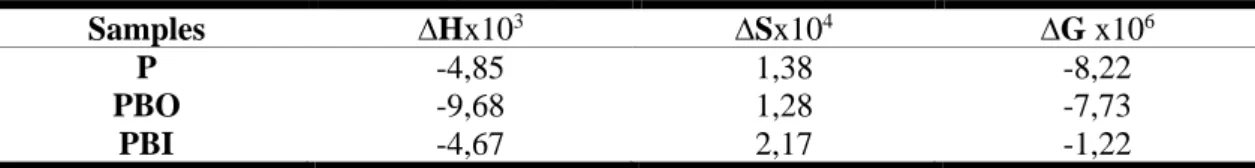
Table 5. Enthalpy, entropy and Gibbs free energy of samples
Samples ∆Hx103 ∆Sx104 ∆G x106
P -4,85 1,38 -8,22
PBO -9,68 1,28 -7,73
PBI -4,67 2,17 -1,22
In Table 5 shows the enthalpy values found for the samples. It can be observed that the PBO sample showed a higher enthalpy value indicating that the treatment with the organic base favors a greater exothermic capacity in relation to the other samples and that the treatment with an inorganic base is not significant when compared to the natural sample (P). It can be seen that the degree of disorder is in agreement with the state of decomposition of the samples according to the TG results and that the PBI sample presents itself with the energy free energy.
3.2 KINETIC STUDY
The kinetic parameters of the results obtained by the experimental and predicted thermogravimetric analysis by the neural network were determined by the Friedman, Ozawa and Kissinger methods for the decomposition range α = 0.2–0.9 relative to the main components of the sample (hemicellulose, lignin). The isoconversion methods are based on the fact that the reaction rate in a given conversion fraction is only a function of the temperature, and the conversion function and the kinetic parameters in a given conversion fraction is independent of the heating rate[30]. As discussed, the approximately 10% of masslostduring the first stage of decomposition, which was
Braz. J. of Develop.,Curitiba, v. 6, n. 10, p.80216-80235, oct. 2020. ISSN 2525-8761
related to the output of volatile materials and water, is disregarded from the process of determination of the kinetic parameters due to the difference in mechanism of decomposition of lignocellulosic components [24, 30].
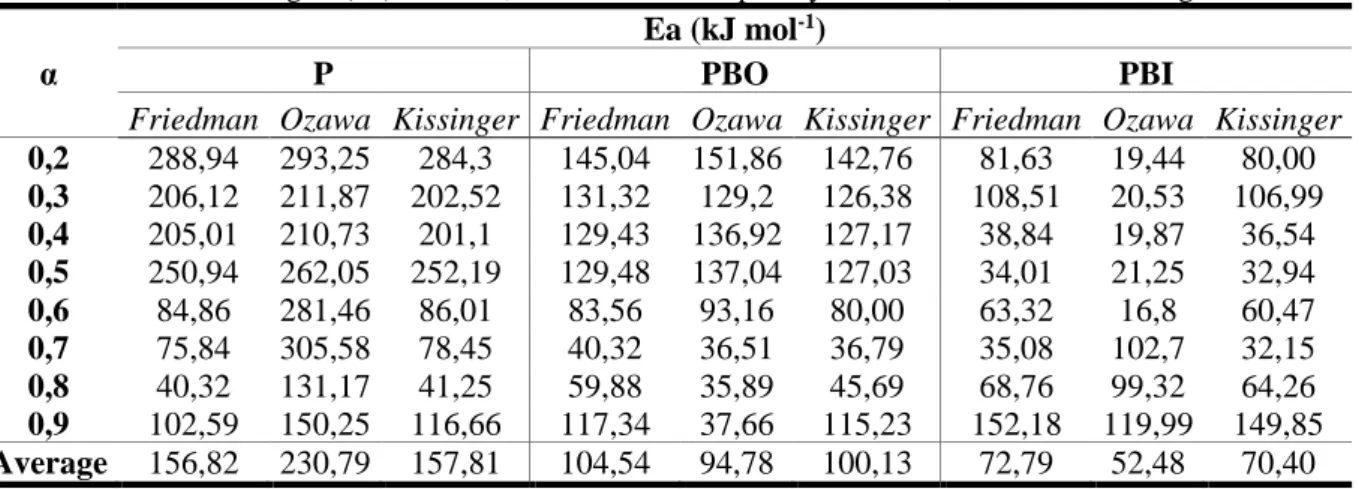
In Table 6 summarizes the calculated activation energies obtained for the samples. The PBI sample obtained lower valuesof activation energy for all the methods studied in relation to the other samples, indicating a greater predisposition to solid phase reactions. This behaviour is attributed to the alkaline treatment employed,whichwas able to promote a partial polymorphic transition from cellulose I to cellulose II, in addition to removing amorphous components from the lignocellulosic matrix, such as lignin and hemicellulose [22].
Table 6 Activation energies (Ea) for the P, PBO and PBI samples by Friedman, Ozawa and Kissinger methods
α
Ea (kJ mol-1)
P PBO PBI
Friedman Ozawa Kissinger Friedman Ozawa Kissinger Friedman Ozawa Kissinger
0,2 288,94 293,25 284,3 145,04 151,86 142,76 81,63 19,44 80,00 0,3 206,12 211,87 202,52 131,32 129,2 126,38 108,51 20,53 106,99 0,4 205,01 210,73 201,1 129,43 136,92 127,17 38,84 19,87 36,54 0,5 250,94 262,05 252,19 129,48 137,04 127,03 34,01 21,25 32,94 0,6 84,86 281,46 86,01 83,56 93,16 80,00 63,32 16,8 60,47 0,7 75,84 305,58 78,45 40,32 36,51 36,79 35,08 102,7 32,15 0,8 40,32 131,17 41,25 59,88 35,89 45,69 68,76 99,32 64,26 0,9 102,59 150,25 116,66 117,34 37,66 115,23 152,18 119,99 149,85 Average 156,82 230,79 157,81 104,54 94,78 100,13 72,79 52,48 70,40
The PBO sample also showed reductioninactivation energy, compared to the natural sample P, in the decomposition range of the main components. The treatment with 2-amino propane was able to promote breaks in the hydrogen bonds present in the cellulose, leading to a structural reorganization and formation of amino-cellulose complexes [29, 34, 35]. Due to these perturbations the apparent Ea to promote the decomposition of the material under the studied conditions decreases, obeying the following general order for all isoconversion methods studied: EaP>EaPBO>EaPBI.
For PBI sample in the range α = 0.8–0.9, which occurred in the final step of the analysis, there was an increase in apparent Ea for all the studied methods. This increase can be attributed to sodium impregnationon the surface of the solid in the pre-treatment stage, which would be capable of forming strong interactions with cellulose [35]and other inorganic species.In the other samples, due to the nature of the treatment carried out, the significant incorporation of inorganic materials in the sample surface was not observed.
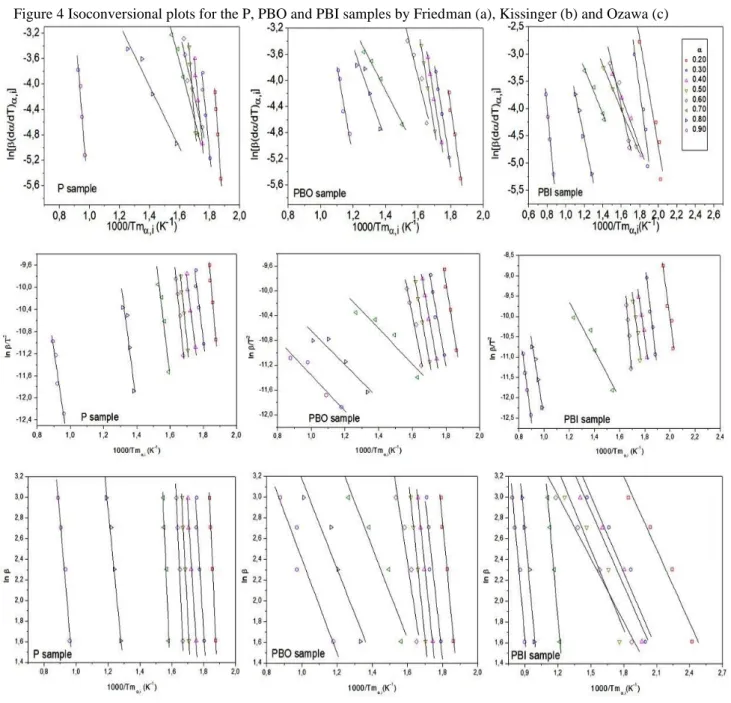
In Figure 4 shows the isoconversion graphs obtained from the Friedman, Kissinger and Ozawa methods. The non-parallelism of the lines suggests modification of the decomposition
Braz. J. of Develop.,Curitiba, v. 6, n. 10, p.80216-80235, oct. 2020. ISSN 2525-8761
mechanism in the range α = 0.2–0.6, corresponding to the decomposition of the cellulose fraction present in the sample.
Figure 4 Isoconversional plots for the P, PBO and PBI samples by Friedman (a), Kissinger (b) and Ozawa (c)
Among the methods studied, the Friedman method was evaluated to be the one that best fit the results, this method was chosen to evaluate the efficiency of the artificial neural network in the prediction of the experimental results of activation energy (Ea).
However, the variation of the Ea values for all the samples indicatesthe non-compliance with the principle of isoconversionality (Figure 5) of the sample, since it has a complex matrix undergoing chemical treatment.
Braz. J. of Develop.,Curitiba, v. 6, n. 10, p.80216-80235, oct. 2020. ISSN 2525-8761
Figure 5 Comparison of activation energies obtained from experimental an artificial neural network predicted data from Friedman model for P (a), PBO (b) and PBI (c) samples respectively
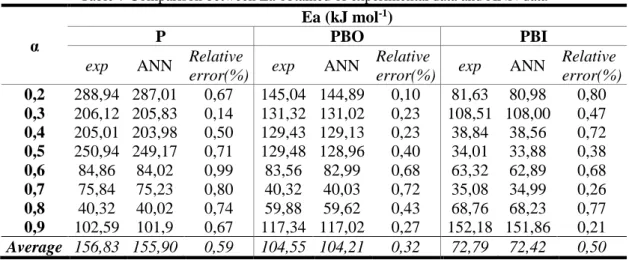
The TG results obtained by the neural network analysis were used to determine the Ea in the samples. The results found can be compared in Table 7.
Table 7 Comparison between Ea obtained of experimental data and ANN data
α
Ea (kJ mol-1)
P PBO PBI
exp ANN Relative
error(%) exp ANN
Relative
error(%) exp ANN
Relative error(%) 0,2 288,94 287,01 0,67 145,04 144,89 0,10 81,63 80,98 0,80 0,3 206,12 205,83 0,14 131,32 131,02 0,23 108,51 108,00 0,47 0,4 205,01 203,98 0,50 129,43 129,13 0,23 38,84 38,56 0,72 0,5 250,94 249,17 0,71 129,48 128,96 0,40 34,01 33,88 0,38 0,6 84,86 84,02 0,99 83,56 82,99 0,68 63,32 62,89 0,68 0,7 75,84 75,23 0,80 40,32 40,03 0,72 35,08 34,99 0,26 0,8 40,32 40,02 0,74 59,88 59,62 0,43 68,76 68,23 0,77 0,9 102,59 101,9 0,67 117,34 117,02 0,27 152,18 151,86 0,21 Average 156,83 155,90 0,59 104,55 104,21 0,32 72,79 72,42 0,50
The Ea values found for the experimental results presented with a maximum relative error of 0.99% for the converting fraction α = 0.6 in the sample P. The low error associated with the prediction of Ea indicates the network’s efficiency in predicting the thermokinetic decomposition results.
3.3 MULTI-ELEMENT ANALYSIS
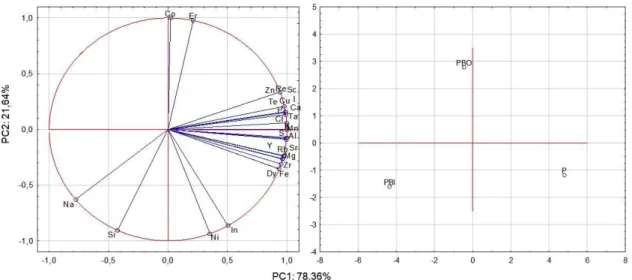
A multi-element analysis of the samples was performed, and PCA was applied and auto-scaled using Statistica Software 7.0. The components (PC1 x PC2) were able to describe 100% of the total data variance by providing discriminatory information related to the samples. Figure 6 shows the PC1xPC2 graphs of the principal component analysis (PCA) and the obtained results show that the alkaline treatment allows the discrimination of the samples in different areas of the graph of scores. It is apparent that the treatment performed on the samples was able to decrease the
Braz. J. of Develop.,Curitiba, v. 6, n. 10, p.80216-80235, oct. 2020. ISSN 2525-8761
concentration of a large part of the elements present in the natural sample.This effect can be attributed to the partial removal of the main components of the lignocellulosic matrix and depolymerization reactions of the lignocellulosic matrix, which was able to remove components of the material matrix, and consequently, reduced the chemical species present in the sample.
Figure 6 Principal component graphs representing the relationship between the variables (a) "loadings" (b) "scores"
The correlation eigenvalues of the matrix for PC1 and PC2 are, respectively, 21.16 and 5.84. The first major component (PC1) describes 78.36% of the total variation, and the elements K, Mn, Ca, Cu, Al, P, S, Cl, Te, I and Ta are the dominant variables in this PC, which resulted in a separation of the samples, since in the second main component (PC2) the dominant variables are the elements Co and Er. Figure 5B shows the separation ofthe most significant elements in the samples.Due to the alkaline treatment, the PBI sample moves to the region of higher Na concentration, which favours the production of activated carbon with better properties.
4 CONCLUSIONS
The employed the artificial neural network was effective in predicting the thermokinetic behaviour of the natural and chemically modified samples, obtaining activation energyvalues close to that obtained by the experimental results with a maximum error of 0.99%. Due to the heterogeneity of the sample, the observed activation energy results indicated non-compliance with the principle of isoconversionality, and a change of decomposition mechanism from α = 0.6. In addition, the alkaline treatment promoted an Ea reduction in the chemically treated samples (PBO and PBI);this effect wasmore pronounced in the sample treated with the inorganic base (PBI), due to the removal of major components of the sample matrix and partial modification of its structure,
Braz. J. of Develop.,Curitiba, v. 6, n. 10, p.80216-80235, oct. 2020. ISSN 2525-8761
evidencing that the modifications carried out in the samples promoted by the alkaline treatment favoured solid phase reactions, as well as processes that aquired pyrolysis energy and obtaining high value products in the following order: PBI > PBO > P. However, due to enthalpy factors resulting from structural changes, the free energy of Gibbs follows the following order: ∆GP> ∆GPBO> ∆GPBI.
ACKNOWLEDGEMENTS
Braz. J. of Develop.,Curitiba, v. 6, n. 10, p.80216-80235, oct. 2020. ISSN 2525-8761
REFERENCES
1. Wang, X., Liu, Q., Bai, Z., Lei, J., Jin, H.: Thermodynamic investigations of the supercritical
CO2system with solar energy and biomass. Appl. Energy. 0–1 (2017).
https://doi.org/10.1016/j.apenergy.2017.08.001
2. Toklu, E.: Biomass energy potential and utilization in Turkey. Renew. Energy. 107, 235– 244 (2017). https://doi.org/10.1016/j.renene.2017.02.008
3. Bajwa, D.S., Peterson, T., Sharma, N., Shojaeiarani, J., Bajwa, S.G.: A review of densified solid biomass for energy production. Renew. Sustain. Energy Rev. 96, 296–305 (2018). https://doi.org/10.1016/j.rser.2018.07.040
4. Mao, G., Huang, N., Chen, L., Wang, H.: Research on biomass energy and environment from the past to the future: A bibliometric analysis. Sci. Total Environ. 635, 1081–1090 (2018). https://doi.org/10.1016/j.scitotenv.2018.04.173
5. de Marco, B.A., Rechelo, B.S., Tótoli, E.G., Kogawa, A.C., Salgado, H.R.N.: Evolution of
green chemistry and its multidimensional impacts: A review,
https://doi.org/10.1016/j.jsps.2018.07.011, (2018)
6. Janković, B., Manić, N., Dodevski, V., Popović, J., Rusmirović, J.D., Tošić, M.: Characterization analysis of Poplar fluff pyrolysis products . Multi-component kinetic study. Fuel. 238, 111–128 (2019). https://doi.org/10.1016/j.fuel.2018.10.064
7. Arregi, A., Amutio, M., Lopez, G., Bilbao, J., Olazar, M.: Evaluation of thermochemical routes for hydrogen production from biomass : A review. Energy Convers. Manag. 165, 696–719 (2018). https://doi.org/10.1016/j.enconman.2018.03.089
8. Raza, S., Tariq, R., Hameed, Z., Ali, I., Taqvi, S.A., Naqvi, M., Niazi, M.B.K., Noor, T., Farooq, W.: Pyrolysis of high-ash sewage sludge : Thermo-kinetic study using TGA and arti fi cial neural networks. Fuel. 233, 529–538 (2018). https://doi.org/10.1016/j.fuel.2018.06.089
9. Kang, K., Azargohar, R., Dalai, A.K., Wang, H.: Hydrogen production from lignin , cellulose and waste biomass via supercritical water gasification : Catalyst activity and process optimization
study. ENERGY Convers. Manag. 117, 528–537 (2016).
https://doi.org/10.1016/j.enconman.2016.03.008
10. Shamsipur, M., Mahdi, S., Somayyeh, S.: Effect of functional group on thermal stability of
cellulose derivative energetic polymers. Fuel. 95, 394–399 (2012).
https://doi.org/10.1016/j.fuel.2011.09.036
11. Çepelio, Ö., Mutlu, İ., Yaman, S., Haykiri-acma, H.: Activation energy prediction of biomass wastes based on di ff erent neural network topologies. 220, 535–545 (2018). https://doi.org/10.1016/j.fuel.2018.02.045
12. Liu, C., Wang, X., Lin, F., Zhang, H., Xiao, R.: Structural elucidation of industrial bioethanol residual lignin from corn stalk : A potential source of vinyl phenolics. Fuel Process. Technol. 169, 50–57 (2018). https://doi.org/10.1016/j.fuproc.2017.09.008
Braz. J. of Develop.,Curitiba, v. 6, n. 10, p.80216-80235, oct. 2020. ISSN 2525-8761
13. Hu, M., Chen, Z., Wang, S., Guo, D., Ma, C., Zhou, Y., Chen, J., Laghari, M., Fazal, S., Xiao, B., Zhang, B., Ma, S.: Thermogravimetric kinetics of lignocellulosic biomass slow pyrolysis using distributed activation energy model, Fraser-Suzuki deconvolution, and iso-conversional
method. Energy Convers. Manag. 118, 1–11 (2016).
https://doi.org/10.1016/j.enconman.2016.03.058
14. Diez, M.A., Alvarez, R., Fernández, M.: Biomass derived products as modifiers of the
rheological properties of coking coals. Fuel. 96, 306–313 (2012).
https://doi.org/10.1016/j.fuel.2011.12.065
15. Ye, G., Luo, H., Ren, Z., Sajjad, M., Liu, C., Tawab, A., Al-ghafari, A.B., Omar, U., Gull, M.: Evaluating the bioenergy potential of Chinese Liquor-industry waste through pyrolysis , thermogravimetric , kinetics and evolved gas analyses. Energy Convers. Manag. 163, 13–21 (2018). https://doi.org/10.1016/j.enconman.2018.02.049
16. Sunphorka, S., Chalermsinsuwan, B., Piumsomboon, P.: Artificial neural network model for the prediction of kinetic parameters of biomass pyrolysis from its constituents. Fuel. 193, 142–158 (2017). https://doi.org/10.1016/j.fuel.2016.12.046
17. Chen, Z., Hu, M., Zhu, X., Guo, D., Liu, S., Hu, Z., Xiao, B., Wang, J., Laghari, M.: Characteristics and kinetic study on pyrolysis of five lignocellulosic biomass via thermogravimetric analysis. Bioresour. Technol. 192, 441–450 (2015). https://doi.org/10.1016/j.biortech.2015.05.062 18. Rojek, B., Suchacz, B., Wesolowski, M.: Artificial neural networks as a supporting tool for compatibility study based on thermogravimetric data. Thermochim. Acta. 659, 222–231 (2018). https://doi.org/10.1016/j.tca.2017.12.015
19. Bárbara, B.D., Araújo, N.R.S., Ligório, R.F., Pujatti, F.J.P., Yoshida, M.I., Sebastião, R.C.O.: Comparative kinetic study of automotive polyurethane degradation in non-isothermal and isothermal conditions using artificial neural network. Thermochim. Acta. 666, 116–123 (2018). https://doi.org/10.1016/j.tca.2018.06.014
20. Liu, Q., Bai, Z., Wang, X., Lei, J., Jin, H.: Investigation of thermodynamic performances for two solar-biomass hybrid combined cycle power generation systems. Energy Convers. Manag. 122, 252–262 (2016). https://doi.org/10.1016/j.enconman.2016.05.080
21. Krzywanski, J., Fan, H., Feng, Y., Rahim, A., Fang, M., Wang, Q.: Genetic algorithms and neural networks in optimization of sorbent enhanced H 2 production in FB and CFB gasi fi ers. Energy Convers. Manag. 171, 1651–1661 (2018). https://doi.org/10.1016/j.enconman.2018.06.098 22. Carvalho, M.S., Virgens, C.F.: Effect of alkaline treatment on the fruit peel of Pachira aquatic Aubl.: Physico-chemical evaluation and characterization. Microchem. J. #pagerange# (2018). https://doi.org/10.1016/j.microc.2018.08.021
23. ASTM E1756: Standard Test Method for Determination of Total Solids in Biomass. Annu. B. ASTM Stand. 11, 3–5 (2002). https://doi.org/10.1520/E1756-08R15.2
24. Magdziarz, A., Wilk, M.: Thermogravimetric study of biomass, sewage sludge and coal
Braz. J. of Develop.,Curitiba, v. 6, n. 10, p.80216-80235, oct. 2020. ISSN 2525-8761 https://doi.org/10.1016/j.enconman.2013.06.016
25. Maria, I., Rosa, D., Kenny, J.M., Maniruzzaman, M., Monti, M., Puglia, D., Santulli, C., Sarasini, F.: Effect of chemical treatments on the mechanical and thermal behaviour of okra (
Abelmoschus esculentus ) fibres. Compos. Sci. Technol. (2010).
https://doi.org/10.1016/j.compscitech.2010.11.023
26. Ding, Y., Ezekoye, O.A., Lu, S., Wang, C.: Thermal degradation of beech wood with thermogravimetry / Fourier transform infrared analysis. Energy Convers. Manag. 120, 370–377 (2016). https://doi.org/10.1016/j.enconman.2016.05.007
27. Yang, H., Yan, R., Chen, H., Lee, D.H., Zheng, C.: Characteristics of hemicellulose , cellulose and lignin pyrolysis. 86, 1781–1788 (2007). https://doi.org/10.1016/j.fuel.2006.12.013 28. Oudiani, A. El, Chaabouni, Y., Msahli, S., Sakli, F.: Crystal transition from cellulose I to cellulose II in NaOH treated Agave americana L . fibre. Carbohydr. Polym. 86, 1221–1229 (2011). https://doi.org/10.1016/j.carbpol.2011.06.037
29. Mittal, A., Katahira, R., Himmel, M.E., Johnson, D.K.: Effects of alkaline or liquid-ammonia treatment on crystalline cellulose: Changes in crystalline structure and effects on enzymatic digestibility. Biotechnol. Biofuels. 4, 1–16 (2011). https://doi.org/10.1186/1754-6834-4-41
30. Cai, J., Xu, D., Dong, Z., Yu, X., Yang, Y., Banks, S.W., Bridgwater, A. V.: Processing thermogravimetric analysis data for isoconversional kinetic analysis of lignocellulosic biomass pyrolysis: Case study of corn stalk. Renew. Sustain. Energy Rev. 82, 2705–2715 (2018). https://doi.org/10.1016/j.rser.2017.09.113
31. Fan, Y., Cai, Y., Li, X., Jiao, L., Xia, J., Deng, X.: Effects of the cellulose , xylan and lignin constituents on biomass pyrolysis characteristics and bio-oil composition using the Simplex Lattice
Mixture Design method. Energy Convers. Manag. 138, 106–118 (2017).
https://doi.org/10.1016/j.enconman.2017.01.075
32. Cheng, Z., Wu, W., Ji, P., Zhou, X., Liu, R., Cai, J.: Applicability of Fraser-Suzuki function in kinetic analysis of DAEM processes and lignocellulosic biomass pyrolysis processes. J. Therm. Anal. Calorim. 119, 1429–1438 (2015). https://doi.org/10.1007/s10973-014-4215-3
33. Ke, J., Chen, S.: Thermal decomposition of lignin structural modification in termite digested softwood ( II ). Fuel. 104, 781–787 (2013). https://doi.org/10.1016/j.fuel.2012.06.066
34. Wada, M., Nishiyama, Y., Langan, P.: X-ray Structure of Ammonia - Cellulose I : New Insights into the Conversion of Cellulose I to Cellulose III I. 2947–2952 (2006)
35. Ogawa, Y., Hidaka, H., Kimura, S.: Formation and stability of cellulose – copper – NaOH crystalline complex. (2013). https://doi.org/10.1007/s10570-013-9977-4