Caminhos de Geografia Uberlândia v. 8, n. 22 set/2007 p. 166 - 174 Página 166 LAND COVER – RELIEF RELATIONSHIPS AND ENVIRONMENTAL RISK EVALUATION IN
SOROCABA – SP1
Alexandre Marco da Silva
Prof. Dr. UNESP Sorocaba amsilva@sorocaba.unesp.br Fabíolla Pereira de Paula Priscila Ikematsu Felipe Muniz Silveira Davi Pajaro Nogueira Michele Bomback Sérgio Henrique Alves Marcello Haddad
Alunos de graduação em Eng Ambiental - UNESP – Sorocaba
ABSTRACT
Considering the crucial role that the relief plays in the landscape dynamics and also considering that the land use / land cover patterns might be a driving force in starting some kinds of environmental impacts, this paper examines the occurrence of the land cover classes in relation the slope categories along the Sorocaba city (SP), and analyses the adequacy of such distribution. This study was carried out through GIS technology and using two main databases: the first one was the digital land cover map for 2003 and the second one was the Digital Elevation Model of the study area (converted into slope map). These two maps were crossed and the resulting map shows that the city presents a predominance of adequate land cover (78.9%). However, approximately 11% of the study area indicates having some type of risk due to incompatibility of the land cover and relief, showing that the land use should be reorganized in these risky areas. The use of soil conservation practices along the agricultural areas and terracing in urban settlements are initiative that should be implemented in order to mitigate or, preferably, eliminate the impacts.
Key-words: land cover, relief, environmental risks, GIS.
RELAÇÕES ENTRE A COBERTURA DO SOLO E O RELEVO E AVALIAÇÃO DE ALGUNS RISCOS AMBIENTAIS EM SOROCABA-SP
RESUMO
Considerando o fundamental papel que o relevo exerce sobre a dinâmica de uma paisagem a considerando também que os padrões de uso e cobertura do solo constituem um vetor de desencadeamento de algumas modalidades de impacto ambiental, este trabalho examina a ocorrência de classes de cobertura do solo em relação as classes de relevo ao longo do município de Sorocaba (SP) e analisa a adequação desta distribuição. Este estudo foi conduzido através de recursos de geoprocessamento e utilizaram-se duas principais bases cartográficas: um mapa digital de cobertura do solo de 2003 e o Modelo de Elevação Digital da área de estudo (convertido posteriormente no mapa de declividade). Estes dois mapas foram cruzados e o mapa
1Recebido em 31/07/2007
Caminhos de Geografia Uberlândia v. 8, n. 22 set/2007 p. 81 - 86 Página 167 resultante apresenta uma predominância de a cateogria “cobertura
adequada”, ocorrendo em 78,9% da área de estudo. Contudo, aproximadamente 11% da area de estudo indica ocorrer riscos devido a incompatibilidade entre a classe de cobertura e a declividade da área, mostrando que o uso da terra deve ser reorganizado nestas áreas de risco e práticas de conservação do solo, bem como terraceamento em lotes urbanos são atividades que devem ser implementadas para mitigar ou preferencialmente eliminar os impactos que possam ocorrer.
Palavras-chave: cobertura do solo, relevo, riscos ambientais, SIG.
INTRODUCTION
Land use / land cover information is essential information for a number of environmental studies, like forest fragmentation (Jorge and Garcia, 1997), change / loss of biodiversity (Smith, 2003), water pollution (Martinelli et al., 1999), environmental planning, and management activities (Rompaey et al., 2001). The current land use patterns, because of their strong influence in starting some kinds of environmental impacts and on how land could be used in the future, represents a crucial factor in deciding how land development, management, and planning activities should be undertaken.
Land use is a decisive relation aspect between the natural and social processes due to connect procedures in social-economical and natural systems. However, the land use can be inadequate in relation with some aspects of the landscape, representing land use conflicts. Conceptually, an area is in conflict when its land use is not adequate with one or more aspects of landscape, as relief, soil classes, and geological basement, among others. These conflicts can be observed through the spatial analysis of the environmental attributes and through the generation of a conflict map that express the incompatibility between the land use aptitude and current/actual land use (Hadlich, 2006). In this way, G.I.S technology appears as a basic tool capable to consider a lot of variable that allows its combination and space distribution (Burrough & Macdonnell, 1998).
On the other hand, topographic map is a basic component used in most of environmental studies and land cover planning (Ross, 2003). From this map, crucial information are extracted and derivative maps can be elaborated. The hypsometry of a region is the first information that can be extracted, although the slope is, possibly, the most important topographical factor that restricts the land exploration (Bellinazzi Jr et al, 1991).
These two components (land cover and slope), when mismanaged, normally affect, among other environmental elements, the hydrological dynamic (soil infiltration rates into the soil, runoff rates), specially in the rain seasons (Leprun, 1993; Tucci, 1997). Hence, the land exploration (both for agricultural and urban ends) must be developed in accordance with slope of the area. In waved areas, agricultural exploration (when possible), must be delineated using soil conservation practices (tillage) and urban exploration (urban settlements) must be delineated using terracing. In very steep areas natural vegetation must be maintained intact. Considering these aspects, this paper aims to investigate the land cover patterns and the slope of Sorocaba (SP), and the relationship between land cover and slope degrees.
Environmental characteristics of study area
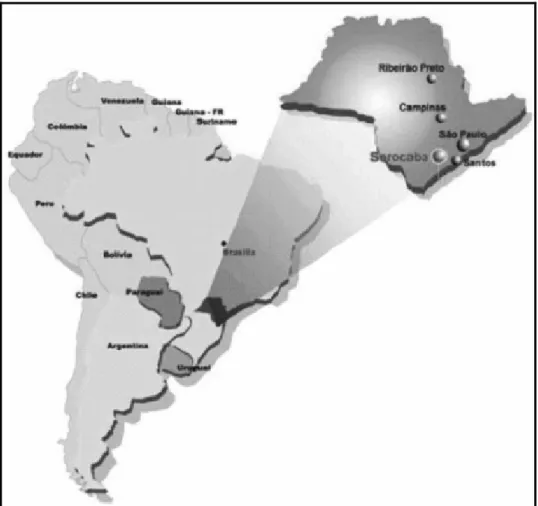
The studied local is Sorocaba city. Sorocaba is situated in the Southeastern Brazilian region (São Paulo State) (Figure 1). It encompasses a 456 km2 area and approximately 532,000 inhabitants, 98% of them living in urban settlements. It is an important socio-economic center, with almost 1,100 industries (Seade Foundation, 2006) and showing an advanced urban
Caminhos de Geografia Uberlândia v. 8, n. 22 set/2007 p. 81 - 86 Página 168 expansion.
The climate is classified as Cwa according to Koeppen’s classification system (annual average temperature is 21.4oC and annual average rainfall height is 1,285 mm). The topography of Sorocaba is considered plane in most parts of the city and waved in the others parts. In western portion, where the agriculture is more intensive, the relief is plane or smoothly waved. In eastern portion the relief is waved / strongly waved. There are two main soil classes: Alfisols and Oxisols, although Inceptisols and Entisols are also found in small proportions (Oliveira et al., 1999).
Figure 1 - Localization of the study area.
Procedures
This study was carried out using two main databases. The first one was the digital land cover map, obtained from Silva (2005) for 2003. This map was elaborated using digital satellite image (Landsat 5 – TM, multi spectral image) and the categories, as well as the percentage of occurrence of each land cover category, are presented in Table 1.
Caminhos de Geografia Uberlândia v. 8, n. 22 set/2007 p. 166 - 174 Página 169 Table 1
Percentage of each land cover class occurring in study area. Land cover categories Occurrence (%) Pastures 36.22 RNV 22.10 Cultures 11.26 Urban 18.70 Bare Soil 10.90 Water Bodies 0.82 Source: Silva (2005)
The second database was the Digital Elevation Model (DEM) of the study area (30 meters resolution, scale 1:50,000). The DEM was converted into slope map using the command Surface of the Idrisi software Kilimanjaro (Eastman, 2005) and reclassified into six relief categories according to Santos et al (2005) and Paula et al. (2006).
The next step was performing the cross-tabulation of these two factors (land cover and relief). For each one resultant category (for instance: pasture-smoothly waved) one of the five interpretation class was attributed, following Silva (2001) and Alheiros et al. (2003). Table 2 shows all possible cross-tab results and their respective classification.
Table 2
Class of attribution for each combined cell resultant of crossing of land cover and slope data. Relief classes
Land cover
classes Plane Smoothly waved Waved Strongly waved Mountai-nous Steep sloped Pastures 2 2 2 3 4 4 RNV 2 2 2 2 2 2 Cultures 2 2 2 3 3 4 Urban 2 2 5 5 4 1 Bare soil 4 4 4 4 4 1 Water 1 1 1 1 1 1 Others 1 1 1 1 1 1
Interpretation: 1 - waters bodies or not occurring; 2 - adequate cover; 3 - inadequate cover; 4 - risks; 5 - urban settlements with terracing.
Water bodies – it is represented by small lakes and rivers that occur along the study area. Adequate cover - represents all land cover categories compatible with the respective slope degree occurring on the cell of terrain.
Inadequate cover - this class represents the land cover categories that are not presenting adequacy in relation to slope of cell. On the other hand, they still are not causing hazard and would be corrected with relative facility.
Risks - it does respect to those areas where the land cover is strongly inadequate in relation the slope degree and easily might start problems (or they are started already) like soil erosion,
Caminhos de Geografia Uberlândia v. 8, n. 22 set/2007 p. 166 - 174 Página 170 landslides and/or soil loss fertility (for agricultural sites).
Urban settlements with terracing - represents the urban settlements located in waved or strongly waved relief classes. In order to avoid future problems in these areas, terracing is recommended (Alheiros et al., 2003).
Results and Discussion
Table 3 shows the percentage of occurrence of each relief class. The predominant class is “plane”, occurring in 37.80% of the study area, followed by class “waved” (32.48%), “smoothly waved” (22.32%), “strongly waved” (7.02%) and the two last classes occupy 0.38% of the study area. These values indicate a relief predominantly plane. According to Figure 2, the relief is steeper in southeastern region, where occurs the São Francisco hill and there is not urban occurrence, indicating possible fulfilling of Brazilian Environmental Law.
Table 4 presents de percentage of occurrence of each category of relationship of land cover and relief and Figure 3 shows the spatial distribution of the categories. Major part of the area presents adequate cover (almost 80%). However, approximately 11% of the study area indicates having some type of risk. The main modalities of risk that might occur are: severe erosion, flood, landslide, being all closely related to the weather conditions (Dias & Herrmann, 2001; Ross, 2003).
In some points, it was observed the occurrence of the category “inadequate cover” (3.27%). These areas are covered by pastures and cultures. Although this cover is not ideal, this situation does not represent serious environmental problems, since that it has a good soil management system.
In some points, it was observed the occurrence of the category “inadequate cover” (3.27%). These areas are covered by pastures and cultures. Although this cover is not ideal, this situation does not represent serious environmental problems, since that it has a good soil management system.
Table 3
Percentage of each slope class occurring in the study area Slope (%) Relief class % of whole area
0 – 3 Plane 37.80 3 – 8 Smoothly waved 22.32 8 – 20 Waved 32.48 20 – 45 Strongly waved 7.02 45 – 75 Mountainous 0.37 > 75 Steep sloped 0.01 Table 4
Percentage of each class of covering occurring in the study area
Class of covering % of whole area
Water bodies and not occurring 0.82
Adequate cover 78.93
Inadequate cover 3.27
Risks 10.93 Urbanization only with terracing 6.05
Caminhos de Geografia Uberlândia v. 8, n. 22 set/2007 p. 166 - 174 Página 171 Figure 2 - Slope map of study area
Figure 3 - Spatial distribution of the categories of assessment of the relationship between land cover and relief.
Caminhos de Geografia Uberlândia v. 8, n. 22 set/2007 p. 166 - 174 Página 172 In order to make easier the comprehension of the map, we elaborate another map showing the categories of assessment of the relationship of land cover and relief specifically along the urbanized areas of Sorocaba, when 98% of the total population has living (Seade, 2006). We can notice that on this part of the city occur only the categories “adequate cover” and “urban settlements with terracing”.
We also calculated the percentage of the urban area that needs to be built using terracing. The value is 32.35% and shows that an expressive part of the urbanized area, if was not built in topographically corrected places, they are under high probability to suffer any type of environmental accidents, especially in periods of strong rain, due to incompatibility of the relief for urbanization. Maybe due to this possibility, the Sorocaba city official website
(www.sorocaba.sp.gov.br) presents 11 points considered “risky areas”, among them the regions
Vila Haro, Vila Hortência, Central Parque, Brigadeiro Tobias, and others. For these areas the engineer staff of the Sorocaba Hall determines limited constructions (some kinds of industries and residential with restrictions) and with a maximum percentage of unpaved area in order to optimize the permeability of the surface.
Figure 4 - Spatial distribution of the categories of assessment of the relationship of land cover and relief that occur especially along the urbanized places of the study area.
Caminhos de Geografia Uberlândia v. 8, n. 22 set/2007 p. 166 - 174 Página 173 Conclusions
This paper evidenced, through an analysis of the relationship between the land use and slope, that the study area presents predominantly a land cover compatible with the slope of the relief. There are some places that a special attention is required. Inadequate and risk areas occur jointly in almost 15 % of the area. Since the risks areas are represented basically by bare soil situation (in rural areas), more attention is recommended in these areas in order to avoid future majors environmental problems in Sorocaba. The database here surveyed is considered relevant to contribute for regional land use planning, since this paper points risky areas and all of the forms of land use.
Acknowledgments
The authors are grateful to FAPESP by the financial support (grant 04/13.096-7) and by scholarships (grants 05/56004-8, 05/56234-3, 05/56235-0, 06/59809-0, 06/60110-0 and 04/15.796-6).
References
ALHEIROS, M. M.; SOUZA, M. A. A.; BITOUN, J.; MEDEIROS, S. M. G. & AMORIM Jr., W. M. 2003. Como gerenciar riscos nos morros. Parte “E” do manuscrito: Morros – manual de
ocupação. Prefeitura Municipal de Recife, Recife – PE.
BELLINAZZI Jr., R.; BERTOLINI, D.; ESPÍNDOLA, C. R. & LEPSCH, I. F. 1991. Manual para
levantamento utilitário do meio físico e classificação de terras no sistema de capacidade de uso.
Campinas, SP. 2a reimpressão (revisada). Soc. Bras. de Ciência do Solo. 176 p.
BURROUGH, P.A., MACDONNELL, R.A. - 1998- Principles of Geographical Information
Systems. Oxiford University Press Editor.
DIAS, F. P.; HERRMANN, M. L. P., 2001, Susceptibilidade a deslizamentos: estudo de caso no bairro Saco Grande, Florianópolis – SC. Revista de Estudos Ambientais, vol 3, número 2/3, p. 30 a 42.
EASTMAN, R. 2005. Idrisi for Windows – Kilimanjaro version. Clark University – USA – software. HADLICH, G.M.; Análise de relações entre declividade e uso do solo, com auxílio de geoprocessamento, município de Sombrio, SC. VI Simpósio nacional de Geomorfologia, Goiânia, GO, 2006.
JORGE, L.A.B., GARCIA, G.J., 1997. A study of habitat fragmentation in Southeastern Brazil using remote sensing and geographic information systems (GIS). Forest Ecology and
Management 98, 35–47.
LEPRUN, J.C. (1993). Influência da vegetação no escoamento de água em diferentes escalas nas regiões brasileiras. Anais do I º Simpósio Brasileiro de Pesquisa Florestal. Belo Horizonte. P. 280 – 298.
MARTINELLI, L.A., BALLESTER, M.V., KRUSCHE, A.V., VICTORIA, R.L., CAMARGO, P.B., BERNARDES, M., OMETTO, J.P.H.B., 1999. Land cover changes and d13 composition of riverine particulate organic matter in the Piracicaba River Basin (Southeast Region of Brazil).
Limnology and Oceanography, 44, 1826–1833.
OLIVEIRA, J.B. de, CAMARGO, M.N., ROSSI, M., CALDERANO FILHO, B. 1999. Mapa
Pedológico do Estado de São Paulo. Legenda Expandida. Campinas: Instituto Agronômico; Rio
de Janeiro: EMBRAPA – Solos, 64 p.
PAULA, F. P. et al. Estudo das formas geométricas e da declividade das encostas no município de Sorocaba como subsídio a programas regionais de manejo e conservação do solo. XVI
Caminhos de Geografia Uberlândia v. 8, n. 22 set/2007 p. 166 - 174 Página 174 ROMPAEY, A. J. J. V., GOVERS, G., HECKE, E. V., JACOBS, K., 2001. The impacts of land use policy on the soil erosion risk: a case study in central Belgium. Agriculture, Ecosystems &
Environment 83, p. 83 – 94.
ROSS, J. L. S., 2003. Geomorfologia, ambiente e planejamento. Editora Contexto, 85 p.
SANTOS, R. D.; LEMOS, R. C.; SANTOS, H. G.; KER, J. C. & ANJOS L. H. C. Manual de
Descrição e coleta de Solos no campo. 5ª edição, SBCS – Viçosa –MG, 92 p, 2005.
SEADE (Fundação Seade), 2006 (Date of consult) População e estatísticas vitais. Web site address: www.seade.sp.gov.br
SILVA, A. M. – 2001 - Conflicts of the land use / land cover with relation to slope occurring on Água Fria watershed (Palmas, Tocantins, Brazil). Revista de Estudos Ambientais, Blumenau - SC, v. 3 (1), p. 111-119.
SILVA, A.M. 2005. Cobertura do solo no município de Sorocaba-SP e implicações na fragmentação dos remanescentes florestais. Revista de Estudos Ambientais, 7 (2), 38 - 46 SMITH, W. S., 2003. Os peixes do rio Sorocaba: a história de uma bacia hidrográfica. Editora TCM, Sorocaba – SP, 160 pp.
TUCCI, C. E. M. (1997). Hidrologia- Ciência e Aplicação. Porto Alegre: Editora da Universidade (UFRGS) / Edusp/ ABRH.