Sooi Li Lee
Graduated in
Bachelor in Chemical Engineering
Role of Surfactants in Filtration and Fouling
of Colloidal Silica
Dissertation for obtaining the Master degree in Membrane Engineering
Erasmus Mundus Master in Membrane Engineering
Advisor(s): Kitty Nijmeijer, Professor, MST, University of Twente Antoine Kemperman, Senior Researcher, MST, University of Twente
Jury:
President: João Crespo, Professor, FCT-UNL
Member(s): Damien Quémener, Associate Professor, Université Montpellier 2
Vlastimil Fila, Associate Professor, Institute of Chemical Technology Prague
Svetlozar Velizarov, Researcher, FCT-UNL
Sooi Li Lee
Graduated in
Role of Surfactants in Filtration and Fouling
of Colloidal Silica
Dissertation presented to Faculdade de Ciências e Tecnologia, Universidade Nova de Lisboa for obtaining the master degree in Membrane Engineering
TITLE: Role of Surfactants in Filtration and Fouling of Colloidal Silica
The EM3E Master is an Education Programme supported by the European Commission, the European Membrane Society (EMS), the European Membrane House (EMH), and a large international network of industrial companies, research centres and universities (http://www.em3e.eu).
Copyright @ S.L Lee, FCT/UNL
A Faculdade de Ciências e Tecnologia e a Universidade Nova de Lisboa têm o direito, perpétuo e sem limites geográficos, de arquivar e publicar esta dissertação através de exemplares impressos reproduzidos em papel ou de forma digital, ou por qualquer outro meio conhecido ou que venha a ser inventado, e de a divulgar através de repositórios científicos e de admitir a sua cópia e distribuição com objectivos educacionais ou de investigação, não comerciais, desde que seja dado crédito ao autor e editor.
Acknowledgements
“Science does not know its debt to imagination.”
Ralph Waldo Emerson
First and foremost, I would like to thank my family, without their support, encouragement and understanding, I will not be where I am nor who I am today. Plus it was always a fantastic reason to visit your daughter/sister… In Europe.
To my supervisors, Dr. Ir. Antoine Kemperman and Prof. Dr.Ir. Kitty Nijmeijer, thank you for the opportunity to undertake my thesis in MST. I am grateful for all your motivation, professionalism and much-appreciated feedback.
Krzysztof, it was a pleasure to work with and for(!) you. Could not have asked for a better daily supervisor, and I deeply appreciate all your help and constructive feedback in the duration of my whole thesis. I hope OSMO will behave itself in the future.
The contributions of Dr. Ir. Wiebe de Vos and Joris de Grooth in the form of discussions and suggestions are also recognised.
The MST crew for making my stay in UT and Enschede a great one. I thank you for your friendship and I think my experience would not be this memorable otherwise. Also, I think I may have consumed enough cakes and treats in the last 5 months for the next year. Also a special thanks to my fellow EM3E 2nd Edition mates for your camaraderie and for being there. Two years have come and gone. Time flies when you are having fun.
I thank EM3E program coordinators, Prof.
André Ayral, Prof. Isabel Coelho, Prof. João Crespo
and Dr Elena Vallejo for their support and continuous guidance they offered during the
masters program.
The financial support received from the European Union in the form of scholarship
Abstract
The objective of this study is to investigate the influence of three different types of surfactants (i) anionic sodium dodecyl sulphate (SDS), (ii) cationic (hexadecyltrimethylammonium bromide (CTAB), and (iii) non-ionic: Triton X-100 (Polyethylene glycol tert-octylphenyl ether) and the effect of surfactant concentration on ultrafiltration of colloidal silica nanoparticles. Due to the high surface area to volume ratio of nanoparticles, the role of surface interactions on the stability of silica suspensions is enhanced. The effects of adsorption of surfactants are studied by means of static light scattering and zeta potential measurements. The strongest particle-surfactant interaction is observed between oppositely charged CTAB with silica, followed by TX-100 and SDS.
An ultrafiltration hollow-fibre membrane is used in a semi-dead end configuration to perform filtration of silica suspension with varying surfactant concentration to critical micelle concentration (CMC) ratio, csurfactant/ccmc in a flux-step mode. The effect of surfactants and process conditions (flux) on filtration process have been compared by evaluating the critical flux and total fouling rate. The occurrence of critical flux and evolution of fouling rates are also strongly affected by the surfactant concentration. This difference in filtration performance is attributed to various competing and complementary mechanisms: electrostatic and hydrophobic interactions between surfactant-membrane surface, electrostatic and hydrophobic interactions between particles as well as the hydrodynamic effect of fluid motion towards the membrane. A comparison of the overall fouling potential for surfactant-silica systems showed that SDS-silica systems showed fouling rates of an order of magnitude higher than those of CTAB-silica and TX100-silica systems at the same csurf/cCMC ratio. This was an unexpected finding, as we would expect stable colloidal systems such as SDS-silica systems would exhibit lower fouling than unstable colloidal systems (e.g. CTAB-silica systems).
Index of Figures
FIGURE 2-1: SCHEMATIC REPRESENTATION OF THE TYPES OF FUNCTIONAL GROUPS THAT OCCUR ON THE SILICA SURFACE (A) HYDRATED AND (B)
ANYHYDROUS SILANOL GROUPS ARE ASSOCIATED WITH THE HYDROXYLATED SURFACE, WHEREAS (C) SILOXANE-DEHYDRATED GROUPS OCCUR MAINLY ON THE PYROGENIC SURFACE [5]. ... 12
FIGURE 2-2: INTERACTION ENERGY BETWEEN TWO SILICA NANOPARTICLES
(HAMAKER CONSTANT: 0.8·10-20 J [13], PARTICLE DIAMETER: 22 NM)
CALCULATED ACCORDING TO DLVO THEORY; (A) INFLUENCE OF THE SURFACE CHARGE IN 1 MM NACL SOLUTION; (B) INFLUENCE OF THE NACL
CONCENTRATION FOR THE NANOPARTICLE SURFACE CHARGE OF -30 MV; (C) INFLUENCE OF THE CATION VALENCY FOR THE NANOPARTICLE SURFACE CHARGE OF -30 MV. ... 14
FIGURE 2-3: CARTOONS DISPLAYING DIFFERENT MORPHOLOGIES THAT MAY FORM
DURING THE ADSORPTION OF A SOLUBLE SURFACTANT TO A CLEAN HYDROPHILIC SUBSTRATE (1D). AT VERY LOW COVERAGE, THE HYDROCARBON CHAINS OF THE ADSORBED SURFACTANT MAY BE LIE
PERPENDICULAR TO THE SURFACE (1A), PARALLEL TO THE SURFACE (1B), OR BE RANDOMLY ORIENTED (1C). AS THE COVERAGE INCREASES, THE
MOLECULES MAY BE RANDOMLY DISTRIBUTED IN A SINGLE LAYER (LANGMUIR BEHAVIOR, 2C) OR INTERACTIONS BETWEEN SURFACTANT MOLECULES MAY LEAD TO THE FORMATION OF HEMIMICELLES (2A) OR ADMICELLES (2B). AT HIGH COVERAGES, A RANGE OF STRUCTURES ARE CONCEIVABLE:
MONOLAYER (3A), HEMIMICELLES ON A MONOLAYER (3B), BILAYER (3C) OR ADMICELLES (3D) [14] ... 16
FIGURE 2-4: GENERAL SHAPE OF ADSORPTION ISOTHERM AND PROPOSED
MOLECULAR MODEL FOR TWO-STEP AND FOUR-REGION ADSORPTION
MODELS [21, 23]. ... 17
FIGURE 2-5: ADSORPTION ISOTHERM OF CTAB ON SIO2 AS REPORTED BY TYRODE
ET AL [14] ... 18
FIGURE 2-6: ADSORPTION OF SDS ONTO SILICA AND SILICA PRETREATED WITH
POLYETHYLENE OXIDE AT ROOM TEMPERATURE (23 ± 2°C) AND NEUTRAL PH (6.5 TO 7) [31] ... 19
FIGURE 2-7: ADSORPTION ISOTHERMS OF TX100 ON SYTON W30 AND LUDOX HS40
AT PH 6 [42] ... 20
FIGURE 2-8: ADSORPTION ISOTHERMS OF TRITON X-100 ON SYTON W30 AT
VARIOUS PH [42]. ... 20
FIGURE 2-9: CTAB STRUCTURE: CATIONIC HEAD AND HYDROPHOBIC TAIL. ... 21
FIGURE 2-10: SIMPLIFIED SCHEME OF CTAB ‘TAIL TO TAIL’ BILAYER AND
MULTILAYER FORMATION ON SIO2-WATER INTERFACE [50]. ... 22
FIGURE 2-11: POSSIBLE SIMPLIFIED SCHEME OF CTAB-SIO2-WATER INTERFACE AS
PROPOSED BY LIU AND CO-WORKERS [44]. COUNTERIONS BR- ARE OMITTED FOR CLARITY. ... 23
FIGURE 2-12: STRUCTURE OF SDS: ANIONIC HEAD AND HYDROPHOBIC TAIL. ... 23
FIGURE 2-13: STRUCTURE OF NON-IONIC SURFACTANT TRITON X-100. ... 24
FIGURE 2-14: SCHEMATIC OF THE FORCES THAT ARE INVOLVED IN A DEAD END
FIGURE 3-1: (A) TOP VIEW OF THE PRINCIPLE OF LIGHT SCATTERING SET-UP. L: LIGHT SOURCE; 1: FILTERS, LENSES; 2: SAMPLE CELL; 3: MOBILE DETECTOR. (B) DEFINITION OF SCATTERING VOLUME VS IN A CROSS-SECTION OF THE INCOMING BEAM AND DETECTION BEAM [74]. ... 32
FIGURE 3-2: AN EXAMPLE OF A FILTRATION MODULE AND A SCHEMATIC
DESCRIBING THE MODULE OPERATING IN A SEMI DEAD-END CONFIGURATION. ... 34
FIGURE 3-3: SCHEMATIC REPRESENTATION OF PERMPOROMETER SETUP [77]. ... 35
FIGURE 3-4: FLOWSHEET OF THE OSMO FILTRATION SETUP. BW AND FEED ARE
BACKWASH WATER AND FEED WATER TANKS RESPECTIVELY. THE FLOWS ARE CONTROLLED BY TWO MASS FLOW CONTROLLERS (F). PRESSURE (P) IS
MEASURED IN THE FEED, BACKWASH, PERMEATE AND RETENTATE. TEMPERATURE IS MONITORED IN THE FEED AND DOWNSTREAM OF THE
BACKWASH PUMP. ... 37
FIGURE 3-5: PICTURE OF THE OSMO INSPECTOR FILTRATION SETUP. ... 37
FIGURE 3-6: LAYOUT OF ONE FILTRATION-BACKWASH CYCLE (ADAPTED FROM VAN
DE VEN [80]). ... 39
FIGURE 3-7: TMP-FLUX PROFILE OF A FLUX STEP FILTRATION EXPERIMENT
(ADAPTED FROM VAN DE MAREL [64]). ... 40
FIGURE 3-8: SCHEMATIC REPRESENTATION OF THE FLUX-STEP PROTOCOL AS
DEVELOPED BY VAN DER MAREL ET AL [64]. ... 40
FIGURE 4-1: PORE SIZE DISTRIBUTION OF THE INVESTIGATED UF PES-PVP HOLLOW
FIBRE MEMBRANE BASED ON PERMPOROMETRY MEASUREMENTS. ... 42
FIGURE 4-2: SEM IMAGES OF THE UF PES-PVP HOLLOW-FIBRE MEMBRANE (A)
SHELL SURFACE AND (B-D) CROSS-SECTION AT THE SHELL SIDE OF THE NATIVE MEMBRANE AT VARIOUS MAGNIFICATIONS. ... 43
FIGURE 4-3: ZETA POTENTIAL AT INNER SURFACE OF THE INVESTIGATED UF
PES-PVP UF HOLLOW FIBRE MEMBRANE AS A FUNCTION OF PH. ... 43
FIGURE 4-4: ZETA POTENTIAL OF CTAB-SILICA, TX100- SILICA AND SDS- SILICA AND
THE PURE SURFACTANTS (SINGLE POINTS) AS A FUNCTION OF SURFACTANT CONCENTRATION VERSUS CMC AT PH 8. ... 44
FIGURE 4-5: RAYLEIGH NUMBERS FOR CTAB-SILICA, TX-100-SILICA AND SDS-SILICA
SYSTEMS AS A FUNCTION OF SURFACTANT CONCENTRATION VERSUS CMC AT PH 8. OPEN SYMBOLS DENOTE MEASUREMENTS AFTER 1 HOUR AND CLOSED SYMBOLS DENOTE MEASUREMENTS AFTER 24 HOURS. ... 45
FIGURE 4-6: TOTAL FOULING RATE AND CRITICAL FOULING RATE FOR A FILTRATION
OF 50 MG/L LUDOX TM-50 SIO2 AT PH 8. OPEN SYMBOLS AND CLOSED
SYMBOLS DENOTE FOULING RATES IN ASCENDING PHASE AND DESCENDING PHASE, RESPECTIVELY. ... 48
FIGURE 4-7: PROFILE OF FOULING RATES FOR SDS-SIO2 SYSTEMS AT VARIOUS
SURFACTANT CONCENTRATIONS AT PH 8 AND 30°C. OPEN SYMBOLS AND CLOSED SYMBOLS DENOTE FOULING RATES IN ASCENDING PHASE AND
DESCENDING PHASE, RESPECTIVELY. ... 51
FIGURE 4-8: PROFILE OF FOULING RATES FOR CTAB-SIO2 SYSTEMS AT VARIOUS
SURFACTANT CONCENTRATIONS AT PH 8 AND 30°C. OPEN SYMBOLS AND CLOSED SYMBOLS DENOTE FOULING RATES IN ASCENDING PHASE AND
DESCENDING PHASE, RESPECTIVELY. ... 55
FIGURE 4-9: PROFILE OF FOULING RATES FOR TX100-SIO2 SYSTEMS AT VARIOUS
SURFACTANT CONCENTRATIONS AT PH 8 AND 30°C. OPEN SYMBOLS AND CLOSED SYMBOLS DENOTE FOULING RATES IN ASCENDING PHASE AND
FIGURE 4-10: SILICA REJECTION FOR FILTRATION OF SDS-SIO2 SYSTEMS AT PH 8 AND 30°C (CMC SDS: 8 MM). OPEN SYMBOLS AND CLOSED SYMBOLS DENOTE FOULING RATES IN ASCENDING PHASE AND DESCENDING PHASE,
RESPECTIVELY. ... 61
FIGURE 4-11: SILICA REJECTION FOR FILTRATION OF CTAB-SIO2 SYSTEMS AT PH 8
AND 30°C (CMC CTAB: 0.92 MM). OPEN SYMBOLS AND CLOSED SYMBOLS DENOTE FOULING RATES IN ASCENDING PHASE AND DESCENDING PHASE, RESPECTIVELY. ... 62
FIGURE 4-12: SILICA REJECTION FOR FILTRATION OF TX100-SIO2 SYSTEMS AT PH 8
AND 30°C. (CMC TX100: 0.24 MM). OPEN SYMBOLS AND CLOSED SYMBOLS DENOTE FOULING RATES IN ASCENDING PHASE AND DESCENDING PHASE, RESPECTIVELY. ... 62
FIGURE 4-13: SEM IMAGES- (A) CROSS-SECTION AND (B) SURFACE IMAGES OF UF
PES-PVP MEMBRANE AFTER FILTRATION OF SDS-SILICA SOLUTION, AND WAS OBSERVED FOR ALL MEMBRANES AFTER FILTRATION. ... 63
FIGURE 4-14: PERMEABILITY RECOVERY (PR) FOR SDS-SIO2 SYSTEMS AT VARIOUS
SURFACTANT CONCENTRATIONS. OPEN SYMBOLS AND CLOSED SYMBOLS DENOTE FOULING RATES IN ASCENDING PHASE AND DESCENDING PHASE, RESPECTIVELY. ... 65
FIGURE 4-15: PERMEABILITY RECOVERY (PR) FOR CTAB-SIO2 SYSTEMS AT VARIOUS
SURFACTANT CONCENTRATIONS. OPEN SYMBOLS AND CLOSED SYMBOLS DENOTE FOULING RATES IN ASCENDING PHASE AND DESCENDING PHASE, RESPECTIVELY. ... 66
FIGURE 4-16: PERMEABILITY RECOVERY (PR) FOR TX100-SIO2 SYSTEMS AT
VARIOUS SURFACTANT CONCENTRATIONS. OPEN SYMBOLS AND CLOSED SYMBOLS DENOTE FOULING RATES IN ASCENDING PHASE AND DESCENDING PHASE, RESPECTIVELY. ... 67
FIGURE B-1: FLUX AND TRANSMEMBRANE PRESSURE PROFILE FOR A COMPLETE
FILTRATION EXPERIMENT. THE OPEN TRIANGLE SYMBOLS DENOTE FLUX, WHILE THE FULL CIRCLE SYMBOLS DENOTE THE TRANSMEMBRANE
PRESSURE. ... 77
FIGURE B-1: EFFECT OF CONCENTRATION ON SDS REJECTION IN FILTRATION OF
SDS-SILICA SYSTEMS. OPEN SYMBOLS AND CLOSED SYMBOLS DENOTE FOULING RATES IN ASCENDING PHASE AND DESCENDING PHASE,
RESPECTIVELY. ... 78
FIGURE B-2: EFFECT OF CONCENTRATION ON CTAB REJECTION IN FILTRATION OF
CTAB-SILICA SYSTEMS. OPEN SYMBOLS AND CLOSED SYMBOLS DENOTE FOULING RATES IN ASCENDING PHASE AND DESCENDING PHASE,
RESPECTIVELY. ... 79
FIGURE B-3: EFFECT OF CONCENTRATION ON TX100 REJECTION IN FILTRATION OF
TX100-SILICA SYSTEMS. OPEN SYMBOLS AND CLOSED SYMBOLS DENOTE FOULING RATES IN ASCENDING PHASE AND DESCENDING PHASE,
Index of Tables
TABLE 1: CHARACTERISTICS OF SURFACTANTS STUDIED. ... 26
TABLE 2: FILTRATION FEED SOLUTIONS AT PH 8 AND 30°C ... 31
TABLE 3: SILICA-SURFACTANT SUSPENSIONS FOR STATIC LIGHT SCATTERING AND
Abbreviations
Cp permeate concentration (mg/L) Cf feed concentration (mg/L)
CAC critical association concentration (mM) CMC critical micelle concentration (mM) CTAB hexadecyltrimethylammonium bromide Ftotal total fouling rate (m-1s-1)
Fcrit critical fouling rate (m -1
s-1)
ICP-MS inductively coupled plasma mass spectrometry IEP isoelectric point
Jcrit critical flux
MWCO molecular weight cut-off (kDa) NP nanoparticle
PES-PVP polyethersulfone-polyvinylpyrrolidone PR permeability recovery (-)
PVP polyvinylpyrrolidone R rejection (%)
SANS small-angle neutron scattering SiO2 silica
SDS sodium dodecyl sulphate TMP transmembrane pressure TOC total organic carbon (mg/L)
Table of Contents
Acknowledgements
... i
Abstract
... ii
Index of Figures
... iii
Index of Tables
... vi
Abbreviations
... vii
1.
INTRODUCTION
... 10
2.
THEORY
... 12
2.1
Surface Chemistry of Silica Nanoparticles
... 12
2.2
DLVO Theory and Stabilization Mechanism
... 13
2.3
Equilibrium Surfactant Adsorption on Silica Surface
... 14
2.3.1
Equilibrium Adsorption of Ionic Surfactants onto Silica ... 16
2.3.2
Equilibrium Adsorption of Non-Ionic Surfactants onto Silica ... 19
2.3.3
Effect of CTAB on System Stability ... 21
2.3.4
Effect of SDS on System Stability ... 23
2.3.5
Effect of TX100 on System Stability ... 24
2.4
Colloidal Fouling & Concept of Critical Flux
... 27
3.
EXPERIMENTAL
... 30
3.1
Feed Solutions
... 30
3.2
Membranes
... 34
3.3
Flux-Step Experiments
... 36
3.3.1
Analysis of the Result ... 39
4.
RESULTS AND DISCUSSION
... 42
4.1
Membrane Characterisation
... 42
4.2
Particle Characterisation and Surface Modification
... 44
4.3
Filtration Experiments - Flux-Step Method
... 47
4.3.1
Fouling Development and Critical Flux ... 47
4.4
Influence of Surfactants on Fouling Rate
... 50
4.4.1
Influence of SDS on Colloidal Fouling Rate ... 50
4.4.2
Influence of CTAB on Colloidal Fouling Rate ... 54
4.4.3
Influence of TX100 on Colloidal Fouling Rate ... 58
4.5
Influence of Surfactant on Membrane Separation Properties
... 61
4.5.1
Influence of Surfactants on Silica Rejection ... 61
4.5.2
Influence of Concentration on Surfactant Rejection ... 63
4.6
Influence of Surfactant on Pure Water Permeability
... 64
4.6.1
Influence of SDS on Permeability Recovery of UF Membranes ... 64
4.6.2
Influence of CTAB on Permeability Recovery of UF Membranes ... 66
4.6.3
Influence of TX100 on Permeability Recovery of UF Membranes ... 67
5.
CONCLUSIONS
... 69
6.
RECOMMENDATIONS & FUTURE WORK
... 71
Appendix A:
Flux and Transmembrane Pressure for a Complete
Filtration Experiment
... 77
1.
INTRODUCTION
The rapid growth of nanotechnology has resulted in various implementations of nanomaterials in products or as process enhancers in manufacturing. Nanoparticles (NPs) may be classified via already known properties, the easiest being their chemical composition. Three main categories are usually distinguished [1]: i) pure metallic nanoparticles (e.g. Fe, Ag, Au,), (ii) metallic oxides or oxy-hydroxides (e.g. SiO2, TiO2), (iii) carbonaceous nanoparticles (e.g. nanotubes, fullerenes). Among them, SiO2 and TiO2 nanoparticles are already produced in very large quantities (102–103 tonnes/year) [1]. Although research on the impact of NPs on living organisms is still comparatively lesser compared to their wide range of applications, most researchers suggest that NPs are toxic. Furthermore, as a result of the increasing production and application, it is inevitable that the manufactured NPs will accumulate in the aqueous environment after usage. Therefore, there is a need to develop environmentally friendly technologies to remove NPs from potential drinking water sources in parallel with a sustainable growth of nanotechnology.
Over the last few decades, membrane technology has emerged as one of the most promising and reliable techniques in water purification, and has been proven to be effective in the removal of colloidal particles such as proteins, natural organic matter (NOM) and inorganic particles [2]. However, to date, the widespread usage of membrane technology is still limited by the fouling phenomenon. Furthermore, not much is known on the filtration and fouling behaviour of engineered NPs.
In membrane filtration, the role of surface interactions between foulants and membranes is
indisputable. If a feed solution contains surface-active compounds, like stabilizers used for
stabilization of the NP suspensions, its filtration behavior can significantly differ from the
filtration process carried out without the presence of the surfactant. The type of surfactant
determines the aggregation rate of the nanoparticles on the membrane surface by altering the
interactions between particles. Process conditions like membrane type, pressure or
temperature may also significantly change filtration behavior of the nanoparticles promoting
aggregation near membrane surface.
2.
THEORY
2.1
Surface Chemistry of Silica Nanoparticles
To understand the behaviour of colloidal fouling in membrane filtration, it is imperative to understand the surface chemistry of silica nanoparticles, and how this interaction changes when different surfactants are added to the silica suspension as an additive.
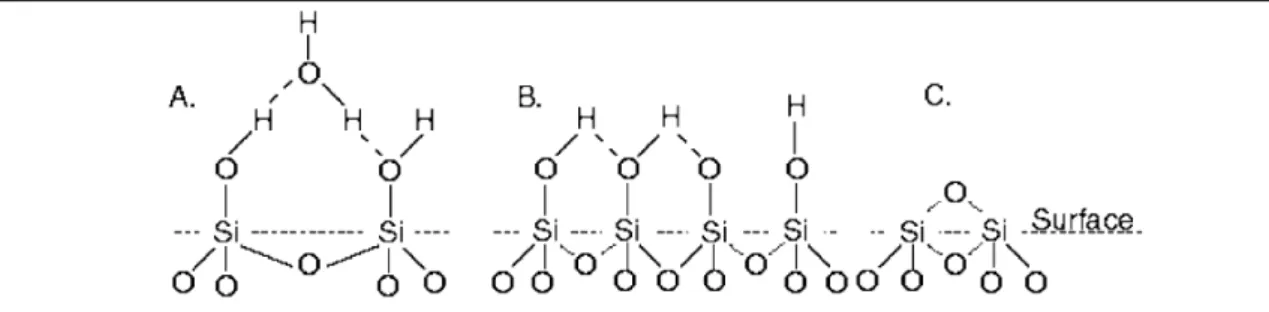
Bulk SiO2 consists of a siloxane unit joined together in a tetrahedral lattice. Depending on the preparation of the surface and the nature of the solution, several different functional groups can be present at the surface [4]. Functional groups commonly associated with the SiO2 surface are depicted schematically in Figure 2-1.
Figure 2-1: Schematic representation of the types of functional groups that occur on the silica surface (A) hydrated and (B) anyhydrous silanol groups are associated with the hydroxylated surface, whereas (C) siloxane-dehydrated groups occur mainly on the pyrogenic surface [5].
Like other mineral oxide surfaces, the surface charge character of SiO2 is defined by the relative concentrations of H+ and OH- in solution, as shown by the following equations:
SiOH + H+
!!
SiOH2 +
Equation 1
SiOH + OH-
!!
SiO- + H2O Equation 2
When analysing the SiO2 surface charge, the structure of the oxide layer must be accounted for. Hydroxylated SiO2 has a high density of hydroxyl groups with about ~4.5 OH nm
-2 [5, 6] that are in close proximity of one another, leading to hydrogen bonding between the hydrogen of one hydroxyl group and oxygen of a neighbouring group (see Figure 2-1b). These hydroxyl hydrogen atoms are strongly bound at normal pH levels, resulting in the hydroxylated SiO2 having low surface charge. Pyrogenic SiO2, which is typically prepared by baking silicon wafers at high temperature in an oxygen atmosphere for a controlled amount of time, however has a lower density of hydroxyl groups of about ~0.7 OH nm-2 [5, 6] and a higher net charge than hydroxylated SiO2. Indeed the presence of numerous siloxane-dehydrated groups as depicted in Figure 2-1c, will render the pyrogenic surface partially hydrophobic.
An aqueous nanoparticle dispersion is defined to be stable when the number of particles in a unit of time is constant with respect to time [8]. The stability of SiO2 dispersions depends on the structure of SiO2 surfaces and associated water molecules that define the characteristics of the near surface region. As discussed above, the hydrophilic silanol groups on the SiO2 surface act as binding sites (H bonds) for water. The protonation and deprotonation of these silanol groups determine the surface charge of SiO2 nanoparticles and the extent of the repulsive energy to keep them dispersed in solution [9].
Previous studies have also investigated the effects of pH, temperature and electrolytes on the stability of SiO2 NP dispersions [10]. Metin et al [10] systematically investigated the stability of SiO2 dispersion over a wide pH range of 2.5 to 10, whereby they observed a significant variation of SiO2 nanoparticle surface structure. Also, they reported that the zeta potential of the SiO2 NPs were around -45 mV as pH decreases from 10 to 6, but increased sharply with further decrease in pH. Nevertheless, they observed only a 1.36 factor increase in the effective particle diameter despite the significant pH decrease from 10 to 2, whereby they attributed the difference in particle size to the thickness and strength of the water bound layer to the SiO2 particle [10].
2.2
DLVO Theory and Stabilization Mechanism
electrostatic repulsion which is a consequence of interaction of the electrical double layer surrounding the particles [11].
In a membrane filtration process of colloidal systems, the deposition of nanoparticles on the membrane surface, which ultimately leads to membrane fouling can be described by colloidal stability theory. The classic Derjaguin-Landau-Verwey-Overbeek (DLVO) theory is the most simple and common theory to estimate colloidal stability, by combining the van der Waals attraction and electrical double layer repulsion between individual particles.
The role of pH, salt concentration and salt type on stability of the 22 nm silica nanoparticles is shown in Figure 2-
2. This figure shows the relationship between total dimensionless
interaction energy vs. distance between nanoparticles, proposed by Aimar et al [12]. In simple terms, stable colloidal suspensions typically have total dimensionless interaction energy higher than 10-15 kT [12]. These suspensions are stable and would not aggregate without reduction of the interaction energy in any conditions. For suspensions with interaction energy smaller than 3kT, the systems are unstable and particles will rapidly aggregate. For suspensions with total dimensionless interaction energy between 3 kT and 15 kT, they are semi-stable, as such their aggregation rate is strongly time and concentration dependent [12].
Figure 2-2: Interaction energy between two silica nanoparticles (Hamaker constant: 0.8·10-20
J [13], particle diameter: 22 nm) calculated according to DLVO theory; (a) influence of the surface charge in 1 mM NaCl solution; (b) influence of the NaCl concentration for the
nanoparticle surface charge of -30 mV; (c) influence of the cation valency for the nanoparticle surface charge of -30 mV.
2.3
Equilibrium Surfactant Adsorption on Silica Surface
The presence of surfactants is known to modify the surface chemistry of colloidal NPs by adsorbing on the surface of the NP. As such it is essential to recognise the different mechanisms and effect of adsorption of the various types of surfactant (e.g. anionic, cationic and non-ionic) on the substrate of interest. Indeed, the adsorption of surfactants onto hydrophilic surfaces such as SiO2 from aqueous solutions has been studied rather extensively over the last few decades [4, 14-17] particularly as this model hydrophilic surface has been well characterised.
-20 0 20 40 60 80 100 -10 0 10 20 30 ZP=-20 mV ZP=-30 mV Ener gy b ar rier [kT ]
Separation distance [nm] ZP = -40 mV
-20 0 20 40 60 80 100 -10
0 10 20
50 mM NaCl 10 mM NaCl
1 mM NaCl
Ener gy b ar rier [kT ]
Separation distance [nm]
-20 0 20 40 60 80 100 -10
0 10 20
10 mM CaCl2 10 mM NaCl
Ener gy b ar irier [kT ]
Adsorption isotherms are traditionally determined by solution depletion methods [4, 15, 16], where they are accomplished by mixing a surfactant solution with a given mass of adsorbate (i.e. SiO2) of known surface area. At equilibrium, the surface excess is determined by the change in the bulk solution surfactant concentration. Adsorption can be considered as a partitioning of the adsorbate species between the interface and the bulk, and will occur if the interface is energetically favoured by the surfactant in comparison to the bulk solution. Γδ,
(kmol/m2) the adsorption density in the Stern plane, δ can be written as follows [18]:
Γ! =𝑙𝐶 𝑒𝑥𝑝
!∆!
!"#
!
!" Equation 3
Where l is the effective length of the chain (m), C is the bulk concentration of the surfactant
(kmol/m3), R is the gas constant (JK-1mol-1), T is the absolute temperature (K) and −∆𝐺!"#!
is the standard free energy of adsorption (J) [18]. The driving forces for adsorption is the sum of a number of contributing forces, whereby the major forces involved in surfactant adsorption are written as follows [19]:
−∆𝐺!"#! = ∆𝐺!"!# ! + ∆𝐺!!!!"+∆𝐺!
!!
! +
∆𝐺!
!!
! +
∆𝐺
!
!
+∆𝐺
!!!
!
Equation 4
where ∆𝐺!"!# ! (J) is the electrostatic interaction term, ∆𝐺!!!!" (J) the chemical term due to covalent bonding, ∆𝐺!
!!
!
(J) the free energy gained upon association of methyl groups in the hydrocarbon chain, ∆𝐺!
!!
!
(J) the free energy due to interactions between the hydrocarbon chains and hydrophobic sites on the solid, ∆𝐺
!
!
(J) the hydrogen bonding term and ∆𝐺
!!!
!
(J) is the term owing to dissolution or solvation of the adsorbate species or any species displaced from the interface due to adsorption.
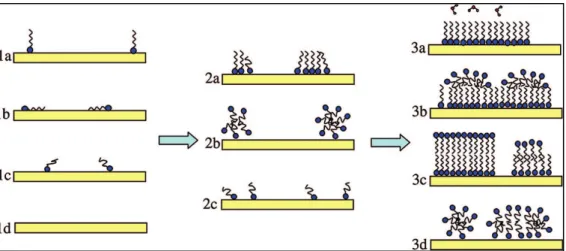
The second limiting case is the self-assembled monolayer (SAM) limit. In this limit, the interaction between the headgroup and the surface, together with the van der Waals interactions between closely packed chains, is sufficiently strong to create monolayer formation at concentrations orders of magnitude below the CMC [14]. At dilute concentrations, a second layer does not form because elimination of water-hydrocarbon contacts does not compensate for the loss of transitional entropy upon adsorption. As the surfactant concentration increases further, isolated molecules adsorb to the hydrophobic surface thus gradually increasing the surface coverage until it approaches a bilayer at CMC. This bilayer may be asymmetric, given the different nature of interactions in the two layers, as schematically shown in Figure 2-3.
Figure 2-3: Cartoons displaying different morphologies that may form during the adsorption of a soluble surfactant to a clean hydrophilic substrate (1d). At very low coverage, the
hydrocarbon chains of the adsorbed surfactant may be lie perpendicular to the surface (1a), parallel to the surface (1b), or be randomly oriented (1c). As the coverage increases, the molecules may be randomly distributed in a single layer (Langmuir behavior, 2c) or
interactions between surfactant molecules may lead to the formation of hemimicelles (2a) or admicelles (2b). At high coverages, a range of structures are conceivable: monolayer (3a), hemimicelles on a monolayer (3b), bilayer (3c) or admicelles (3d) [14]
2.3.1 Equilibrium Adsorption of Ionic Surfactants onto Silica
models). The difference between these two models lies in the relative importance of electrostatic and hydrophobic interactions at intermediate concentrations. In the two-step model, there is only low coverage of isolated molecules bound electrostatically to the substrate, which nucleate the formation of admicelles in the steeply rising part of the isotherm. In the four-region model, there is stronger adsorption at lower concentrations leading to the formation of hemimicelles before the attachment of a second layer through hydrophobic interactions [14].
Figure 2-4: General shape of adsorption isotherm and proposed molecular model for two-step and four-region adsorption models [21, 23].
Figure 2-5: Adsorption isotherm of CTAB on SiO2 as reported by Tyrode et al [14]
SDS, as an anionic surfactant, is not readily adsorbed onto negatively charged colloidal surface due to electrostatic repulsion [31, 32]. On the contrary, other groups have reported that SDS does adsorb onto negatively charged silica surfaces. Litton and co-workers [33, 34] attributed the adsorption of small amount of SDS on silica surfaces due to heterogeneities. Ahualli et. al [35] studied the adsorption of SDS on silica nanoparticles using small angle x-ray scattering (SAXS) and dynamic light scattering (DLS). They observed adsorption of SDS on the silica NP surface which resulted in a supercharging effect at the SDS-silica interface [35]. The hydroxyl groups on silica surface are not alike and can have different dissociation constants [36] thus causing non-uniformities on the surface. Nonetheless, anionic SDS can be made to adsorb at higher specific concentrations onto silica in the presence of pre-adsorbed polyethylene oxide (PEO) onto the surface [31, 37]). Maltesh et al [31] reported the adsorption isotherm of SDS onto silica in the presence of PEO with two different molecular weights at room temperature (23 ± 2°C) and neutral pH (6.5 to 7) as illustrated in Figure 2-6, and it can be observed that SDS adsorbed onto silica to a considerable extent regardless of polymer molecular weight.
Figure 2-6: Adsorption of SDS onto silica and silica pretreated with polyethylene oxide at room temperature (23 ± 2°C) and neutral pH (6.5 to 7) [31]
2.3.2 Equilibrium Adsorption of Non-Ionic Surfactants onto Silica
The adsorption of non-ionic surfactants on solid-liquid interface has not been studied as extensively as the ionic surfactants. Generally the adsorption isotherms of non-ionic surfactants follow the Langmuir isotherm [38]. Non-ionic surfactants are physically adsorbed rather than electrostatically or chemisorbed. However, non-ionic surfactants differ from ionic surfactants in that, small changes in concentration, temperature or molecular structure of the adsorbent may induce a large effect on the adsorption. This is due to adsorbate-adsorbate and adsorbate-solvent interaction, which causes surfactant aggregation in bulk solution, thus leading to change in orientation and packing of surfactant at the surface [39].
Figure 2-7: Adsorption isotherms of TX100 on Syton W30 and Ludox HS40 at pH 6 [42]
The adsorption of TX100 on silica surface is also highly dependent on the pH of the solution, as presented in Figure 2-8 [42]. Generally, the isotherms exhibit three characteristic regions: a slow increase of the adsorption at low equilibrium concentrations, a drastic rise in the adsorption at TX100 concentration of ~ 0.5 CMC and a plateau at concentration > CMC. However, as the pH increases, the surface charge increases thus decreasing the amount of undissociated silanol groups which are adsorbing sites for TX100 [42]. Nevertheless the same study also showed that the enthalpies of displacement (reported for two different pH values) was only dependent on the surface concentration of TX100, indicating that the main driving force of adsorption is due to the aggregation process, as expected in a “weakly bound adsorbate-adsorbent system”.
2.3.3 Effect of CTAB on System Stability
Properties of CTAB
Hexacetyltrimethylammonium bromide (CTAB) is a cationic surfactant, which is comprised of a cationic head and a hydrophobic tail, as depicted in Figure 2-9:
Figure 2-9: CTAB structure: cationic head and hydrophobic tail.
Due to the amphiphilic nature of surfactants, they are able to self-assemble into organised molecular assemblies or micelles. The concentration (actually an arbitrary concentration within a narrow range) above which micelles are formed is called the critical micelle concentration (CMC). Above the CMC, monomers and micelles exist in a dynamic equilibrium [43]. The CMC of CTAB has been reported to be 0.92 ± 0.05 mM [44] at 25oC while Modaressi et al.[45] have cited 0.89 mM, Gao et al [46] with 0.92 mM, and Maiti et al [47] have given 0.8 mM at the same temperatures. CTAB is easily dissociated into cationic CTA+ and bromide ion (Br -) and its speciation is not influenced by pH changes [48]. However, the Krafft temperature or critical micelle temperature of CTAB, which is the minimum point below which it remains in crystalline form is about 25oC [49].
Effect of CTAB on Particle-Particle Surface Interaction
Figure 2-10: Simplified scheme of CTAB ‘tail to tail’ bilayer and multilayer formation on SiO2-water interface [50].
In a recent study by Liu et al [44], they proposed the following interactions between SiO2 NPs and CTAB as follows: initially small quantities of CTAB would form a monolayer on the SiO2 surface controlled by electrostatic interaction between positively charged surfactant head groups and siloxane groups (-SiO-). Furthermore, it is known that adsorption of CTAB on SiO2 surface could overcome micelles formation in bulk water [50, 51], which could elucidate why good aggregation can still be obtained at CTAB concentrations near or higher than CMC.
Figure 2-11: Possible simplified scheme of CTAB-SiO2-water interface as proposed by Liu and co-workers [44]. Counterions Br- are omitted for clarity.
2.3.4 Effect of SDS on System Stability
Properties of SDS
Sodium dodecyl sulphate (SDS) is an anionic surfactant, which is comprised of an anionic sulphate head and a 12-carbon hydrophobic tail, as depicted in Figure 2-12 below:
Figure 2-12: Structure of SDS: anionic head and hydrophobic tail.
Effect of SDS on Particle-Particle Surface Interaction
As mentioned previously, several studies have shown that SDS could be adsorbed on colloidal SiO2 surface. Ahualli et al [35] observed that the effective charge of the negatively charged silica NPs and hence the repulsion between particles. Furthermore, other groups have reported that a small amount of SDS is adsorbed onto silica surface due to the heterogeneities on the colloid surface [33, 34]. The existence of charge heterogeneity on the colloid surface has been found to decrease the electrostatic repulsions for the same average surface potential [28, 33]. As such, adsorption of the negatively charged SDS to mask the heterogeneities on the colloid surface may result in a more uniform and higher negatively charged surface thus resulting in greater electrostatic repulsion between the SDS adsorbed colloidal particles [52].
2.3.5 Effect of TX100 on System Stability
Properties of Triton X-100
Triton X-100 (TX100) is a non-ionic surfactant that has a hydrophilic polyethylene oxide (PEO) chain (on average it has 9-10 ethylene oxide units) and an aromatic hydrocarbon hydrophobic group, which is a 4-(1,1,3-3-tetramethylbutyl)-phenyl group, as depicted in Figure 2-13 below.
Figure 2-13: Structure of non-ionic surfactant Triton X-100.
The CMC of TX100 have been reported to range from 0.24 mM [42] to 0.33 mM [58] at room temperature. The size of TX-100 micelles has been reported to have an average radius of 20-25 Å [59]. Other studies reported that TX100 micelles are oblate ellipsoids, with the major axis of about 45 Å and a minor axis of about 25 Å [60],
Effect of TX100 on Particle-Particle Surface Interaction
radicals of non-ionic surfactant molecules adsorbed on the solid surface and those present in the bulk solution come into play. These interactions result in the formation of surfactant associates on the solid surface and since the polar groups are oriented towards the bulk solution, the silica surface becomes hydrophilic [61].
According to Levitz et al [40, 41] at low degrees of surface coverage (0.17-0.5), the adsorbed phase is a fragmented medium made of small aggregates which are similar to the spherical micelles formed by TX100 in micellar solution. However with high degrees of surface coverage (above 0.8) the adsorbed phase may be considered as a continuous medium, forming either extended bilayer assemblies or an interconnected network of pseudomicellar aggregates [41].
Table 1: Characteristics of surfactants studied.
Surfactant name Acronym/
Abbreviation
Structural Formula CMC (mM) Temperature @
CMC (K)
Krafft temperature (K)
Cetyltrimethylammonium
bromide
CTAB C16H33N
+
(CH3)3Br -
0.89 - 0.92 [44, 45,
47]
298 298 [25]
Sodium dodecyl sulfate SDS C12H25NaO4S ~8 [52] 298 290 [25]
282 [28]
Polyethylene glycol tert
-octylphenyl ether
Triton X-100 C14H22O(C2H4O)n
(n=9-10)
0.24 - 0.33 [42, 58] 298 <0 (64oC 1)
1
2.4
Colloidal Fouling & Concept of Critical Flux
Fouling is in inevitable consequence in membrane processes. It is one of the major phenomena responsible for the reduction of flux to far below the theoretical capacity of the membrane hence the deterioration of the process performance. Colloidal fouling in membrane filtration systems is a complex process as there are different physical and chemical phenomena that occur simultaneously. The complexity of colloidal fouling is generally attributed to hydrodynamic conditions, inter-particle interactions, and particle-membrane interactions, which would be eventually reflected by the fouling properties on the membrane surface.
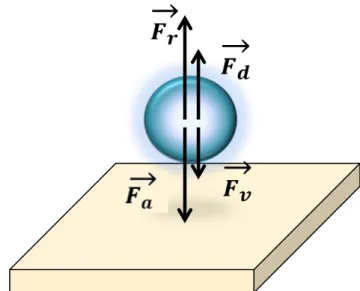
The simplest approach to consider filtration of particles is to consider a single colloid driven towards the porous surface by a convective flux, J. Mass transfer during filtration is then the result from a balance between the convective term and a diffusive term described by an interaction potential which can be modelled using, for instance the DLVO theory [62]. Equation 5 describes the net flux of particles towards the membrane, N, which is the combined effect of convective flux which drives the particles towards the membranes, and fluxes which tend to remove particles away from the wall effects hence termed “dispersive” effects [63].
𝑁=𝐽𝜙−𝐷!"!"−
!
!"𝜙
!"
!" Equation 5
On the right hand side of Equation 5, Jϕ is the convective contribution to the flux; the second
term D!!"! represents the diffusive contribution whilst the third term
!
!"ϕ
!"
!" represents the term
for migration of solutes/particles due to surface interactions with the membrane [62]. This is
shown schematically in Figure 2-14, where Fv is the convective contribution to the flux, Fd is
the diffusive contribution, and Fa and Fr represent the electrostatic interaction due to attractive
Figure 2-14: Schematic of the forces that are involved in a dead end filtration process.
According to Aimar et al. [12], from a microscopic point of view, fouling starts to occur when the convective forces of these particles towards the membrane is equal to or exceeds the total force imposed by the diffusive and electrostatic interaction between the particle and membrane surface.
A widely accepted methodology to investigate fouling behaviour in membrane filtration
systems is to identify the so-called critical flux, Jcrit. [64-66]. The critical flux is generally
considered as the flux above which particle deposition occurs on the membrane surface, as the drag force acting on the particle is not high enough to overcome the repulsion between the particle and the membrane [62].
According to Field et al [67], there are two forms of critical flux. The so-called strong form of critical flux is the highest flux at which the permeability of a fouling solution is the same as the permeability for pure solvent (water) at the same flux. The weak form is said to exist when the permeability of the fouling solution is lower than that for the pure solvent under subcritical operation, but is independent of the imposed flux ([67]. In the real world, feeds which result in the strong form of flux is rarely observed [67].
Operation above the critical flux causes fouling. Critical flux can be a good indicator for performance of the membrane system to keep its productivity constant with advantage of operational cost [66]. It is also often in many industrial UF installations, that it is necessary to operate the system under sub-optimum conditions, which may mean operation below or above the critical flux. As such, it is also imperative to understand the fouling behaviour over a broad range of sub- and super-critical fluxes.
The most widely accepted method to determine critical flux is usually based on the flux-step method. In this method, flux is increased in small steps while change in the transmembrane pressure (TMP) is monitored. Several groups have also performed decremental flux steps in some critical flux tests to evaluate the effects of fouling history on hysteresis[68, 69]. There are varying flux-step methods, some are carried out with uninterrupted flux increments [65], while others incorporate flow decreases or stoppage steps for relaxation [64] and backwash steps [70, 71].
Van der Marel et al [64] developed an improved flux-step method, which includes an intermediate relaxation step as a cleaning mechanism, to determine the critical flux and critical flux for irreversibility in a membrane reactor. Their method applied successive flux-steps of constant increment up to a maximum and back. Each flux is applied until a certain amount of permeate is collected, and reveals a constant TMP when operated below the critical flux [64]. An advantage of this method is that they could discriminate between reversible and irreversible fouling. They also observed that the influence of fouling history in the MBR was reduced by incorporating an intermediate relaxation step in their process.
Typically in UF processes, there are four mechanistic models that are used to describe fouling [72]. Complete blocking assumes that particles close off pore entrances thus preventing flow. Intermediate blocking is similar to complete blocking however it assumes that only a portion of the particles seal off pores while the rest accumulate on top of other deposited particles. Cake filtration occurs when particles accumulate on the surface of the membrane in a permeable cake, which increases in thickness and adds resistance to flow. Standard blocking, on the other hand, assumes that particles accumulate on the inside of the membrane wall, which constricts the pores over time and the permeability decreases [73].
3.
EXPERIMENTAL
3.1
Feed Solutions
Colloidal silica Ludox TM-50 (22 nm) in form of 50% silica nanoparticles, purchased from Sigma-Aldrich, was used as model silica nanoparticles. All solutions were prepared using
ultrapure water (Milli-Q, >18.2 MOhm). ACS grade NH4HCO3-(NH4)2CO3, HCl and NaOH
(Sigma Aldrich) were used to adjust the pH and ionic strength of the solutions used in this research. Sodium dodecyl sulfate (SDS), hexacetyltrimethylammonium bromide (CTAB) and Triton X-100 (TX100) were purchased from Sigma-Aldrich. All chemicals were used without further purification.
Filtration feed solutions used in this work were prepared in following way: Feed solutions were prepared with Milli-Q water with different concentrations of surfactants as summarized in
Table 2. 1mM of NH4HCO3-(NH4)2CO3 buffer solution was then added to maintain a pH 8 feed
solution. Subsequently, the commercial suspension of Ludox particles was introduced to obtain 50 mg/L of silica nanoparticles in the feed solution. This concentration was selected to maintain a realistic colloidal concentration found in actual wastewater, as well as to keep the concentration of surfactants to silica in a range where there is more than sufficient surfactant to adsorb on silica. Furthermore, at this concentration, we are also able to characterize the feed with the techniques available. Lower silica concentrations will render the characterization techniques unsuitable. At the end of the procedure, pH was adjusted again with either 0.1 M NaOH or 0.1 M HCl, if necessary. The temperature of the feed solution was maintained at 30°C by immersing in a temperature-controlled stirred water bath. Filtration experiments were carried out immediately after preparation of the feed solution.
Note: The Krafft temperature or critical micelle temperature of CTAB, which is the minimum
point below which it remains in crystalline form is about 25°C [49]. Therefore, all experimental
conditions and surfactant/SiO2/water systems were prepared and measured at a temperature
Table 2: Filtration feed solutions at pH 8 and 30°C
Silica-Surfactant
Solutions
Surfactant Concentration Silica Concentration
(mg/L) mM csurf /cCMC
SiO2 -- -- 50
SiO2-SDS
1 0.125 50
4 0.5 50
8 1 50
8 1 0
SiO2-CTAB
0.115 0.125 50
0.46 0.5 50
0.92 1 50
0.92 1 0
SiO2-TX100
0.025 0.125 50
0.1 0.5 50
0.24 1 50
0.24 1 50
The scattering intensity of the silica nanoparticles in the presence of CTAB, SDS and TX100 surfactants of various concentrations were measured by static light scattering using Dawn®
HeleosTM 8, supplied by Wyatt Technology Corporation. Light scattering data collection and
analysis was performed using Astra® 6.1 (Wyatt Technology Corportion), to determine its relative scattering intensity in relation to pure silica nanoparticles solution. The aim of this measurement was to obtain a qualitative quantity which can be related to the size of the aggregates, i.e. the higher the scattering intensity, the larger the aggregates compared to pure silica nanoparticle
As colloidal systems are optically inhomogenous, there is net light intensity in directions deviating from the direction of propagation, or scattering. The principle of a light scattering
experiment is given in Figure 3-1, whereby the intensity, 𝐼! (Wm
-2
) of the light scattered by a
sample at an angle 𝜃 (o)is measured by a detector at a distance r (m) from the beam. The
detection plane is given by incoming beam and sample-detector line and is usually taken
horizontally. The scattering volume, VS(m
3
Figure 3-1: (a) Top view of the principle of light scattering set-up. L: light source; 1: Filters, lenses; 2: Sample cell; 3: Mobile detector. (b) Definition of scattering volume Vs in a cross-section of the incoming beam and detection beam [74].
Scattering intensity, 𝑖! is obtained by considering the amplitudes of all the scattered waves,
and by taking into account their phases, and it can be given by the following Rayleigh equation [74]:
𝑖!=! ! !!=𝐼!
𝑛!!−𝑛!! .!!!!"! !!!!!
[𝑊𝑚!!] Equation 6
where 𝐼! (Wm
-2
) is the incoming light intensity, 𝑛! and 𝑛! (-) are the refractive index of
particle and medium, respectively; N is the number of particles per cubic meter of scattering
volume (particles/m3); where each particle has a volume
v
(m3), and 𝜆! is the wavelength(nm). Indeed, the Rayleigh theory predicts that light scattering depends strongly on particle
radius, a, namely as
v
2 ~ a6. A quantity called the Rayleigh ratio, defined in Equation 7𝑅! = 𝑖!𝑟!/𝐼! 𝑚!! Equation 7
is the reduced scattered intensity under angle 𝜃, and may be regarded as the relative
scattering per steradian. This value relates to the size of the nanoparticles and allows an observation of the aggregation in the presence of surfactants [74].
In this study, static light scattering measurements of nanoparticle-surfactant solutions were
carried out at an angle of 90o with a wavelength of 658 nm at 30±1°C. They were also
undertaken for surfactant-only solutions to account for static light scattering of surfactant monomers and/or micelle. All measurements were repeated at least three times, and the
average of the Rayleigh ratios was obtained.
Electrophoretic mobility measurements of the silica nanoparticles were determined via electrophoresis measurements using Malvern ZetaSizer 3000Hsa (Malvern Instruments) to obtain the zeta potential of the nanoparticles. Zeta potential is derived from the accumulation of electrical charges at a solid-liquid interface where an electrical double layer is formed [75].
In addition to being experimentally accessible, the zeta potential can be correlated with particle stability; i.e. highly stable colloidal systems are characterized by high zeta potentials while less stable systems show low zeta potentials [76]. Indeed the deposition of particles onto membrane surfaces is also controlled by the zeta potential of the nanoparticles and membrane surface [76].
In the electrophoresis process, when an electric field is applied across an electrolyte, charged particles in the electrolyte are attracted towards the electrode of opposite charge. However, viscous forces acting on the particles tend to oppose this movement. When equilibrium is reached between these two opposing forces, the particles move with constant velocity (electrophoretic velocity). Zeta potential of the particles was approximated by the measured electrophoretic mobility using the Smoluchowski equation [76].
Both light scattering and zeta potential measurements were conducted using 50 mg/L nanoparticles solution prepared by dilution of commercial surfactants in ultrapure water (Refer to Table 3). The nanoparticle concentration in the feed and permeate solutions was measured by inductively coupled plasma mass spectrometry (ICP-MS) (Thermo Fisher X-series 2), evaluating the total silicon content, while the surfactant concentration was evaluated using total organic carbon (TOC) analysis.
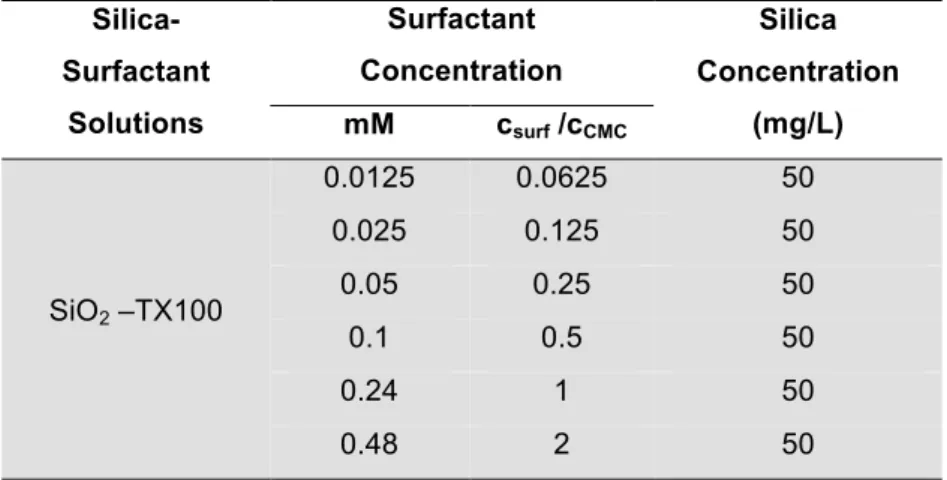
Table 3: Silica-surfactant suspensions for static light scattering and zeta potental measurements at pH 8.
Silica-Surfactant
Solutions
Surfactant Concentration
Silica Concentration
(mg/L) mM csurf /cCMC
SiO2 -- -- 50
SiO2 – SDS
0.5 0.0625 50
1 0.125 50
2 0.25 50
4 0.5 50
8 1 50
16 2 50
SiO2 – CTAB
0.05 0.0625 50
0.115 0.125 50
0.23 0.25 50
0.46 0.5 50
0.92 1 50
Silica-Surfactant
Solutions
Surfactant Concentration
Silica Concentration
(mg/L) mM csurf /cCMC
SiO2 –TX100
0.0125 0.0625 50
0.025 0.125 50
0.05 0.25 50
0.1 0.5 50
0.24 1 50
0.48 2 50
3.2
Membranes
Membranes used in the experiments were commercially available inside-out polyether sulfone-poly vinyl pyrrolidone (PES-PVP) ultrafiltration (UF) membranes supplied by Pentair X-Flow BV (UFCLE type, MWCO 150 kDa). UF filtration modules were prepared by potting 15 hollow-fibre membranes (inner diameter 0.8 mm) in a PVC tube (outer diameter 120 mm) with
two-component polyurethane glue to give a final filtration area of 52 cm2 (Figure 3-2).
Figure 3-2: An example of a filtration module and a schematic describing the module operating in a semi dead-end configuration.
The membrane was characterized in term of pure water permeability, scanning electron microscopy analysis (SEM), inner surface charge and pore size distribution. For SEM analysis, small pieces of the dry native membrane and fouled membrane were sputtered with
Feed
Backwash Permeate
Potting Tee-‐fitting Membrane
fibres
thin platinum layer using a Jeol JFC-1300 fine coater. The SEM images were taken using high resolution SEM microscope (Jeol JSM-6000F).
The pore size distribution of the membrane was measured using the permporometry technique. This technique is based on the controlled stepwise blocking of pores by condensation of a vapour, linked with the simultaneous measurement of oxygen flux through the membrane [77]. It is imperative to select a vapour, typically present as a component of a gas mixture, which should not swell the membrane. At a relative pressure equal to unity, all the pores are filled with liquid and no gas permeation occurs. When relative pressure is reduced, the condensed vapour is removed from the largest pores according to the Kelvin equation:
ln !
!!= −
!!
!"
cosθ ( ! !!"
+ !
!!")
Equation 8
where P is the vapour pressure (Pa), Po the saturated vapour pressure (Pa), 𝛾 the surface
tension (N/m),
v
the molar volume of the liquid (m3/mol), R is the universal gas constant, T thetemperature (K), the contact angle 𝜃 (o) and rK is the Kelvin radius describing the curvature of
the liquid-gas interface (m). As the Kelvin radius (rK) is related to the specific vapour pressure,
a measurement of gas flow can provide information about the number of these specific pores and thus allowing pore size distribution to be obtained [78]. A schematic representation of the permporometer setup is shown in Figure 3-3. Along both sides of the membrane, a mixture of condensable gas and non-condensable gas was flushed; on one side air was used as the non-condensable gas while nitrogen was used on the other side. Cyclohexane was used as the condensable vapour in our setup and the practical measurement range of this method is 0.5 – 50 nm.
The surface potential of the inner membrane was determined via streaming potential measured with an electrokinetic analyser SurPASS (Anton Paar GmbH). Similarly, the surface potential is also dependent on the properties of the solid surface and the surrounding electrolyte medium; and can provide information on the charge and adsorption characteristics of the membrane [75]. In the streaming potential measurement, the salt solution is forced to flow through a porous plug material across a channel formed by two plates or down a capillary, by an external pressure. The liquid in the channel having a net charge, flows in the channel thus gives rise to a streaming current thereby generating a potential difference [75]. In our experiments, 1 mM KCl was used as a background electrolyte solution; the pH was adjusted using aqueous 0.1 M NaOH and 0.1 M HCl solutions. Zeta potential was calculated according to the Fairbrother-Mastin equation (Equation 9).
𝜁=!"!".!! !!!.
!!!!
!!"##
Equation 9
where 𝜁 is the zeta potential (V), dU/dp the slope of streaming potential versus pressure
(V.Pa-1), 𝜂 the electrolyte viscosity (Pa.s), 𝜀
! the dielectric constant of electrolyte, 𝜀! the
vacuum permittivity (CV-1m-1), 𝜅! the specific conductivity of the electrolyte solution (S/m), and
Rh and Rcell the electrical resistance (Ω) of the cell filled with high salt concentration and with
the working salt concentration, respectively [79].
3.3
Flux-Step Experiments
Feed Pump
BW Pump
BW Feed
Retentate
Permeate
T T
F
F
P
P
P
P
Membrane
Figure 3-4: Flowsheet of the OSMO filtration setup. BW and Feed are backwash water and feed water tanks respectively. The flows are controlled by two mass flow controllers (F). Pressure (P) is measured in the feed, backwash, permeate and retentate. Temperature is monitored in the feed and downstream of the backwash pump.
Figure 3-5: Picture of the OSMO Inspector filtration setup.
to the feed or permeate side of the membrane, enabling the integration of automatic pure
water flux experiments. Two high precision mass flow controllers (Cori-FlowTM model M15,
Bronkhorst Cori-Tech, NL.) are installed to measure and control the feed and backwash fluxes. Before filtration of the nanoparticle solution, the feed solution was left in a temperature controlled stirred water bath to allow the temperature to equilibrate at 30°C.
It is noted that glycerol is used to preserve the UF membranes by preventing pore collapse. The membranes are immersed in glycerol solution after preparation which stays in the pores. Since glycerol does not evaporate the pores cannot collapse as a result of evaporation and/or capillary forces. As such, to avoid the leaching of glycerol into the permeate samples, ultrapure water was filtered through the membrane modules at high pressure (2 bar) for 30 mins to remove the glycerol. Following that, the pure water flux of the individual module was checked to be approximately the same as the expected from pure water flux experiments. Due to the nature of the potting procedure, there was always a difference in the membrane surface area between individual modules, hence pure water flux varied to a small extent for
every module. Only modules with about similar pure water fluxes were chosen (±15%) for
further filtration with silica nanoparticles.
After the determination of initial pure water flux, the fouling experiments were started. The OSMO software was programmed to perform filtration-backwash cycles at fluxes from 0.1 kg/hr, with an increment of 0.1 kg/hr at each step up to 1.0 kg/hr, followed by a downward step from 1.0 to 0.1 kg/hr with a similar decrement of 0.1 kg/hr. As such a single filtration experiment is comprised of 10 ascending and 9 descending flux-steps. At the onset of each flux-step, the sequence is described as follows and is shown schematically in Figure 3-6:
i. Pure water permeability check at 0.2 kg/hr, 0.4 kg/hr and 0.8 kg/hr. The purpose of
this step was to observe and investigate the effect of irreversible fouling of the membrane module;
ii. Flush the shell side with feed solution at 1 kg/hr for 1 minute, to fill the module with
feed solution;
iii. Filtration with feed solution to obtain a permeate volume of 100 mL;
iv. Flush the shell side with pure water at 2.5 kg/hr for 1 minute, to remove the permeate
from the shell side of the module; and
v. Backwash of membrane module with Milli-Q water at 2.5 kg/hr for 1 minute, to clean
T
ran
sm
e
m
b
ran
e
P
re
ss
u
re
0
Filtration
Pure water
permeability
Forward
flush
Permeate
flush
Backwash
P
endPinitial
i
ii
iii
iv
v
Figure 3-6: Layout of one filtration-backwash cycle (Adapted from van de Ven [80]).
Filtration at each flux step was applied until 100 mL of permeate sample were collected. The silica and surfactant content of the samples were determined using ICP-MS and total organic carbon (TOC), respectively. 50 mL of permeate was collected for ICP-MS analysis, and 20 mL of permeate was collected in glass vials for TOC analysis. ICP-MS and TOC analyses were carried ut by Dutch water supply company Vitens NV.
3.3.1 Analysis of the Result
The evolution of transmembrane pressure (TMP) with time at each flux step, JH was
monitored, as shown schematically in Figure 3-7. The total fouling rate (Ftotal) which includes
both reversible and irreversible fouling, can be calculated by the change in TMP with time at
each flux step, JH, i.e. Pend (Pa) and Piinitial (Pa) in Figure 3-8, using Equation 10.
Total fouling rate, 𝐹!"!#$=
!!!"!#$
!" =
!!"#!!!"!#!$% !!!
!
!! Equation 10
where R is the resistance (m-1), J is the flux (m3m-2s-1), 𝜂 is the viscosity of the permeate
corrected to experimental temperature (Pa s), t is the flux-step duration (s) and Pinitial , Pend,
and P2 are the pressures as defined above. The total fouling rate, Ftotal is inversely
proportional to the permeate viscosity, as such the permeate viscosity has been corrected
Figure 3-7: TMP-Flux profile of a flux step filtration experiment (adapted from van de Marel [64]).
Figure 3-8: Schematic representation of the flux-step protocol as developed by van der Marel et al [64].
To determine the critical flux in the filtration experiments, an arbitrary minimum increase in
TMP of 10 Pa min-1 was used [64], whereby the critical fouling rate (Fcrit) was calculated for
each flux by applying this minimum increase in TMP into Equation 10 above. The critical fouling rate is an asymptote to zero with increasing flux, as a fixed TMP with time is divided
The fouling rate can be obtained graphically by plotting the increment in membrane resistance due to fouling against time, and calculating the gradient of the linear portion [35]. From this method of analysis, the total fouling rate and critical fouling rate for each flux-step were determined. Pure water permeability of the membrane module was determined from the slope of the flux against TMP and the comparison or the pure water permeability in between flux steps allows identification of the irreversible fouling rates.
The removal efficiency, or rejection of silica nanoparticles (RSiO2) and surfactant (Rsurf) were
defined as:
𝑅!"#!= 1−
!
!,!"#!
!!,!"#! × 100% Equation 11
𝑅!"#$= 1−
!!,!"#$
!
!,!"#$ ×
100% Equation 12
where Cp and Cf (mg/L) represent the concentration of SiO2 and surfactant in the permeate
and feed, respectively.
The permeability recovery (PR) of the membrane was defined as:
𝑃𝑅= !"!"!"! Equation 13
where Pebw and Pew (Lm
-2
h-1bar-1) are the pure water permeability of the membrane after
![Figure 2-4: General shape of adsorption isotherm and proposed molecular model for two-step and four-region adsorption models [21, 23]](https://thumb-eu.123doks.com/thumbv2/123dok_br/16490194.733127/21.892.171.711.289.578/figure-general-adsorption-isotherm-proposed-molecular-region-adsorption.webp)
![Figure 2-5: Adsorption isotherm of CTAB on SiO 2 as reported by Tyrode et al [14]](https://thumb-eu.123doks.com/thumbv2/123dok_br/16490194.733127/22.892.132.763.98.379/figure-adsorption-isotherm-ctab-sio-reported-tyrode-et.webp)
![Figure 2-6: Adsorption of SDS onto silica and silica pretreated with polyethylene oxide at room temperature (23 ± 2°C) and neutral pH (6.5 to 7) [31]](https://thumb-eu.123doks.com/thumbv2/123dok_br/16490194.733127/23.892.179.634.106.491/figure-adsorption-silica-silica-pretreated-polyethylene-temperature-neutral.webp)
![Figure 2-7: Adsorption isotherms of TX100 on Syton W30 and Ludox HS40 at pH 6 [42]](https://thumb-eu.123doks.com/thumbv2/123dok_br/16490194.733127/24.892.193.701.108.435/figure-adsorption-isotherms-tx-syton-w-ludox-hs.webp)
![Figure 2-10: Simplified scheme of CTAB ‘tail to tail’ bilayer and multilayer formation on SiO 2 -water interface [50]](https://thumb-eu.123doks.com/thumbv2/123dok_br/16490194.733127/26.892.277.645.109.320/figure-simplified-scheme-ctab-bilayer-multilayer-formation-interface.webp)
![Figure 2-11: Possible simplified scheme of CTAB-SiO 2 -water interface as proposed by Liu and co-workers [44]](https://thumb-eu.123doks.com/thumbv2/123dok_br/16490194.733127/27.892.143.751.109.470/figure-possible-simplified-scheme-ctab-interface-proposed-workers.webp)