Int ernational journal of Comput er Science & Network Solutions Jan.2015-Volume 3.No.1 ht t p:/ / www .ijcsns.com ISSN 2345-3397
49
EEG Classification Using Different Feature
Extraction Techniques for
Emotion Recognition
AbdolNabi Ansari-Asl
Department of Computer Science, Dezful Branch, Islamic Azad University, Dezful, Iran [email protected]
Abstract
Brain Computer Interface (BCI) is becoming increasingly popular. Our paper focused on an applied of it that is called recognizing emotion from human brain activity, measured by EEG signals. EEG signals were analyzed and classified into three emotions—happiness, sadness and normal. For emotion recognition, Radial Based Function (RBF) is applied to classify the emotional signals and feature extraction techniques are investigated. Using gathered data under EEG signals emotion stimulation experiments, the classifier is trained and tested. After applying classification and different feature extraction methods to 300 EEG time series, we concluded that frequency-band energy features outperformed other methods in the emotion assessment.
Keyword: Classification, Feature Extraction, BCI, EEG, Emotion, RBF
I. Introduction
Int ernational journal of Computer Science & Net work Solut ions Jan.2015-Volume 3.No.1 ht t p:/ / www.ijcsns.com ISSN 2345-3397
50
transform, structural component extracted from a segment of a pattern. Statistical characteristics and syntactic descriptions are the two major subdivisions of the conventional feature extraction modalities. Feature extraction scheme is meant to choose the features or information which is the most important for classification exercise (Chanel et al, 2006). The final stage is signal classification which can be solved by linear analysis, nonlinear analysis, support vector machine, adaptive algorithms, clustering and fuzzy techniques, and neural networks.
Figure 1: Standardized electrode placement scheme (Malmivuo et al, 1995)
Figure 2:EEG signal classification process
II. Acquisition protocol
Data was acquired from 10 participants, 6 males, 4 female. For EEG's we used a Biosemi Active Two device with 64 electrodes (plus 2 for reference). We sampled signals at a 1024 Hz rate. For each recording, the participant equipped with the above sensors was sitting in front of a Laptop computer screen at first screen was dark. A white cross was then drawn on the screen center for a random period of 2 to4 seconds, to attract user's attention and avoid accustoming. An IAPS image was subsequently displayed for 8 seconds. Finally, we asked the participant to self-assess their emotion. After recording EEG signals, signals were preprocessed by a band-pass filtering to keep frequencies in the 4-45Hz range. This allowed us to remove unwanted effects like power line noise. Also we identified Eye blinks as high-variance parts and removed by subtraction from the signals.
III. Feature Extraction:
With the advent of electroencephalography, the study of EEG has been started and now there is vast variety of methods to the extraction of quantitative features from an EEG signal. Non-linear dynamics methods to the problem of the description of an EEG were relatively successful. Another one is statistical approaches which seem to be the most feasible and theoretically satisfactory methodology for the quantitative analysis of the EEG signal up to now.
Data Acquisit io n
Art ifact Remo val
Feature
Int ernational journal of Comput er Science & Network Solutions Jan.2015-Volume 3.No.1 ht t p:/ / www .ijcsns.com ISSN 2345-3397
51
Mathematical methods are for extracting features from EEG signals. For EEG classification there are various features such as wavelet coefficients, autoregressive model parameters, and signal energy in different frequency bands which have been used. An important problem with EEG classification is the huge number of features which, it comes from the fact that EEG signals are no stationary, thus features must be computed in a time-varying manner and the number of EEG channels is large. In this paper we applied the autoregressive (AR) model coefficients, band power and standard, because they investigate the EEG signal in different aspects. They are related to power spectrum, frequency domain and average of the EEG signals, respectively. In following a short review of feature extraction methods for extracting from EEG signals are investigated:
A. Standard features
The physiological features can be considered as standard because of their frequent use for emotion assessment. Only the features that were used in this study are described. By assuming that each measured signal is generated by a Gaussian process with independent and identically distributed samples, the two physiological features that can be used to characterize a physiological signal are its mean and its standard deviation:
= 1 ( )
= 1 ( ( )− )
Where (n) is the value of the signal x (an EEG electrode signal, GSR signal, etc.) at sample n and Ns is the number of samples in a trial.
In order to evaluate the trend of a signal x over a trial, the average of the signal derivative can be computed as:
= 1
−1 ( ( + 1)− ( ) ) =
( )− ( 1)
−1
Finally the maximum and minimum of a signal can also provide information concerning the range of the signal amplitude:
Minx=min x(n) , Maxx=max x(n)
Those features are quite general and can be applied to a wide range of physiological signals (Chanel , 2009).
B. Autoregressive Method
Int ernational journal of Comput er Science & Network Solutions Jan.2015-Volume 3.No.1 ht t p:/ / www .ijcsns.com ISSN 2345-3397
52
assumed to be unchanged over time. AR methods estimate the power spectrum density (PSD) of the EEG using a parametric approach. Therefore, AR methods do not have problem of spectral leakage and thus yield better frequency resolution unlike nonparametric approach. Estimation of PSD is achieved by calculating the coefficients, that is, the parameters of the linear system under consideration. Two methods used to estimate AR models are briefly described below. (Subasi et al, 2005)(Faust et al, 2008)
C. Energy bound
It is shown that the EEG contains different frequency components, which can show different brain states and contain the discriminative information. Normally, EEG is classified as delta=[less than4 Hz], theta=[4–8 Hz], alpha=[8–13 Hz], beta=[13–30 Hz]and gamma=[more than 30 Hz]. Band power feature reflects the power in these five bands at each electrode position. First, the signal is filtered in determined frequency ranges using band-pass filter (Butterworth filter of order five). Second, each sample is squared and is averaged over a one-second interval (Parvinnia et al, 2014).
IV. Radial Basis Function Networks classification
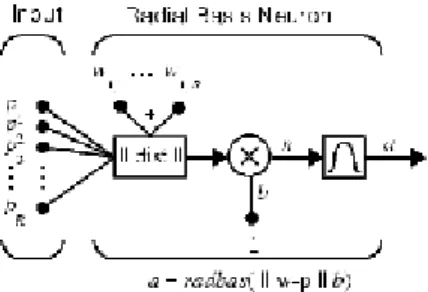
The radial basis function (RBF) network comprises one of the most used network models, which address the problem of curve-fitting and approximate in high-dimensional spaces. Learning in this case is equivalent to finding an interpolating surface in the multidimensional space that provides a best fit to the training data, measured by preselected statistical criteria. The RBF network consists of one hidden layer of basis functions, or neurons. At the input of each neuron, the distance between the neuron center and the input vector is calculated. The output of the neuron is then formed by applying the basis function to this distance. The RBF network output is formed by a weighted sum of the neuron outputs and the unity bias shown.
Figure 3. Radial Basis function network
Int ernational journal of Computer Science & Net work Solut ions Jan.2015-Volume 3.No.1 ht t p:/ / www.ijcsns.com ISSN 2345-3397
53
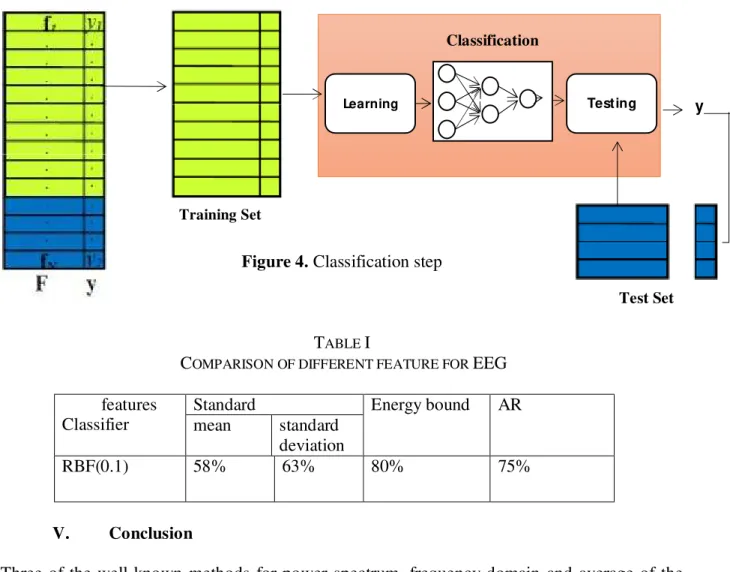
Figure 4. Classification step
TABLE I
COMPARISON OF DIFFERENT FEATURE FOR EEG
features Classifier
Standard Energy bound AR
mean standard deviation
RBF(0.1) 58% 63% 80% 75%
V. Conclusion
Three of the well-known methods for power spectrum, frequency domain and average of the EEG signals were investigated. The main problem in the classification of EEG signals is the quality of the recorded signal, which can be different during the experiment. After applying classification and different feature extraction methods to 300 EEG time series, we concluded that frequency-band energy features outperformed other methods in the emotion assessment. For future works it suggests, that other classifiers and other type of EEG signals can be used.
6- References:
i. L. Mayaud, M. Congedo, A. van Laghenhove, et al., “A comparison of recording modalities of P300 Event Related Potentials (ERP) for Brain-Computer Interface (BCI) paradigm,” Clinical Neurophysiology, vol. 43, no. 4, pp. 217–227, 2013.
ii. M. R. N. Kousarrizi, A. A. Ghanbari, M. Teshnehlab, M. Aliyari, and A. Gharaviri, “Feature extraction and classification of EEG signals using wavelet transform, SVM and artificial neural networks for brain computer interfaces,” inProceedings of the International Joint Conference on Bioinformatics, Systems Biology and Intelligent Computing (IJCBS '09), pp. 352–355, August 2009.
Training Set
Test Set
Learning Testing
Classification
Int ernational journal of Comput er Science & Network Solutions Jan.2015-Volume 3.No.1 ht t p:/ / www .ijcsns.com ISSN 2345-3397
54
iii. G. Chanel, J. Kronegg, D. Grandjean, and T. Pun, "Emotion assessment: Arousal evaluation using EEG's and peripheral physiological signals," in Multimedia Content Representation, Classification and Security, vol. 4105, A. K. J. B. Gunsel, A. M. Tekalp, B. Sankur, Ed., Lecture Notes in Computer Science ed. Istanbul, Turkey: Springer LNCS, 2006, pp. 530-537.
iv. J. Malmivuo and R. Plonsey, Bioelectromagnetism, Oxford, New York: Oxford
University Press, 1995, [Online]. Available:
ht tp:/ / butler.cc.t ut .fi/ ~malmivuo/ bem/ bembook/.
v. G. Chanel, " Emotion assessment for affective computing based on brain and peripheral signals ," PHD thesis, university Geneva, pp. 60, 2009.
vi. A.Subasi, M. K. Kiymik, A. Alkan, and E. Koklukaya, “Neural network classification of EEG signals by using AR with MLE preprocessing for epileptic seizure detection,” Mathematical and Computational Applications, vol. 10, no. 1, pp. 57–70, 2005.
vii. O. Faust, R. U. Acharya, A. R. Allen, and C. M. Lin, “Analysis of EEG signals during epileptic and alcoholic states using AR modeling techniques,” IRBM, vol. 29, no. 1, pp. 44–52, 2008.