Dissertation
Master in International Business
Determinants and Impact of the Perceived Value of
an Ad on the Consumers’ Perceptions and Behavioral
Responses
Tatiana Alshevskaya
Dissertation
Master in International Business
Determinants and Impact of the Perceived Value of
an Ad on the Consumers’ Perceptions and Behavioral
Responses
Tatiana Alshevskaya
Dissertation developed under the supervision of Doctor Cátia Crespo, professor at the School of Technology and Management of the Polytechnic Institute of Leiria.
iii
Acknowledgements
It is a pleasure to acknowledge my deepest gratitude to my thesis advisor, Cátia Crespo, professor at the School of Technology and Management of the Polytechnic Institute of Leiria, who was always available to guide me in the right direction, give an advice, useful recommendations and instructions. Thanks for your patience, motivation and profound knowledge.
I appreciate the help of my friends in dissemination of the survey and collection of the answers. I am grateful to all the participants of my survey, who have shared their time and valuable opinion. Without them, I would never achieve the number of respondents I have. I would also like to thank all my family and friends, who supported me throughout entire process of dissertation.
v
Resumo
Actualmente o tópico da atitude dos consumidores para com a publicidade e as suas intenções comportamentais tem vindo a suscitar bastante atenção na academia e na gestão. A presente investigação analisa os antecedentes do valor percebido de um anúncio, a sua influência no modo como os consumidores veem a imagem da marca e os seus efeitos nas respostas comportamentais para com a publicidade. A cultura exerce um impacto vasto e profundo nas atitudes e comportamentos das pessoas. Para examinar esta questão, o questionário foi implementado a inquiridos na Bielorrússia e em Portugal. A análise estatística dos dados do questionário foi realizada através de modelos de equações estruturais.
Os resultados do estudo indicam que a informação transmitida pelo anúncio, a atitude favorável dos consumidores para com a publicidade e a credibilidade do anúncio são determinantes importantes do valor percebido de um anúncio. Os resultados fornecem evidência para a influência do valor percebido de um anúncio nas percepções e respostas comportamentais dos consumidores. Com base nestes resultados propomos pistas de investigação futura na área e apresentamos as implicações para a gestão.
Palavras-Chave: Valor Percebido de um Anúncio, Intenção de Compra, Imagem da
vii
Abstract
Nowadays the topic of consumers’ attitude towards advertising and their behavioral intentions has gained a lot of attention in the academic and managerial spheres.
The present research investigates the antecedents of the perceived value of an ad, its influence on the way consumers view the image of the brand and how it affects the behavioral responses to the advertising. Culture exerts a broad and deep impact on people’s attitudes and behaviors. To examine this, the questionnaire was conducted among respondents in Belarus and Portugal. The statistical analysis of the survey data was performed with structural equations modelling (SEM).
The results of a survey indicate that informativeness, favorable attitude to the ad and credibility are the important determinants of the perceived value of an ad. Our findings provided evidence for the influence of the perceived value of an ad on the consumers’ perceptions and their behavioral responses. Based on these results we propose further research directions in the area and present the implications for the managers.
Keywords: Perceived Value of an Ad, Purchase Intention, Brand image, Word of mouth,
ix
List of figures
Figure 1 - Dimensions of Brand Knowledge ... 14
Figure 2 - The Brand Equity Ten... 15
Figure 3 - Conceptual Model ... 24
Figure 4 - Reliability and Validity of the Model (Portuguese Sample)... 44
xi
List of tables
Table 1 - Investigation Hypotheses ... 17
Table 2 - Variables and its measures ... 26
Table 3 - Common Method Bias – Portuguese Sample... 29
Table 4 - Common Method Bias – Belarussian Sample ... 30
Table 5 - Descriptive Statistic Analysis of the Constructs for Portuguese Sample ... 38
Table 6 - Descriptive Statistic Analysis of the Constructs for Belarussian Sample ... 41
Table 7 - Reliability of Items for Portuguese Sample ... 46
Table 8 - Reliability of Items for Belarussian Sample ... 49
Table 9 - Discriminant Validity for Portuguese Sample ... 53
Table 10 - Discriminant Validity for Belarussian Sample ... 54
Table 11 - Hypotheses Verification for Portuguese Sample ... 55
xiii
List of graphs
Graph 1 - Portuguese Sample Profile by Gender ... 32
Graph 2 - Portuguese Sample Profile by Age ... 33
Graph 3 - Portuguese Sample Profile by the Level of Education ... 33
Graph 4 - Media of Selected Ad in Portuguese Sample ... 34
Graph 5 - Belarussian Sample Profile by Gender... 34
Graph 6 - Belarussian Sample Profile by Age ... 35
Graph 7 - Belarussian Sample Profile by the Level of Education ... 35
xv
List of
acronyms
AVE - Average Variance Extracted
PLS - Partial Least Squares
SEM - Structural Equations Modelling SNS - Social Networking Services
SPSS - Statistical Package for the Social Sciences WOM – Word of Mouth
xvii
Table of Contents
ACKNOWLEDGEMENTS III RESUMO V ABSTRACT VII LIST OF FIGURES IX LIST OF TABLES XILIST OF GRAPHS XIII
LIST OF ACRONYMS XV
TABLE OF CONTENTS XVII
1. INTRODUCTION 1
1.1. Scope of the investigation 1
1.1. Main Research question 2
1.2. Contribution Proposed 2
1.3. Dissertation Structure 3
2. LITERATURE REVIEW 5
2.1. Perceived value of an ad 5
2.2. Determinants of the perceived value of an ad 6
2.2.1. Informativeness 6
2.2.2. Entertainment 7
2.2.3. Favorable consumer attitudes toward advertising 7
xviii
2.3. Perceived value of an ad consequences 8
2.3.1. Brand image 8
2.3.2. Purchase intention 10
2.3.3. WOM 10
2.3.4. Brand equity 12
3. CONCEPTUAL MODEL AND RESEARCH HYPOTHESES 17
4. METHODOLOGY 25
4.1. Sampling procedure 25
4.2. Questionnaire development and Pre-test 25
4.3. Measures 26
4.4. Common method bias 29
4.5. Non response bias 32
4.6. Sample profile 32
5. DATA ANALYSIS 37
5.1. Descriptive analysis 37
5.2. Validity and Reliability of the Measures and Structural Evaluation 44
5.2.1. Reliability of the Items 45 5.2.2. Convergent validity 52 5.2.3. Discriminant validity 52 5.2.4. Evaluation of the Structural Model 55
5.3. Results Evaluation 55
6. DISCUSSION AND CONCLUSIONS 59
6.1. Main Findings 59
xix
6.3. Main limitations and suggestions for further research 62
REFERENCES 63
APPENDICES 71
1
1. Introduction
1.1. Scope of the investigation
Nowadays the topic of consumers’ attitude towards advertising and their behavioral intentions has gained a lot of attention in the literature.
Some studies focus on the emotional response to advertising (Stout & Leckenby, 1986), others concentrate on the importance of social factors in consumers’ perceptions about advertising (Zeng, Huang, & Dou, 2009) and behavioral responses towards it (Wanga & Sun, 2010). For instance, previous research by Stout and Leckenby (1986) suggests that individuals having an emotional response would also have more positive attitudes to the ad and to the brand, and greater purchase intent.
However the consumers’ perceptions of the value of advertising have hardly been studied. Some research about it points out that generally consumers show positive reactions to the informational value of advertising (Mehta, 2000). Moreover, in order to measure the worth of advertising for the consumers was introduced the concept of the perceived value of an ad (Ducoffe, 1995).
The objective of this research is to investigate the influence of the antecedents of the perceived value of an ad (informativeness, entertainment, credibility, consumer attitudes towards advertising) on perceived ad value and its effect on the way consumers view the image of the brand and how it in turn affects the behavioral responses to the advertising, such as purchase intention, positive word of mouth and brand equity.
Culture exerts a broad and deep impact on people’s attitudes and behaviors. Some studies suggest that behavioral responses toward advertising may vary across countries (Wanga & Sun, 2010). However the majority of existing studies, related to the topic, have used the samples collected only in one country. Therefore, the extent to which the results are cross-culturally generalizable is limited. Moreover, the focus of most studies have been on the U.S. or other developed countries. The effect of consumers’ view about the advertising on behavior and brand attitude has hardly been studied in Belarus and Portugal. These countries represent different cultural orientations that warrant a comparison of consumers’ perception of ads and its impact on behavior and brand attitude between the selected
2
countries. Therefore this study will provide a valuable insight into consumers’ perceptions and behavior for marketers in Belarus and Portugal.
Findings from the current research may offer a new perspective on the importance of the perceived value of advertising and help in implementation of advertising strategies in order to enhance brand image.
1.1. Main Research question
The main research question of this investigation is how the perceived value of an ad and its antecedents, namely informativeness, entertainment, credibility, consumer attitudes towards advertising influence brand image, purchase intention, positive word of mouth and brand equity.
The objective of the study is to analyze, whether informativeness, entertainment, credibility of an ad, consumers attitudes towards the advertising are directly influencing the perceived ad value and the high perceived ad value has a positive influence on the brand image, increasing positive behavioral responses to the advertising.
1.2. Contribution Proposed
This study aims to extend the existing studies of perceived ad value by creating a model with the focus on its antecedents and effects on the brand image and behavioral responses to advertising. The following investigation will contribute both to academic and managerial level by showing the antecedents of perceived ad value and how it influences on the company brand.
Since culture plays an important role in the formation of the consumers’ perceptions towards ads and its value, this investigation will contribute to the extension of the international coverage of the question by conducting questionnaires in Belarus and Portugal.
3
1.3. Dissertation Structure
The structure of the research is planned as follows: first, I review relevant literature on consumers’ perceived value of ads and its influence of behavioral responses and brand attitude, as well as a brief introduction of the culture in Belarus and Portugal; second, based on the literature review, hypotheses and research questions will be proposed; third, data and methodology will be described; fourth, the research results and implications will be presented, as well as limitations and future research directions.
5
2. Literature review
The aim of this chapter is to provide the review of the main concepts of the model, such as informativeness, entertainment, credibility, advertising value, behavioral responses to the ad, the perceived value of an ad, brand image, word of mouth, purchase intention and brand equity. The literature review will analyze the previous studies, related to the topic, investigate the concepts and theories, necessary for investigation.
2.1. Perceived value of an ad
Advertising value is defined as a subjective evaluation of the relative worth or utility of advertising to consumers (Ducoffe, 1995).
The value of advertising can be viewed from the company and the consumers’ perception. It is interesting to look on the value of advertising from the consumers’ point of view, because it will bring more understanding to the issue of how advertising basically works. To define advertising value several ways were examined. Firstly, the benefits and costs that consumers encounter with advertising can be reviewed. Houston and Gassenheimer (1987) believed that consumers’ reactions can be explained by the fact, if they got what they want from the advertising or not. Secondly, informational aspect of advertising shouldn’t be eliminated (Rotzoll, Haefner, & Sandage, 1989). In contrast to informativeness and entertainment that affect positively the advertising value, deceptiveness, annoyance and irritation have the negative influence.
Ducoffe (1995) studied in more details such concepts as ad likability and attitude towards the ad. The aim of research was to find out the factors that influence on the probability of consumers to favor the advertising. Consequently the more valuable the advertising is for them, the more favorable reactions they show.
Zeng, Huang and Dou (2009) focused on the impacts of social identity and group norms on the community users’ group intentions to accept advertising in online communities. They mentioned that there exists only little research, concerning the methods to convince consumers to be more receptive to online social communities’ advertising. For instance, in the sphere of internet advertising research proved that there is a connection between relevance of ads to the context and the advertising effectiveness. It is studied that users in
6
the online communities accept the advertising that is relevant to the themes of the community and may be interesting for them.
According to Ducoffe (1996) the more relevant ads are the ones that have the higher ad value.
Moreover Zeng et.al. (2009) view the informative characteristic of advertising as the one that brings more value to the ad. The authors hypothesized that there is a positive relation between the perceived ad relevance and perceived ad value. After that perceived ad value is influencing positively on the behavioral intentions to advertising in online social networking communities. That’s why in order to achieve positive responses from the consumers both perceived relevance and value of advertising should be taken into the account.
2.2. Determinants of the perceived value of an
ad
Customers’ attitudes towards the advertising depend on various variables. Ducoffe (1996) created the model of the advertising value and studied the antecedents of the advertising value, such as informativeness, entertainment, credibility and irritation in the online advertising.
2.2.1. Informativeness
There have been constructed several definitions of informativeness. Informativeness deals with the ability to inform the customers about the purchase alternatives in order to increase satisfaction level. It was suggested that advertising can be considered informative if it permits the consumer to make more intelligent buying decisions after seeing the commercial than before. Resnik and Stern (1977) stated that it should include one of the clues that gives the possibility to the user to achieve his purchase objectives better. Among the clues they mentioned price or value, quality, performance, components or contents, availability, special offers, taste, packaging or shape, guarantees or warrantees, safety, nutrition, independent research, company-sponsored research, new ideas.
Soley and Reid (1983) investigated the importance of the quantity and type of information for the informativeness. The results demonstrate that the perceived informativeness of
7
advertising is affected more by the type of information than by the quantity of information in advertising content. As for the content analyses of advertising’s informational content, it was found out that increasing the amount of information in advertising content does not necessarily make advertising more informative.
2.2.2. Entertainment
Entertainment of an ad was defined as being pleasant or likable and fulfilling the need of enjoyment and emotional release (Ducoffe, 1996). Researchers believe that advertisers should create messages that provide explicit value to users. Taylor, Lewin and Strutton (2011) admitted that the highest value by the users of social networking sites was given to entertainment, followed by informative value.
There were conducted several studies in order to investigate the antecedents of the perceived ad value. Ducoffe (1996) found that attitudes towards Web advertising were directly dependent on advertising value and perceived levels of entertainment. Furthermore, advertising value was dependent on perceived levels of entertainment, informativeness, and irritation. Ducoffe (1995) identifies entertainment, informativeness, and irritation as factors contributing to consumers’ evaluations of ad values and thus attitudes toward ads.
2.2.3. Favorable consumer attitudes toward
advertising
Attitude toward the ad is defined as a “predisposition to respond in a favorable or unfavorable manner to a particular advertising stimulus during a particular exposure occasion (Lutz, 1985).
Deep research was conducted in the sphere of the attitudes towards advertising, investigating it from various prospections. For instance, Altuna and Konuk (2009) investigated the attitudes towards mobile advertising and its influence on the consumers’ behavior, making a comparison of different cultures (Turkey and Unites States of America). They stated that there is a correlation between the studied variables, however the attitudes were more positive in US than in Turkey.
8
Attitude to the ad was proposed as a variable that is influencing the brand attitudes and the purchase intentions of the customers (MacKenzie, Lutz, & Belch, 1986).
2.2.4. Credibility
The concept of credibility has attracted interest of scholars and practitioners in advertising and marketing. Many studies investigated credibility in various concepts, focusing on the endorsers and corporate credibility (Goldsmith, Lafferty & Newell, 2000), communicator credibility (Choo, 1964), online advertising credibility, that includes website credibility, ad relevance and advertiser credibility (Choi & Rifon, 2002).
Ad credibility is defined as the extent to which the consumer perceives claims made about the brand in the ad to be truthful and believable (MacKenzie & Lutz, 1989). They stated that ad credibility is the ad credibility sub-system, consisting of three constructs: perceived ad claim discrepancy, advertiser credibility, and advertising credibility. It is stated that ad credibility is an important element in forming the positive attitude towards advertising (Choi & Rifon, 2002).
Brackett and Carr (2001) further validate the model of Ducoffe and extend the model to include credibility and consumer demographics. Credibility is proved to be directly related to both advertising value and attitude towards advertising. Demographic variables such as college major, age, and gender are shown to effect only attitudes towards advertising.
2.3. Perceived value of an ad consequences
2.3.1. Brand image
Nowadays in the conditions of the competitive market companies are paying more attention to the development of a strategy in order to differentiate their products and services.
Brand image can be defined as the perceptual beliefs about a brand’s attribute, benefit and attitude associations, which are seen as a basis for evaluation of attitude toward the brand. (Keller, 1993).
There are several studies that suggest that brand image is strongly connected to the brand equity. Faircloth , Capella and Afford (2001) proved that creation of positive brand image
9
and brand attitude increases brand equity. In this study brand image directly influenced brand equity.
Aaker (1997) developed a theoretical brand personality framework and identified the following brand personality dimensions:
- Sincerity (down-to-earth, honest, wholesome, cheerful) - Excitement (daring, spirited, imaginative, up-to-date) - Competence (reliable, intelligent, successful)
- Sophistication (upper-class, charming) - Ruggedness (outdoorsy, tough).
Brand personality is defined as the set of human characteristics associated with a brand. The brand personality framework can be used to give the insights to the antecedents (such as user imagery, advertising, and packaging) and consequences (consumer preference and usage, emotions of consumers, trust and loyalty) of brand personality. Moreover the perceptions of brand personality may vary across cultures.
The research about the relationship between brand love, personality, image and WOM were conducted by Anggraeni and Rachmanita (2015) on the sample of the companies in the fashion industry. It is worth mentioning that many researchers suppose that excitement and sincerity are the main dimension of the brand personality (Aaker, et.al, 2004). The study of Anggraeni and Rachmanita (2015) proved that excitement, one of the dimensions of brand personality has a direct effect on the brand image, which supports the idea that a customer will evaluate the degree, till the brand matches with its own set of values and thus increase the positive brand image. This way, it is important for the companies to have the personality of the brand aligned with the personality of the customers. Moreover the researchers found out that brand image is affecting the customers’ WOM. That’s why the companies should pay attention to creation of the activities that strengthen the brand image in order to stimulate consumers to spread the WOM.
10
2.3.2. Purchase intention
Different behavioral responses of the customers were investigated for the last decades. Zeithaml, Berry, & Parasuraman (1996) made a research about the impact of the service quality on the customer behavioral responses and found that the connection is very strong. This way when the service quality is high, the customers behavioral intentions are favorable, which in turn strengthen their relationship with a company. On the contrary low quality of service may weaken this relationship. Among the favorable behavioral intentions are praise to the firm, expression of preference for the company over others, increase of the volume of purchases, agreement to pay the premium price. Unfavorable behavioral intentions include complaining and contemplation of switching to competitors. The study also investigated the impact of problem experience and resolution on the behavioral intentions. The superior problem resolution tends to strengthen the relationship between the customer and the company more than if no service problem occurred.
During the research was developed the model of financial and behavioral consequences of service quality. The extensive behavioral intentions battery included 5 dimensions, such as loyalty, switch, pay more, external response and internal response. They investigated the particular type of behavior that shows whether the customers remain or defect from a company.
Purchase intention can be explained as likelihood of the consumer to intend to purchase the product (Dodd & Supa, 2011).
Existing studies examined the relationship between purchase intention, loyalty, word of mouth and brand equity. For instance, Topcu and Duygun (2015) investigated the relations between loyalty and word of mouth. Aaker (1992) stressed the importance of brand loyalty in the value of brand, as it implies the generation of predictable amount of sales and profit. That’s why it is important to examine the relationships between the consumers’ purchase intention and word of mouth, as well as brand equity.
2.3.3. WOM
Word of mouth (WOM) was characterized as oral, person-to-person communication between a receiver and a communicator whom the receiver perceives as noncommercial, regarding a brand, product or service (Anderson, 1998).
11
Several characteristics of word of mouth, such as vividness and usefulness and brand dimensions (brand association, brand awareness, brand loyalty, perceived quality) were explored in the research of Virvilaite , Tumasonyte and Sliburyte (2015).
Vividness is linked to the speaking tone, richness of language, communication vividness and empathy in spreading word of mouth. Usefulness is connected to the message content and used language.
Word of mouth communication has an influence on the brand equity, as both vividness and usefulness of word of mouth communication messages characteristics give positive impact on brand equity and its dimensions (Virvilaite et. al., 2015).
Several studies explore the influence of word of mouth on the brand equity both directly and through other variables. It was proved that word of mouth influence brand equity indirectly through brand awareness, brand associations, perceived quality and brand loyalty (Murtiasih, Sucherly, & Siringoringo, 2014). The role of word of mouth in brand equity was clearly evident. That’s why it is suggested that the management of the company to focus on factors that encourage customers to talk positively their product. Moreover the word of mouth are now expanding to online media, so it is important to focus on the spreading of word of mouth online, both positive and negative one.
The study of Tuskej, Golob and Podnar (2013) examined the relationships between congruity of consumer and brand values, brand identification, brand commitment and word of mouth. The importance of the consumers’ identification in the formation of the relationship with a brand is highlighted in the research. When the brand identity matches the own set of values of consumers, they are more likely to find brand identity more attractive. Moreover the stronger consumer identifies himself with a brand, the more probable he will generate the positive WOM. It was proved that consumer identification fully mediates the impact of value congruity on brand commitment. “Value congruity is defined as mental comparison that consumers make in respect to the similarity or dissimilarity of entity values and their own set of values”. On the contrary brand commitment didn’t prove to mediate the influence of the consumers’ identification to the positive WOM.
DeCarlo, Laczniak, Motley and Ramaswammi (2007) investigated the effect of image and familiarity on the negative word of mouth on the sample of retail entities. It was found out
12
that the store image affected the receivers attributional processing of negative WOM. Moreover the type of the negative WOM received influences attributional processing and attitudes, for instance when the message is not well developed, receivers attribute the negativity to the communicator. The study proved that when consumers receive negative WOM about a store with a positive image, the receiver will not change the perceptions, but rather attribute the negativity of the message to the communicator. In the case of the less positive image, the blame for the negative message is attributed to the store.
Negative word of mouth can be viewed as consumers’ response to dissatisfaction in the form of sharing their negative experience with others. The concept of negative word of mouth was investigated by Topcu and Duygun (2015) in the correlation with the customer loyalty, thus it was proved that customer loyalty has a negative effect on the negative word of mouth and a positive effect on the repurchase intention.
De Angelis, Bonezzi, Peluso, Rucker and Costabile (2012) investigated the desire of people to share positive and negative information and specified the difference between generation of word of mouth (share the info about own experience) and transmission of word of mouth (share the info, they heard from other people). The findings of the study showed that people are more prone to generate positive word of mouth and transmit negative word of mouth.
2.3.4. Brand equity
The concept of brand equity is widely discussed during the last decades among the researchers and marketers. Generally speaking there are 2 main motivations to study brand equity: financially based motivation, that aims to evaluate the value of brand for the purposes of accounting and strategy-based motivation that is in charge of increasing efficiency of marketing productivity (Keller, 1993). According to the financially based motivation brand equity is viewed as the financial asset of the company and is defined as the incremental cash flows that accrue for the branded products over unbranded ones (Simon & Sullivan, 1993). The other dimension is known as customer-based equity. Keller (1993) defined customer-based equity as the differential effect of brand knowledge on consumers’ response to the marketing of the brand, comparing the reactions of the customers to the marketing mix of the brand to the same one of the unnamed product. The
13
marketing includes advertising, distribution, pricing and promotion as well as new products and brand extensions.
There are 2 main approaches for measuring customer-based equity: direct and indirect approach.
The indirect approach deals with the measuring of brand knowledge through brand awareness and brand image. The direct approach consists in evaluating directly the influence of the brand knowledge on the consumers’ response to the marketing of the brand. In my study I will be focused on the customer-based equity, as the aim of the research is to investigate how customers’ perceptions of the ad can influence the equity of the brand. Brand equity is generally measured either through the purchase intentions, that are measuring enhanced choice behavior (MacKenzie, Lutz, Belch, 1986) or through the willingness to pay a premium price for the brand (Park and Srinivasan, 1994).
Keller (1993) in his model of the conceptualization of brand equity measured brand equity through brand knowledge, which is defined in terms of brand awareness and brand image. Brand awareness consists of the brand recognition and brand recall, while brand image is defined as associations that the consumers have about the brand. There are 3 types of brand associations, such as attributes, benefits and attitudes. Attributes are the descriptive features that a customer uses to characterize a brand, benefits are the values that are attached to the product or service by the consumers and attitudes are the evaluations of the brand by the consumers.
14
Figure 1 - Dimensions of Brand Knowledge
Note: Adapted from “Conceptualizing. measuring. and managing customer-based brand equity,” by K. L. Keller, 1993, Journal of Marketing, 57, 7.
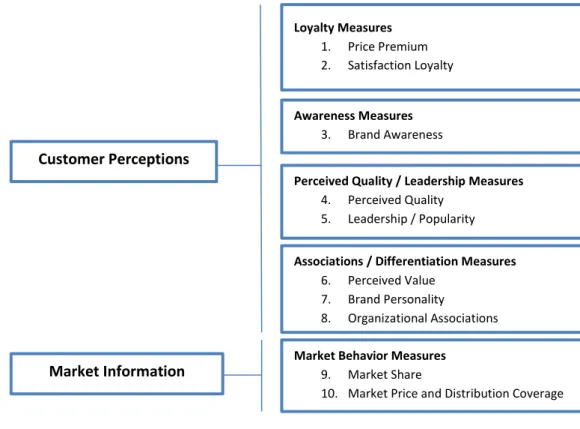
Currently the topic of creating brand value is widely discussed by managers. According to Aaker (1991) brand equity is a set of assets and liabilities associated with the brand, name and symbol that increase or decrease the value provided by the product to the company and customers. Brand equity is defined as both a financial asset and as set of favorable associations and behaviors. Brand equity consists of brand associations (brand image), brand loyalty, brand awareness, perceived quality and other brand assets (Aaker, 1991). Aaker (1996) created the Brand Equity Ten - a set of ten brand equity measures that are grouped in five categories. The first four categories, that were mentioned above represent customer perceptions of the brand: brand associations, brand loyalty, brand awareness and perceived quality. The fifth describes market behavior information rather than info from the perception of consumers.
Some researchers investigated the correlation between brand awareness and consumer preference for the brand and found out that brand awareness is important in consumers’ decision making process (Huang & Sarigöllü, 2012).
15
In my research I would like to focus on customer mindset measures that study customers' general attitude directly toward a brand and comprise of such components, as brand awareness and brand association.
According to Keller (1993) customer-based brand equity happens when the consumer is familiar with the brand and has some favorable, strong, and unique brand associations in memory. Brand associations are organized into three major categories: attributes, benefits, and attitudes. It is considered that brand has a positive customer-based brand equity, when consumers react in a more favorable way to the product, price, promotion, or distribution of the brand than they do to the same marketing mix element when it belongs to an unnamed product.
Keller investigated whether high levels of brand awareness and a positive brand image should increase the probability of brand choice and brand loyalty. In order to build customer-based brand equity, familiar brand that has favorable, strong, and unique brand associations should be created.
The study of Lassar, Mittal & Sharma (1995) shows the five dimensions of the customer-based brand equity: performance, value, social image, trustworthiness and commitment.
Figure 2 - The Brand Equity Ten
Note: Adapted from “Building strong brands” by D. A. Aaker, 1996, New York: Free Press.
Loyalty Measures
1. Price Premium 2. Satisfaction Loyalty
Awareness Measures
3. Brand Awareness
Market Behavior Measures
9. Market Share
10. Market Price and Distribution Coverage
Associations / Differentiation Measures
6. Perceived Value 7. Brand Personality
8. Organizational Associations
Perceived Quality / Leadership Measures
4. Perceived Quality 5. Leadership / Popularity
Market Information Customer Perceptions
16
Some researchers argued that there is a lack of managerial relevance in the concept of brand equity (Ehrenberg, 1997). However Faircloth, Capella and Afford (2001) found out that brand equity can be influenced by the creation of specific brand associations to the customers and managers should be focused on the introduction of these specific constructs rather than on the measurement of the financial performance outcome.
17
3. Conceptual Model and Research
Hypotheses
The conceptual model developed aims to analyze influence of informativeness, entertainment, credibility of the ad, consumer attitudes towards advertising on the perceived ad value among Portuguese and Belarussian consumers. Moreover the proposed model intends to analyze its effect on the brand image and consumers’ behavioral responses to the advertising, such as purchase intention, positive word of mouth and brand equity.
The present chapter will present our conceptual model and develop a theoretical explanation for the hypotheses formulation.
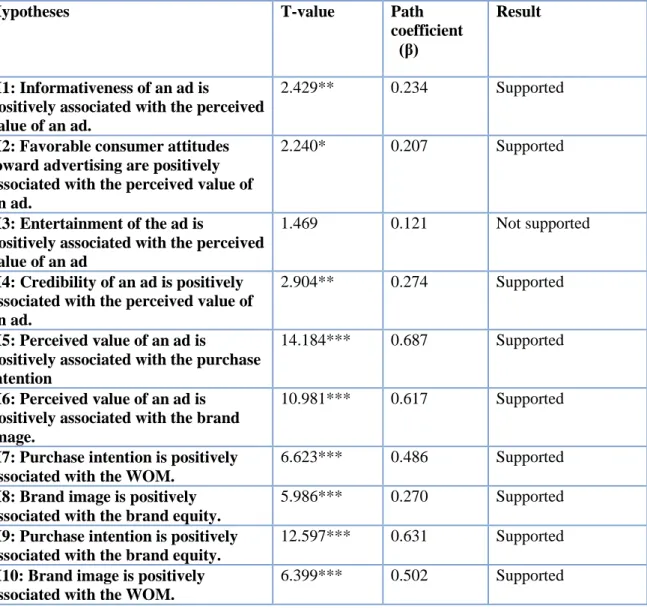
Table 1 - Investigation Hypotheses Hypotheses
H1 Informativeness of an ad is positively associated with the perceived value of an ad.
H2 Favorable consumer attitudes toward advertising are positively associated with the perceived value of an ad.
H3 Entertainment of the ad is positively associated with the perceived value of an ad
H4 Credibility of an ad is positively associated with the perceived value of an ad.
H5 Perceived value of an ad is positively associated with the purchase intention
H6 Perceived value of an ad is positively associated with the brand image.
H7 Purchase intention is positively associated with the WOM.
H8 Brand image is positively associated with the brand equity.
H9 Purchase intention is positively associated with the brand equity.
18
The influence of an ad informativeness on the perceived value of an ad
It is studied that supplying information is the primary reason why consumers approve of advertising both in traditional media and in online advertising. (Ducoffe, 1995,1996) The ability of an ad to provide needed information influences the attitude to it (Altuna & Konuk, 2009).
Informativeness tends to be one of the antecedents of the effective advertising campaigns in various media. Studies have found informativeness to be important in the formation of consumer attitudes to television advertising (Resnik & Bruce, 1977) and to SNS (social networking services) advertising (Taylor, Lewin &Strutton, 2011)
The paper of Gao and Koufaris (2006) extends Ducoffe's (1995; 1996) research on consumer attitude toward advertising in the traditional media to user attitude toward commercial websites. They found out that informativeness has a significant positive effect on the attitude towards the site and informational content plays important role for the consumers.
Lee and Hong (2016) revealed that informativeness and advertising creativity were key drivers of favorable behavioral responses to ad from social networking sites and that intention to engage in favorable user responses was positively associated with purchase intention. Therefore, we propose that:
Hypothesis 1: Informativeness of an ad is positively associated with the perceived value of
an ad.
The influence of favorable consumer attitudes toward advertising on the perceived value of an ad
MacKenzie and Lutz (1989) studied the effect of the attitude toward advertising on attitude towards specific advertisements. That’s why it is possible to hypothesize that attitude toward advertising has an influence on the perceived value of an ad.
Certain groups of people are less positive to the advertising and therefore find less value in ads. Moreover they stated that increase of ad value can improve the overall attitude of public towards it.
19
Some studies focused on the attitude toward special types of advertising. Jun and Lee (2007) found out that the more consumers have favorable attitudes toward mobile advertising, the more they have positive attitudes toward behavioral intention. The other researchers focused on the cultural differences in the attitudes to ads. (Altuna & Konuk, 2009)
According to Tsang, Ho and Liang (2004) there is a direct relationship between attitudes and behavior. Consequently, we propose that:
Hypothesis 2: Favorable consumer attitudes toward advertising are positively associated
with the perceived value of an ad.
The influence of ad entertainment on the perceived value of an ad
Pleasant and likable advertising tends to affect brand attitude positively, thus entertainment is named an important positive source of advertising value for consumers (Ducoffe, 1995). Entertainment of an ad was examined in various contexts, for instance Jung, Min and Kellaris (2011) found out that consumer reactions to online ads vary according to levels of entertainment value. They proved that more favorable brand attitudes and more positive purchase intentions are formed when consumers are exposed to an ad that generates a high level of entertainment value.
According to Gao and Koufaris (2006) perceived entertainment is positively related to the attitude towards the site. The results of study show that consumers strongly appreciate the entertaining experience, which is a source of value for them and influence their purchase decisions. Therefore, we propose that:
Hypothesis 3: Entertainment of the ad is positively associated with the perceived value of
an ad.
The influence of ad credibility on the perceived value of an ad
Practitioners and academicians agree that building credibility or trust on consumers’ side is important among all kind of media. The ads that are presenting the overall true picture of the product are more trustful to consumers, thus they influence on the attitude toward the ad. Erdem, Swait and Valenzuela (2006) found that brand trust, which is also evaluated as credibility by the consumers, is a primary determinant of brand loyalty. Golsmith et al.
20
(2000) claimed that there is a strong impact of endorser and company credibility on attitude towards the ad, attitude toward the brand and purchase intentions, that’s why it is important to maintain a strong credibility reputation for brands among consumers. Choi and Rifon (2002) pointed that credibility perceptions play an important role in the development of ad/brand attitudes and purchase intent, as it determines how believable the ad is. The results of the study by Zha Li and Yan (2014) indicate that perceived informativeness, perceived entertainment and credibility contribute to the formation of attitude towards web advertising, which further impacts web advertising usage for getting information. Thus, we propose that:
Hypothesis 4: Credibility of an ad is positively associated with the perceived value of an
ad.
The influence of the perceived value of an ad on purchase intention
According to Ducoffe (1996) the more relevant ads are the ones that have the higher ad value. Zeng et al. (2009) view the informative characteristic of advertising as the one that brings more value to the ad. The authors hypothesized that there is a positive relation between the perceived ad relevance and perceived ad value. After that perceived ad value is influencing positively on the behavioral intentions to advertising in online social networking communities. That’s why in order to achieve positive responses from the consumers both perceived relevance and value of advertising should be taken into the account.
There is still place for potential research, for example, Ducoffe (1995) suggested that the further research should be done in order to see the influence of the ad value on the marketplace performance (the more valuable the ad is, the higher the probability of purchase will be).
Tsang et.al (2004) investigated the relationship among attitude, intention and behavior in the sphere of mobile advertising and concluded that attitude is positively related to the intention to receive mobile ads. For instance, for mobile advertising consumer attitudes are directly connected to behavioral intentions, such as getting free coupons, calling back, sending text messages, visiting specific shops, and allowing ad messages (Jun & Lee, 2007).
21
Hyun, Kim and Lee (2011) investigated the relationship between emotional responses to advertising, perceived value and behavioral intentions in the chain industry restaurant context. They found out that such dimensions of advertising, as relevant news, stimulation, empathy and familiarity, have a greater impact on the emotional responses. Moreover, experiencing pleasant feelings from advertising, consumers tend to influence the perceived value and the probability of actual act of consumption is higher.
Nagar (2013) in his study examined attitude toward one specific kind of advertising, such as green advertising, as a potential antecedent of brand trust and whether brand trust affects brand loyalty. Hence, we propose that:
Hypothesis 5: Perceived value of an ad is positively associated with the purchase
intention.
The influence of the perceived value of an ad on brand image
The consumers’ perceptions of the value of advertising have hardly been studied. Some studies focus on the emotional response to advertising (Stout & Leckenby, 1986), others concentrate on the importance of social factors in consumers’ perceptions about advertising (Zeng et al., 2009) and behavioral responses towards it (Wanga & Sun, 2010). Some research about it points out that generally consumers show positive reactions to the informational value of advertising (Mehta, 2000). Moreover, in order to measure the worth of advertising for the consumers was introduced the concept of the perceived value of an ad (Ducoffe, 1995). This author defines advertising value as a subjective evaluation of the relative worth or utility of advertising to consumers. It is interesting to look on the value of advertising from the consumers’ point of view, because it will bring more understanding to the issue of how advertising basically works.
As for the definition of an image, it can be considered a cultural synthesis that, even referring to an external object, transcends it, associating the object to a subject’s experiences, impressions, values, beliefs and aspirations (Dobni & Zinkhan, 1990). Yoon and Park (2012) for instance focused in their studies on the question, whether sensory ad appeals influence brand attitude. They also found out that the consumer, who emotionally identifies with sensory stimuli, has a more positive response. Thus, self-referencing and positive effect increase positive brand attitude. Therefore, we propose that:
22
The influence of purchase intention on word-of-mouth
Several researchers have investigated the topic of behavioral intentions. This way, Zeithmal et al. (1996) divided behavioral intentions into favorable and unfavorable. Moreover they consider three categories of behavioral intentions: word-of-mouth communications, intentions to switch and decision to switch.
It is argued, that the concepts of purchase intention, brand loyalty, positive word of mouth are highly connected. According to Wong, Kwok and Lau (2015) brand loyalty is favorably related to positive word-of-mouth behavior. So, the more loyal customers are, the more likely they spread the positive word of mouth. Topcu and Duygun (2015) investigated this issue conversely and proved in their research that customer loyalty has a statistically negative impact on negative word of mouth communication intention and statistically positive impact on repurchase intention.
Therefore it is relevant to investigate if there is the strong correlation between the intention to purchase and afterwards to share the experience. Hence, we propose that:
Hypothesis 7: Purchase intention is positively associated with the WOM.
The influence of brand image on brand equity
Some researchers on brand equity pointed out that creation of positive brand image and attitude should enhance its development (Aaker, 1991). This author claimed that brand image is a part of brand equity, along with brand loyalty, brand awareness, perceived quality, and other brand assets. Other authors believe that the number of positive brand associations vary between high equity brands and low-equity ones (Keller, 1993). Brands with high levels of awareness and strong, favorable and unique associations are high equity brands. Moreover, Lassar, Mittal and Sharma (1995) found a connection between premium prices and brand image ratings. Therefore, the more favorable the brand image is in mind of consumers, the more probable it will enhance brand equity.
Brand equity has been defined and measured by different researchers in different ways. There are 3 types of brand equity measures: customer mindset measures, brand performance measures, and shareholder value measures (Keller & Lehmann, 2003).
Gill and Dawra (2010) stated that brand image is acting as a mediator between the brand awareness and brand equity, that’s why it is important for the managers while building
23
brand equity, first build brand awareness and only then focus on strengthening brand image. Consequently, we propose that:
Hypothesis 8: Brand image is positively associated with the brand equity.
The influence of purchase intention on brand equity
Sheth (1968) in his factor analytic model for finding individual-level brand loyalty considered loyalty as the frequency and the pattern of purchases made by the consumer. Brand equity has been frequently suggested to represent multidimensional biased or enhanced choice behavior and willingness of the consumer to pay premium prices (Aaker 1992; Keller 1993). Faircloth et al. (2001) stated that brand equity arises from the greater brand choice probability, that’s why I hypothesize that purchase intention has a direct influence on the brand equity. Hence, we propose that:
Hypothesis 9: Purchase intention is positively associated with the brand equity.
The influence of brand image on word-of-mouth
Speaking about brand image, consumer is purchasing not just a product, but an image associated to it. Having a strong brand image, the customer would be more likely to select it between the other brands. The consumer perceptions of the brand may influence the high response of yes to the question: Would you recommend the product or service to others? (Aaker, 1993).
Some researchers have investigated the correlation between brand image and customer’s word of mouth and found out the direct relationship between them. (Anggraeni & Rachmanita, 2015). This statement is in line with Hsieh and Li (2008) findings that brand image plays an important role in the buyer’s behavior. According to De Angelis et al. (2012) when consumer has got their favorite brand, the brand message has a stronger influence on consumer comparing to its competitor and more probably will lead consumer to generate WOM. Thus, we propose that:
Hypothesis 10: Brand image is positively associated with the WOM.
Consequently, the following figure presents the theoretical framework proposed which is composed by the ten previous hypotheses.
24
Figure 3 - Conceptual Model
H8
H10
H9
H6
H5
H4
H3
H2
Informativeness FATA Entertainment Credibility Perceived value of an ad Brand image Word of mouth Purchase intention Brand equityH1
H7
25
4. Methodology
4.1. Sampling procedure
The data was collected through self-administered questionnaires collected with the help of Google Forms during the May-August period of 2016. The survey included all the variables relevant to the research question of the effect of how the perceived ad value and its antecedents, influence brand image and how it affects behavioral responses to the advertising, influencing purchase intention, word-of-mouth and brand equity. The variables were identified during the literature review and are measured according through the scales, previously used in the scientific works.
The survey was launched on the social networks (Facebook- for both Belarussian and Portuguese versions, Vkontakte - for the Russian speaking respondents), email and personal contacts. The reach was gained due to the creation of regular posts, sharing by the friends and sending the reminders to the respondents.
We collected 155 answers for the Russian version of the survey and 138 for the Portuguese version.
4.2. Questionnaire development and Pre-test
The initial version of the questionnaire was developed in English and translated after into Portuguese and Russian, the two official languages of the countries, where the study took place.
In May 2016 pilot study was conducted with a sample of 10 users in order to test the comprehension of the questions and answers, and overall relevance of the survey. The pilot study recommended some small modifications, which led to a definitive version in Russian and Portuguese. Moreover the division of questions per several parts was done in order to make it easier for the respondent to focus.
The questionnaire consisted of three sections addressing the following: (1) general attitude towards the advertising (2) opinion towards advertising of the specific brand indicated by the respondent and (3) demographics characteristics. The survey included one question
26
where it was requested to indicate an advertisement he/she has seen lately and write down a name of brand of an advertised product. The responder should answer the next questions regarding the ad of the brand indicated above. Completion of the entire questionnaire was requested with all the questions, marked as compulsory. A copy of the final questionnaire can be found in Appendix.
4.3. Measures
The variables were identified and selected through careful analysis of existing academic literature specific to perceived ad value, its antecedents and influence on the behavioral intentions.
A Likert scale was used to elicit information from 28 items, each addressing selection of the most proper option with regard to the statements on the following five-point scale: 1 = “strongly disagree”, 2 = “disagree”, 3 = “neither agree nor disagree”, 4 = “agree” and 5 = “strongly agree”.
The study was developed based on the following variables:
Table 2 - Variables and its measures
Variable Items Adapted from
Informativeness 1. Advertisements supply relevant information on products.
2. Advertising provides timely information on products.
3. Advertisements tell people about products when they need the information.
Ducoffe, R. H. (1995). How Consumers Assess the Value of Advertising. Journal of Current Issues and Research in Advertising, 17(1), 1-18.
Entertainment 1. Advertisements are enjoyable and entertaining.
2. Advertisements are pleasant.
Ducoffe, R. H. (1995). How Consumers Assess the Value of Advertising. Journal of Current Issues and Research in Advertising, 17(1), 1-18.
27 Continuation of Table 2
Variable Items Adapted from
Credibility 1. I use advertisements as a reference for purchasing 2. I trust advertisements. Tsang, M. M., Ho, S. C., & Liang, T. P. (2004). Consumer attitudes toward mobile advertising: an empirical study. International Journal of Electronic Commerce, 8(3), 65– 78. Favorable consumer attitudes towards advertising
1. I look for advertisements. 2. I pay attention to advertisements. 3. I search for related information about
advertisements.
Zeng F., Huang L. & Dou W. (2009). Social Factors in User Perceptions and Responses to Advertising in Online Social Networking Communities. Journal of Interactive Advertising, 10(1), 1‐ 13. Perceived value of selected ad
1. The ad of the brand selected above (brand X) was useful to me.
2. The ad of the brand selected above (brand X) was valuable to me.
3. The ad of the brand selected above (brand X) was an important source of information to me.
Zeng F., Huang L. & Dou W. (2009). Social Factors in User Perceptions and Responses to Advertising in Online Social Networking Communities. Journal of Interactive Advertising, 10(1), 1‐ 1.
28
Continuation of Table 2
Variable Items Adapted from
Brand image 1. Overall, I think BRAND X is honest. 2. Overall, I think BRAND X is cheerful. 3. Overall, I think BRAND X is
imaginative.
4. Overall, I think BRAND X is up-to-date. 5. Overall, I think BRAND X is reliable. 6. Overall, I think BRAND X is successful. 7. Overall, I think BRAND X is
upper-class.
8. Overall, I think BRAND X is charming. 9. Overall, I think BRAND X is tough.
Aaker, J. L. (1997). Dimensions of Brand Personality. Journal of Marketing Research, 34(3), 347-356.
Purchase intention 1. I consider BRAND X to be my first choice in buying services or products. 2. I would buy more products of BRAND X
in the future.
3. I would consider purchasing the product of BRAND X in the short term.
4. I would consider purchasing the product of BRAND X in the long term.
Zeithaml V. A., Berry L.L. & Parasuraman A. (1996).The behavioral consequences of service quality. Journal of Marketing, 60 (2), 31-46
Word of mouth 1. I would say positive things about BRAND X to other people.
2. I would recommend BRAND X to someone who seeks my advice.
5. I would encourage friends and relatives to purchase BRAND X.
Zeithaml V. A., Berry L.L. & Parasuraman A. (1996).The behavioral consequences of service quality. Journal of Marketing, 60 (2), 31-46
Brand equity 1. Brand X is different from other brands. 2. The fact that the products are of Brand X
certainly adds value.
3. The fact that the products are of Brand X is important to me.
3. I am willing to pay more in order to do buy Brand X.
Chen et al. (2011), Journal of Business Research.
29
4.4. Common method bias
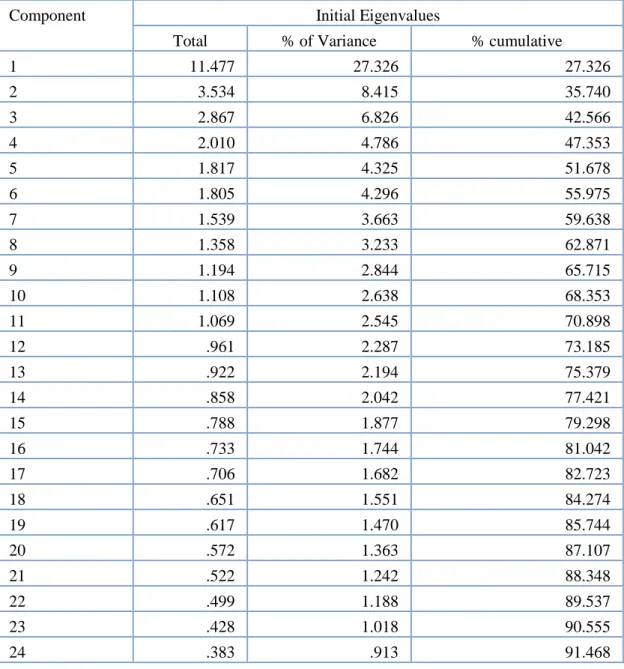
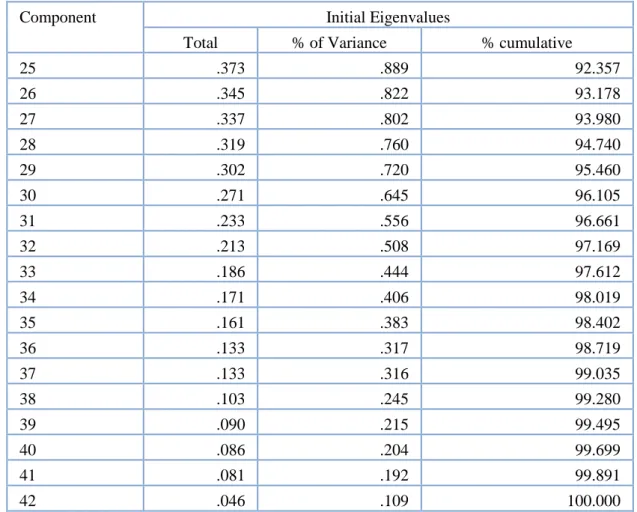
Common method bias stands for the variance that can be explained rather by the instrument than the constructs the measures represent (Podsakoff, MacKenzie, & Lee, 2003). In our study it was tested through the exploratory factor analysis, which is one of most used methods. The results show that the first factor explains 27% of the variance in the Portuguese and Belarussian samples. As we can see in the Table 3 and Table 4, there is no single factor that explains the majority of the variance of the results in Portuguese and Belarussian samples, as none of the factors has a variance superior to 50%. That’s why we can conclude that there is no common method bias in our study.
Table 3 - Common Method Bias – Portuguese Sample
Component Initial Eigenvalues
Total % of Variance % cumulative
1 11.477 27.326 27.326 2 3.534 8.415 35.740 3 2.867 6.826 42.566 4 2.010 4.786 47.353 5 1.817 4.325 51.678 6 1.805 4.296 55.975 7 1.539 3.663 59.638 8 1.358 3.233 62.871 9 1.194 2.844 65.715 10 1.108 2.638 68.353 11 1.069 2.545 70.898 12 .961 2.287 73.185 13 .922 2.194 75.379 14 .858 2.042 77.421 15 .788 1.877 79.298 16 .733 1.744 81.042 17 .706 1.682 82.723 18 .651 1.551 84.274 19 .617 1.470 85.744 20 .572 1.363 87.107 21 .522 1.242 88.348 22 .499 1.188 89.537 23 .428 1.018 90.555 24 .383 .913 91.468
30
Continuation of Table 3
Component Initial Eigenvalues
Total % of Variance % cumulative
25 .373 .889 92.357 26 .345 .822 93.178 27 .337 .802 93.980 28 .319 .760 94.740 29 .302 .720 95.460 30 .271 .645 96.105 31 .233 .556 96.661 32 .213 .508 97.169 33 .186 .444 97.612 34 .171 .406 98.019 35 .161 .383 98.402 36 .133 .317 98.719 37 .133 .316 99.035 38 .103 .245 99.280 39 .090 .215 99.495 40 .086 .204 99.699 41 .081 .192 99.891 42 .046 .109 100.000
Extraction Method: Principal Component Analysis
Table 4 - Common Method Bias – Belarussian Sample
Component Initial Eigenvalues
Total % of Variance Cumulative %
1 11.611 27.645 27.645 2 3.546 8.442 36.087 3 2.989 7.117 43.204 4 2.036 4.847 48.051 5 1.866 4.444 52.495 6 1.671 3.978 56.473 7 1.535 3.655 60.128 8 1.287 3.064 63.192 9 1.176 2.800 65.992 10 1.091 2.597 68.589 11 1.046 2.491 71.080 12 .934 2.224 73.304 13 .925 2.202 75.506 14 .863 2.055 77.561
31
Continuation of Table 4
Component Initial Eigenvalues
Total % of Variance Cumulative %
15 .813 1.936 79.497 16 .758 1.805 81.301 17 .703 1.674 82.975 18 .661 1.573 84.549 19 .619 1.474 86.023 20 .581 1.384 87.406 21 .504 1.200 88.607 22 .503 1.197 89.804 23 .410 .977 90.781 24 .384 .915 91.696 25 .355 .845 92.540 26 .337 .803 93.343 27 .322 .766 94.109 28 .315 .750 94.860 29 .296 .706 95.566 30 .236 .563 96.129 31 .224 .534 96.663 32 .210 .499 97.162 33 .186 .442 97.604 34 .170 .405 98.009 35 .157 .375 98.384 36 .139 .331 98.715 37 .129 .307 99.022 38 .106 .252 99.274 39 .091 .217 99.491 40 .086 .206 99.696 41 .080 .190 99.886 42 .048 .114 100.000
32
4.5. Non response bias
In order to test for non-response bias, were compared early and late respondents (defined as the first 75% and last 25% to return questionnaires, respectively) on all key constructs measures of the theoretical model, in both Portuguese and Belarussian samples (Armstrong & Overton, 1977). No significant differences between early and late respondents were found.
4.6. Sample profile
The Portuguese sample consists of 60.14% of female and 39.86% of male (Graph 1). We can conclude that there is a relative balance between genders.
Graph 1 - Portuguese Sample Profile by Gender
60,14% 39,86%
Female Male
33
The majority of respondents, namely 49.38% belong to the 18-30 age group, following by the age group 31-40 with 26.09% of the sample (Graph 2).
Graph 2 - Portuguese Sample Profile by Age
Considering the level of education of the Portuguese sample, 46.38% of it possesses bachelor degree, 18.84% have master degree and 13.77% obtained Phd. We can see that secondary and secondary professional education corresponds to 17.39% and 3.62% respectively (Graph 3).
Graph 3 - Portuguese Sample Profile by the Level of Education
We also verify the most common media, where the ad selected and indicated by the respondents was seen. On the Graph 4, we can see that the majority of respondents
<18 18-30 31-40 41-50 51-60 2,17% 49,28% 26,09% 15,22% 7,25% Secondary education Secondary professional education Bachelor Master Phd 17,39% 3,62% 46,38% 18,84% 13,77%
34
(59.42%) indicated TV as the source of an ad, following by Internet with 27.54%, newspapers- 4.35%, outdoor- 2.9% and other, which includes supermarkets, brochures and radio with 5.80%.
Graph 4 - Media of Selected Ad in Portuguese Sample
The Belarussian sample comprises of 56.13% of female and 43.87% of male, which can be considered as balanced profile by gender (Graph 5).
Graph 5 - Belarussian Sample Profile by Gender
59,42% 27,54% 2,90% 4,35% 5,80% Tv Internet Outdoor Newspaper/ magaizine Other 56,13% 43,87% Female Male
35
Graph 6 - Belarussian Sample Profile by Age
More than half of respondents (67.10%) belong to the age group of 18-30 years, followed by the age group 31-40 years, which corresponds to 14.84%. As we can see on the Graph 6 other age groups have considerably lower amount of respondents.
Graph 7 - Belarussian Sample Profile by the Level of Education
Speaking about the level of education in the Belarussian sample, the majority has a higher education (76.13%). It is important to notice that 9.68% have a master degree and only 0.65% - a Phd (Graph 7). <18 18-30 31-40 41-50 51-60 >60 0,65% 67,10% 14,84% 5,81% 6,45% 5,16% Secondary education Secondary professional education Bachelor Master Phd 7,10% 6,45% 76,13% 9,68% 0,65%
36
Graph 8 - Media of Selected Ad in Belarussian Sample
The Graph 8 shows that the majority of Belarussian consumers have seen the indicated advertising on TV (41.94%) and in Internet (31.61%). Fifth part of respondents indicated outdoor advertising as a medium of selected ad. Newspapers and others correspond to 4.52% and 1.94 respectively. 41,94% 31,61% 20,00% 4,52% 1,94% Tv Internet Outdoor Newspaper/ magaizine Other
37
5. Data Analysis
5.1. Descriptive analysis
In order to understand the content of each variable and its items, descriptive analysis of the measurements was performed. We indicate the mean and standard deviation for each variable, calculated with the help of Statistical Package for the Social Sciences (SPSS). Moreover the internal consistency of the variables was verified with the help of Cronbach’s Alpha. The Cronbach’s Alpha evaluates how well a block of indicators measure their corresponding latent construct. The internal consistency measure is based on the correlation between different items to measure the same construct.
As we can see from the Table 5 and Table 6, most of the variables have Cronbach’s Alpha’s values over 0.7, indicating that the internal consistency is acceptable (Churchill, 1979). Some investigators also stated that values superior to 0.6 are also acceptable and demonstrate variable consistency (Hair, Black, Babin, Anderson, & Tatham, 2009; Malhotra & Birks, 2000). That’s why the results show that the measurements used in the study are valid for both Portuguese and Belarussian samples, since they are all over 0.6. The values for the Portuguese market are the following: entertainment α= 0.770; informativeness α= 0.784; credibility α= 0.719; favorable consumer attitudes towards advertising α= 0.864; perceived value of the selected ad α= 0.887; brand image α= 0.926; purchase intention α= 0.929; word of mouth α= 0.959; brand equity α= 0.881.
While the values for the Belarussian market: entertainment α= 0.891; informativeness α= 0.656; credibility α= 0.704; favorable consumer attitudes towards advertising α= 0.742; perceived value of the selected ad α= 0.904; brand image α= 0.881; purchase intention α= 0.847; word of mouth α= 0.916; brand equity α= 0.746.