Access to the Public Debt Market
Effect on Corporate Leverage:
Evidence from the US
Maria Kostyunina
152114225
Dissertation written under the supervision of Professor Diana
Bonfim
Dissertation submitted in partial fulfilment of requirements for the MSc in
Business Administration, at the Universidade Católica Portuguesa,
Abstract of the thesis
Access to the Public Debt Market Effect on Corporate Leverage: Evidence from the US
By
Maria Kostyunina MSc in Business Administration
CATÓLICA-LISBON School of Business and Economics, 2016 Supervising Professor: Diana Bonfim
This study addresses the research question largely underestimated in the previous empirical works: how supply-side constrain factors influence firms’ financing opportunities and capital structure. In particular, it examines the effect of firms’ access to the public debt market estimated by the possession of a credit rating on firms’ leverage level. Findings show that after controlling for demand-side determinants of firms’ demand for debt, firms that have a credit rating are 1.8% up to 2.5% more levered than firms without a credit rating. Furthermore, this study’s findings suggest that the impact of firms having access to the public debt market – on firms’ leverage is time variant and is particularly sharp and significant during the years of economic downturn. During the economic crisis of the year 2000 and the most recent financial crisis of 2008 firms with a credit rating were up to 9 – 10% more levered than non-rated firms, at 1% significance level.
Resumo da tese
Este estudo retrata uma questão que é largamente debatida noutros trabalhos empíricos: como os fatores de restrição do lado da oferta influenciam as oportunidades de financiamento das empresas e da sua estrutura de capital. Em particular, examina o efeito do acesso das empresas ao mercado de dívida pública estimando se estas possuem um rating de crédito sobre o nível de endividamento das empresas. Com este estudo, conseguiu-se demonstrar que ao controlar os determinantes da procura de dívida das empresas do lado da procura, as empresas que possuem um rating de crédito encontram-se mais endividadas, aproximadamente, entre 1.8% até 2.5%, que as empresas que não têm rating de crédito. Além disso, os resultados demonstraram que o impacto, ao nível do endividamento, nas empresas que têm acesso ao mercado de dívida pública é variável consoante o período de tempo e é, particularmente, severo e significativo durante os anos de recessão económica. Durante a crise económica de 2000 e, também, na recente crise financeira de 2008, com 1% de nível de significância, as empresas que tinham um rating de crédito eram 9% a 10% mais endividadas que as empresas que não tinham este rating.
Acknowledgement
I would like to thank my supervising Professor Diana Bonfim and my family for their help, support and contribution towards this Master thesis completion.
Table of Contents
Abstract ... 2
Acknowledgement ... 4
Introduction ... 6
Section 1: Literature Review ... 7
Section 2: Methodology ... 12
Section 3: Data Description ... 16
Section 4: Preliminary Data Analysis ... 17
4.A: Credit rating as an Estimation of Public Debt Access ... 17
4.B: Debt Market Access and Leverage ... 19
4.C: Firm Characteristics of Rated and Non-rated Firms ... 21
Section 5: Multivariate Data Analysis ... 24
5.A: Controlling for the Firm Characteristics ... 24
5.B: Controlling for the Industry and Firm Specific Effects ... 28
5.C: Controlling for the Time Effects ... 30
5.D: Controlling for Endogeneity ... 35
Section 6: Limitations ... 40
Section 7: Conclusion ... 41
Reference List ... 42
Introduction
In a perfectly efficient capital market according to Modigliani and Miller theorem, firms should be indifferent about the sources of financing for their projects. The capital structure of the firm is thus solely defined by its demand-side factors and conditions; therefore, implying the underlying assumption of no supply-side inefficiencies influences firms’ capital structure. This underlying assumption is the basis for most of the empirical research works on capital structure.
However, in a real world, firms do face supply-side constrains due to the presence of market inefficiencies such as information asymmetry and investment distortions.
The importance of the supply-side determining factors of the firm capital structure has come to the front of the attention with the recent works of Faulkender and Petersen (2006), Leary (2009), Mitto and Zhang (2008), Houston and James (1996) and Cantillo and Wright (2000), among others. These authors’ findings illustrate the real presence of supply-side constrains on the corporate capital structure with rather significant magnitude and strong statistical power. The above mentioned works illustrated that firms with access to the public debt are up to 35% more levered than firms without access to the bond market. The primary aim of this study is to contribute towards further investigation on how supply- side factors constrain firms leverage, in particular, how corporate leverage is affected by the firms’ access to the bond market. This study contributes towards the existing literature with findings on the most extensive time span considered, covering the most recent data available, from year 1986 till 2014, illustrating evidence from the US.
In this study I address two main research questions: 1) Do firms with access to the public debt market enjoy a greater supply of debt making them highly levered; while firms without access to the public debt market are under levered due to credit supply constrains? 2) Is the impact of firms’ access to the public debt markets on corporate leverage larger and more significant during periods of economic downturn?
The findings of this study are consistent with the empirical literature on this topic. The results show that firms with access to the public debt market indeed have access to a greater supply of debt, being 1.8% up to 2.5% more levered than firms without access to
the public debt; these results are consistent after controlling for all the demand-side factors. In turn, firms without access are under levered due to credit supply constraints. Furthermore, I found that the impact of access to the public debt market on firms’ leverage increases largely during the years of economic downturn. This increase was heightened during the economic crisis of the year 2000 and during the most recent financial crisis of 2008, when firms with access to the public debt showed to be up to 10% and 9% more levered than those without access respectively.
The rest of the study is organized as follows: I start with the empirical literature review in Section 1 that is followed by the detailed explanation of the methodology used, in Section 2; then, I proceed with the data description in Section 3 and preliminary data analysis discussion in Section 4; Section 5 presents the regressions analysis results and their interpretation; Section 6 tests the regression models and mitigates potential endogeneity problems; the limitations of this study are detailed in Section 7; and Section 8 concludes. Section 1: Literature Review
According to Modigliani and Miller theorem, in perfectly efficient capital market, firms should always be able to finance all the projects with positive NPVs and they should be indifferent about the sources of financing.
However, in a real world, the assumptions of Modigliani and Miller theorem do not apply. Due to the information asymmetry, the evaluation process of the firm quality and the potential of its projects by outside investors becomes a complicated and resources- requiring process; thus, firms are not always able to fund all their projects. This creates market frictions that lead to the different financial institutions being established as different sources of financing (Faulkender and Petersen, 2006).
Among equity and debt financing choice, the recent US evidence suggests that today debt is the prioritized financing channel to raise external funds. With reference to the Federal Reserve System database, additional funds raising via net new issues of equity became rather insignificant in the past two decades, while corporate borrowing became the leading source of external financing (Denis, 2003). Additional debt financing is presented in three main forms: private debt – banks, non-bank private lenders and public debt. The choice of
financing via debt sources is evaluated based on the influence of these factors: information asymmetry, efficiency of debt renegotiation and the agency costs of debt (Denis, 2003). Private debt sources, majorly presented by banks, show to be more efficient than other sources of financing in tackling information asymmetry. The efficiency of private debt financing could be attributed to a number of factors namely: the individual approach; the strong interaction of parties over time and across operations; the resource and opportunities available to research and screen firms’ performance. Therefore, private lenders acquire better monitoring efficiency than arm’s-length investors (Denis, 2000; Faulkender and Petersen, 2006).
Therefore, if ex post monitoring raises the probability of successful financing for the firm, then private debt might be a favorable source of capital (Diamond, 1991).
Following this rationale, “Firms with a higher degree of information asymmetry will borrow privately, while firms with lower information asymmetry prefer public debt” (Denis, 2003).
Another factor that makes private lending more beneficial when comparing to the public debt is banks’ better ability at restructuring firms that are in financial distress: financial intermediaries are more efficient in liquidation and renegotiation of the firms (Cantillo, Miguel and Julian Wright, 2000; Rajan, 1992; Denis, 2003; Faulkender and Petersen, 2006).
However, there are some downsides that firms may be facing when relying on private debt financing.
Monitoring and screening by the financial intermediary are rather costly, as well as the bank regulatory taxes; in fact, these costs can potentially overlap the aforementioned benefits of private forms of financing (Houston and James, 1996). Moreover, there is empirical evidence of managerial discretion taking place with banks’ borrowing practices (Denis, 2003). Due to the extensive access to the firms’ information, private lenders have much greater influence on the managerial decision making of the firm, and impose higher pressure. Financing via private debt results in risks of rent extractions and management incentives distortions (Gilson and Warner, 1998; Rajan, 1992; Denis, 2003).
Another potential issue is that obtaining bank debt is more constrained: debt maturities are shorter relative to public debt and contract restrictions are stricter. These constraints can avert managers from investing in all their good projects, leading to potential value- reduction of the firm (Houston and James, 1996; Gilson and Warner, 1998).
In turn, renegotiation of the terms’ restrictions becomes difficult if bank lenders hold monopoly power over borrowers. The impact of less financial flexibility and higher transaction and opportunity costs for the firm is large enough to potentially offset the benefits (Gilson and Warner, 1998; Houston and James, 1996; Rajan, 1992). In the context of alternative arguments, public debt becomes a more preferable source of financing when compared to the private debt as it limits banks monopolistic power; therefore, public debt financing can increase the investment efficiency (Houston and James, 1996; Rajan, 1992). Public and private debt both have their own costs and benefits over each other. However, what is critical, many researches claim that joint financing from private and public sources of debt can significantly improve overall investment incentives. (Houston and James, 1996; Diamond, 1991). By balancing capital structure of financing through private with the public debt borrowing, firms are able to smooth the downsides of private debt borrowing. The combination of private financing with public debt borrowing limits banks’ control over liquidation decisions as well as banks’ information monopolies over firms (Houston and James, 1996; Diamond, 1991; Rajan, 1992).
Houston and James (1996) found that dependence on private debt is positively associated with the growth opportunities for the sample of firms with the public debt outstanding. This finding suggests that firms that source their financing from several different types of lenders face less information asymmetries.
Krishnaswami and Spindt (1999) showed that firms which experience higher contracting costs tend to have a greater proportion of bank debt in their capital structure. They do not find any strong evidence that firms who possess positive private information on expected future performance chose more private debt. However, this type of firms that also faces greater information asymmetry conditions indeed prefers bank debt financing.
Other empirical literature findings suggest a non-monotonic relationship between the quality of the firm performance and the source of debt. According to Diamond (1991) and Rajan (1992) firms with a high credit quality tend to issue more public debt, while firms of a medium credit quality tend to borrow from the bank. Low credit quality firms face higher costs of monitoring and screening that offset the benefits of bank borrowing; therefore, they tend to issue public debt (Denis, 2003; Matteo Arena, 2011).
The resulting evidence of balancing public and private debt forms of financing has been analyzed and explained in the empirical literature majorly in context of firms’ preferences for the form of debt financing. This implies the Modigliani and Miller assumption of infinitely elastic capital supply, which means that the resulting firm leverage level is defined exclusively by the firm demand for debt (Faulkender and Petersen, 2006; Leary, 2009; Judge and Korzhenitskaya, 2011).
However, in reality supply is not infinitely elastic; lenders are able to ration firms both in terms of pricing and debt availability. Due to market frictions including information asymmetry and investment distortions, the supply-side factors define firms’ leverage in addition to the demand side factors.
Supply-side constrains, as factors defining firms leverage, have been under-studied in most of the existing empirical literature around capital structure until recently.
Titman (2002), survey Graham and Harvey (2001) and Graham and Leary (2011) evidence suggests that practitioners view supply conditions as important inputs to the capital structure decision.
One of the most fundamental works on this topic – Faulkender and Petersen (2006) – showed that firms that have access to the public debt market, as measured by having a debt rating, have significantly more leverage. This study results claim that firms with access to the public debt market were 35% more levered than firms with no access to the bond market. Furthermore, study results suggest that 78% of outstanding debt was issued by firms with a public debt rating. The illustrated magnitude of influence of access to the bond market showed to be statistically significant. The illustrated effects hold even after
controlling for the demand-side factors: firms’ characteristics, industry and firm specific effects and controlling for potential endogeneity problem.
Mitto and Zhang (2008) compared in their study the capital structure of MNCs in Canada versus in the US and showed that Canadian firms with access to global bond market have about 6 percentage points higher leverage than firms with no access.
Kisgen (2006) analyzed whether there is a direct effect of cost/benefits of credit rating possession by a company on firms financing decisions via debt and equity and defined relative costs and benefits of different credit rating grading. The results of the study showed that credit rating possession of any relative grade in total influences all firms. He found that companies with a rating have access to broader sources of debt financing, and as a result have higher leverage ratios compared to unrated firms.
Leary (2009) studied leverage differences between the firms with and without access to the bond market. The author findings’ present evidence of a negative correlation between the leverage differences among these firms and their loan supply over a sample period of 30 years. His research showed strong association of the level of leverage changes with the credit supply constrains that firms are facing; thus, large firms exhibit a greater reliance on public debt source of financing during periods of tight credit conditions.
The study of Judge and Korzhenitskaya (2011) investigated the effect of having credit rating on firms’ leverage, with evidence from the UK. These authors found consistent results with Leary (2009). They showed that after controlling for demand-side factors determining leverage, firms with access to the bond market turn to be up to 10% more levered than those without access to the public debt.
Another interesting finding on the public debt market access influence over the corporate leverage is the time effect, in particular during the time periods of economic downturn. According to the existing empirical literature, firms with access to the public debt market – measured by the possession of a credit rating – suffer less from lack of financing and credit supply constrains during the adverse economic conditions than firms without access to the bond market (Judge and Korzhenitskaya, 2011).
During the most recent financial crisis, 2007-2009, US bank lending decreased significantly and consistently across all types of loans by 47% during the peaks. Moreover, the terms and conditions of private debt borrowing have tightened significantly (Ivashina and Scharfstein, 2009). In these conditions of credit supply shrinking, nearly all firms were affected adversely. However, empirical findings show that heavily bank dependent firms without public debt suffered the most (Campello, Giambona, Graham and Harvey, 2009; Kisgen, 2007; Leary, 2009).
In particular, they show that credit constrained firms experienced 22% more cuts in planned R&D, 11% larger decrease in employment and 9% less capital spending. Evidence on the most recent financial crisis of the year 2008 suggested that 86% of CFOs in the US confirmed that the investment in attractive projects was limited (Campello, Giambona, Graham and Harvey, 2009).
Section 2: Methodology
The research question of this study was largely under-estimated and under-considered in the existing literature until recently; thus, there are only a few existing works directly studying the effect of bond market access constrains on corporate leverage. Therefore, this study will largely follow the best-defined and structured existing methodology of the work of Faulkender and Petersen (2006), supported with the complementing methodology of Judge and Korzhenitskaya (2011) and Leary (2009).
In order to evaluate whether bond market supply constrains refrain firms from the optimal level of debt in their capital structure, we have to assess the effect of the supply-side constrain factors relative to the firms’ level of leverage. Following the existing studies methodologies and the rationale, supply-side constrain factor, experienced in the form of the access/lack of access to the public debt market, will be measured by the possession of a credit rating by the firm (Faulkender and Petersen, 2006; Mitto and Zhang, 2008). While the level of leverage will be measured by the gross total debt to the market value of assets (Faulkender and Petersen, 2006; Leary, 2009).
The empirical analysis of this study proceeds as follows: in Section 3 we present the general description of the panel data of this study. This is followed by the two stage data analysis: univariate and multivariate. Section 4 presents the preliminary univariate data analysis, which encloses the preliminary analysis of the credit rating possession in the considered data sample and the breakdown of the observed differences in firms’ leverage between firms with access to the bond market and without access to the bond market. After, we proceed with the examination of drivers and explanatory factors of the observed relationship between bond market access and firm leverage identified and stated in Section 4.
Section 5 represents the multivariate analysis, where we will address our first and second research questions: if there is an effect of public debt access on the level of leverage and if this effect is time variant, therefore extending our research analysis while controlling for the several effects, such as: firm characteristics, industry and firm specific effects and finally - time effect, in order to clearly distinguish and observe the economical and statistical impact of the drivers of firms’ leverage observed.
The multivariate investigation is based on the regression analysis, run throughout the article, which is aimed to clearly distinguish between demand and supply factors driving the results of the firms’ level of leverage in order to analyze the economical and statistical significance of the supply side constrains on firms’ leverage in particular.
The overall level of leverage held by a firm is a result of the equilibrium point of the amount of leverage demanded by the firm and the amount of debt available for the firm on the market – supply of debt, at a given price, therefore the observed level of leverage of a given firm is expressed in the equation 1 below; where under the Xdemand factors we will consider the set of firms demand for leverage determinants, while Accessthe Bond market is used as an estimator of the credit supply constrains faced by the firm - Xsupply factors variable (See equation 2).
Leverageobserved = β1 Xdemand factors + β2 Xsupply factors+ ε (1)
Therefore, in the following sub-section of Section 4, we will consider different demand- side factors potentially determining firms’ choice of leverage in order to distinguish them from the total effect; therefore, to separate and analyze the supply-side impact magnitude and significance.
As follows, in Section 5.A, we run the regression analysis controlling for a set of the firm characteristics under the Xdemand factors - variable (See equation 3).
Leverageit = a0 + a1 CreditRating +
β
1Size
it + β2 Profltyit + β3 AssetTangit + β4 MtBit + β5 R ∧Dit + β6 AssetVoltyit + β7 EqtyReturnit +a1 Year Dummy+ εit (3)
β
8DebtMatutryi
it + β9 TaxPaid it + Where CreditRating – is a credit rating dummy, a set of Xdemand factors firm-specific control variables: firm size, profitability, asset tangibility, market-to-book ratio, asset volatility, equity returns of the previous year, debt maturity, marginal tax rate, Year Dummy – each year dummy variable and εit – an error term.The estimation technique used in this regression analysis – fixed effects estimation model for panel data (Wooldridge, 2001).
In Section 5.B we proceed further with the regression analysis, controlling for the industry and firm specific effects that can also potentially define the observed leverage from the demand-side (See equations 4 and 5 respectively).
Leverageit = a0 + a1 CreditRating+ βn Xit + a2 IndustryDummy + a3 YearDummy+ εit (4)
Leverageit = a0 + a1 CreditRating+ βn Xit + a2 FirmDummy + a3 YearDummy+ εit (5) Where CreditRating – is a credit rating dummy, Xit – is a vector of firm-specific control variables ((firm size, profitability, asset tangibility etc.), Industry Dummy – per industry dummy variable, Firm Dummy- per firm dummy variable, Year Dummy – each year dummy variable and εit – an error term.
The estimation model applied in this regression analysis is different from the previous one, the most relevant model for the panel structure data analysis for between industries or firms’ effects, that allows to take into account the unobserved heterogeneity at the firm level and produce robust outcome – random effects model is used (Wooldridge, 2001). In Section 5.C we will address the second research question of this study and test the hypothesis of the inconsistent significance and magnitude of access to the bond market on the firms’ leverage, dependent on the phase of the economic cycle. Hence, we run regression analysis controlling for the time effect, to distinguish from the total effect whether the impact of having access to the public debt market on leverage varies over the sample period of time (See equation 6).
Leverageit = a0 + a1 CreditRating+ βn Xit + a2 CreditRating* Yearit + εit (6) Where CreditRating – is a credit rating dummy, Xit – is a vector of firm-specific control variables: firm size, profitability, asset tangibility etc.; interaction terms between credit rating and year dummies and εit – an error term.
Same as in the Section 5.A, in order to address the unobserved effects of the panel structure of the sample data, fixed effects estimation model was applied.
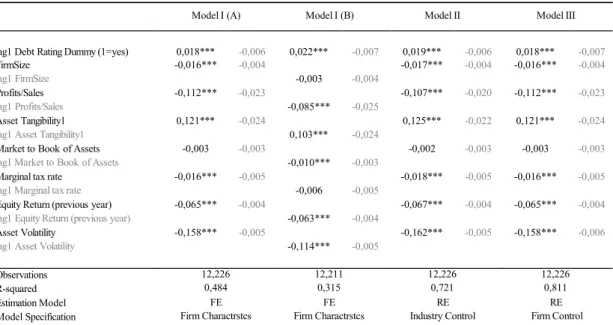
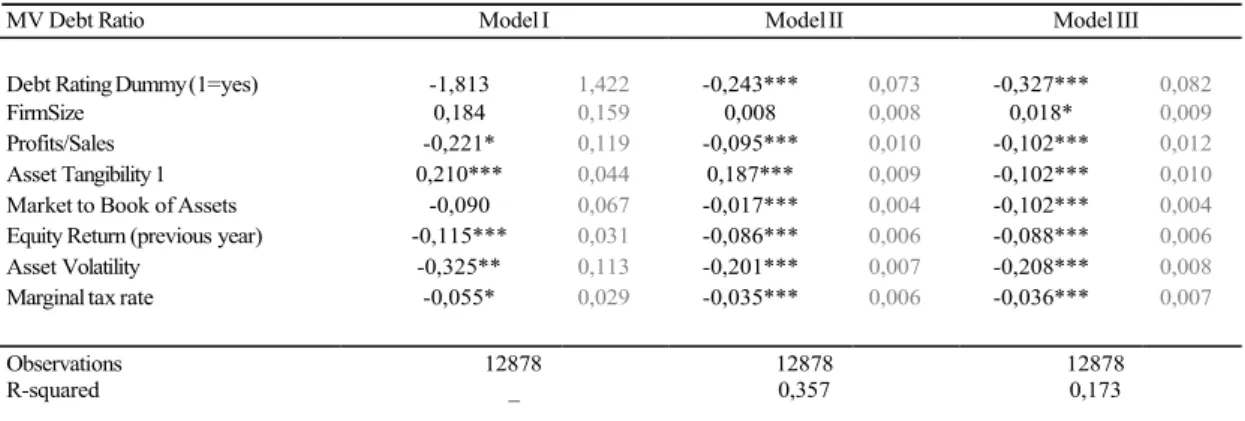
In order to enhance the robustness of the obtained results so far, we proceed further with Section 5.D. In this section we will consider the potential endogeneity problems of simultaneity and uncontrolled confounding variable, according to which, as referring to the empirical literature on the similar research works, it might be affecting the results obtained (Faulkender and Petersen, 2006; Judge and Korzhenitskaya, 2011).
In order to mitigate the problem of potential presence of endogeneity, affecting our results, we applied the lagged variables estimation technique (See equations 7 and 8).
Leverageit = a0 + a1 lag1 CreditRating+ βn Xit + a3 Year Dummy+ εit (7)
Where lag1 CreditRating – is a credit rating dummy lagged by 1 time period, lag1 Xit –
is a vector of firm-specific control variables (firm size, profitability, asset tangibility, etc.) lagged by 1 time period, Year Dummy – each year dummy variable and εit – an error-term. Consistently with Section 5.A, fixed effects estimation model was applied.
Although we proceed with mitigating the endogeneity problem, lagged variables technique does not allow to address the endogeneity problem directly; therefore, we continue in this section with the consideration of the main tool of addressing this problem-instrumental variables approach.
Overall, all the proceeded steps of analysis undertaken in Section 4 will allow to control for all the demand-side determining factors, affecting the choice of level of leverage of the firm, disentangled from the totally observed relationship between credit rating and the firms’ leverage. As a result, we are able to define and analyze supply-side effect only on the level of leverage at every phase, stating quite significant degree of legitimacy and credibility of the results obtained. However, still there are some limitations presented. Therefore, in Section 6 we will cover faced limitations of this study, how they affect the results and therefore consider ways how the further research could be improved.
Section 3: Data Description
Following the methodology of the data selection of the previous studies on public debt access and capital structure of Faulkender and Petersen (2006); Kisgen (2006); Kisgen (2009); Judge and Korzhenitskaya (2011), the total sample of this study employs data for the US listed non-financial firms for the time period of 28 years, from 1986 through to 2014, which is the most extended time period considered comparing to the previous works that start as early as the first years considered by Faulkender and Petersen (2006) and cover all years till the most recent one with full data availability.
Data presented in the sample includes all the firms listed in the S&P 500 in the years between 1986 and 2014 and presented in the listing at least for 3 years, with respect to the data availability from the source – Compustat.
After the original selection, all financial firms, with SIC-industry codes of 6000s, were excluded from the sample, as followed by the previous studies on capital structure (Faulkender and Petersen, 2006; Kisgen, 2006; Judge and Korzhenitskaya, 2011).
This resulted in the sample of 779 companies’ data over the time span from the year 1986 till 2014 inclusively, composing a total panel of 17.365 firm-year observations. Variables, used within this study, are defined based on the existing research on public debt access constrains (Faulkender and Petersen, 2006; Judge and Korzhenitskaya, 2011). Leverage is measured by the firms’ debt-to-asset ratio, based on both market value (MV) and book value (BV) basis and includes both short-term and long-term debt. Access to the public debt market is estimated by whether firm has a credit rating or not, which is measured by the Standard and Poor’s (S&P) overall company’ long-term corporate credit rating.
All financial data on leverage, firm specific characteristics, credit rating and other variables are sourced from Compustat, via Wharton Research and Statistics platform. The complete definitions of all the variables used in this study are presented in the Appendix, Table 8.
Section 4: Preliminary Data Analysis
4.A: Credit rating as an estimation of public debt access
Absence of any consistent database on the corporate data of the debt classification– privately held or publicly traded – is a significant limitation that affected studies and researches on the issue of public debt access.
Due to this refrain factor, most of the preliminary studies on public debt relied on the approximated values: if the firm had a rating on bonds or commercial paper.
Houston and James (1996) and Cantillo and Wright (2000) were the first research works on the source of debt capital that computed an accurate documentation of the type of debt issued by firms. Their findings showed that debt rating and the firms’ having public debt outstanding had a very high correspondence between each other. Very few firms were found to possess a credit rating but no public debt and a very small fraction of firms that did not have a credit rating were found to hold public debt (Cantillo and Wright, 2000).
These findings signal that using credit rating showed to be adequately reliable as a measure of access to the public debt market.
In our sample, out of the total 17,365 firm-year observations, 13,038 firm-years have a credit rating, which is 75% of the total sample panel data. Moreover, the ratio of rated firms to the total sample is rather consistent over the years, with the rated firms ranging from 56- 80% of total sample per year.
Graph 1: Number and percentage of firms with S&P credit rating out of the total sample for the time period of 1986-2014, per year
In the works of Petersen (2006), Mitto and Zhang (2010) and Judge and Korzhenitskaya (2011), only 15-19% of the firms in the sample had access to the public debt markets in a given year, as measured by the existence of a debt rating. That finding is rather inconsistent with the results of the considered data sample in this study.
Our result, on the contrary, indicates that credit rating possession is rather common through-out the 28 years considered and smoothly distributed with the average of 70% of firms having a credit rating per year.
Despite the inconsistency of our finding with the previous studies, this finding is rational due to the original selection terms for the sample, where all the firms were rationed as publicly traded (See Graph 1).
Number of firms with S&P Credit Rating between years 1986-2014
600 100% 90% 500 80% 400 70% 60% 300 50% 40% 200 30% 100 20% 10% 0 0%
# of Rated Companies % of Rated out of Total Sample
4.B: Debt market access and leverage
The intention of this study is to focus on the previously largely under-covered factor affecting capital structure of the firm – supply side constrains, in particular how access or lack of access to the public debt market affects firms leverage.
At first, to assess public debt market access importance in affecting leverage, I have distinguished between firms with public debt access (measured by having a credit rating) and those without access and compared their leverage at different levels (See Table 1, Section A).
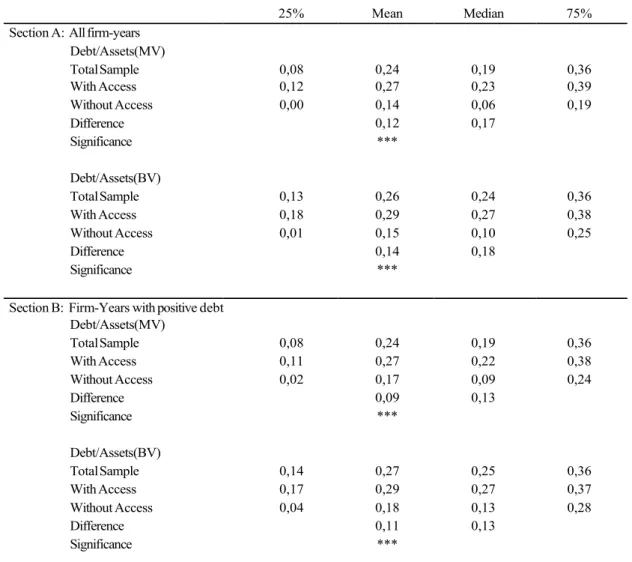
From the summary statistics, Table 1, Section A it is clearly visible that firms with access are largely more leveraged than those without access, independently of the basis of the leverage estimation: market value or book value and the difference between the samples leverage is statistically significant at 1% level. According to the mean values, firms with access are twice more levered than those without access, possess 3.8 times larger median of MV debt ratio and 2.7 times larger median of BV debt ratio.
In Section A of Table 1, the total sample considered includes a fraction of the firms with zero debt. According to Faulkender and Petersen (2006): “Firms with no debt might be either not able to access debt markets or they might simply not want to have access and prefer to finance themselves with equity. If firms in this category qualify to have access but do not want to obtain a rating, they will be wrongly classified as firms without access.” Therefore, to avoid any potential bias of wrongly classifying firms that do not want to have a rating as those that face credit supply constraints and to stay consistent with the methodology of the previous works of Faulkender and Petersen (2006), Judge and Korzhenitskaya (2011), in the following Section B of the summary statistics Table 1, as well as for the rest of the analysis in this research study, we have restricted the data sample, including only firm-years with the positive debt. This resulted in removing 870 firm-years with zero debt, which comprised only 5% of the total sample of firm-years.
After removing all zero debt firm-year observations from our analysis, we still get results consistent with Section A: on average, possession of a debt rating is associated with 9pp higher MV debt ratio and 11pp higher BV debt ratio with the t-stats of 14 and 20 respectively;
These results indicate that both debt level differences are statistically and economically significant; furthermore, firms with access to the public bond market median value is 13pp higher than of the firms without access for both MV and BV debt ratio.
Table 1: Firms leverage distribution relative to the credit rating presence
25% Mean Median 75%
Section A: All firm-years Debt/Assets(MV) Total Sample 0,08 0,24 0,19 0,36 With Access 0,12 0,27 0,23 0,39 Without Access 0,00 0,14 0,06 0,19 Difference Significance 0,12 *** 0,17 Debt/Assets(BV) Total Sample 0,13 0,26 0,24 0,36 With Access 0,18 0,29 0,27 0,38 Without Access 0,01 0,15 0,10 0,25 Difference Significance 0,14 *** 0,18
Section B: Firm-Years with positive debt Debt/Assets(MV) Total Sample 0,08 0,24 0,19 0,36 With Access 0,11 0,27 0,22 0,38 Without Access 0,02 0,17 0,09 0,24 Difference Significance 0,09 *** 0,13 Debt/Assets(BV) Total Sample 0,14 0,27 0,25 0,36 With Access 0,17 0,29 0,27 0,37 Without Access 0,04 0,18 0,13 0,28 Difference Significance 0,11 *** 0,13
The table reports summary statistics on firms’ total debt ratios by whether they have access to the public debt markets. We use whether the firm has a debt rating as a measure of whether it has access to the public debt markets. The market value (MV) ratio is total (short- and long-term) debt divided by the sum of the market value of equity with total debt. The BV debt ratio is total debt divided by the BV of assets. The BV ratio is not always between 0 and 1; it is above 1only for
only 0.5% of the sample. We re-coded the BV ratio to 1 for these observations. The table reports the mean, the 25th, 50th
(median), and 75th percentile in each cell. The difference row contains the difference in the means (medians) and the
associated significance levels: *** indicates statistical significance at 1% level; ** indicates statistical significance at 5% level, * indicates statistical significance at 10% level. In Section A 17365 firm-year observations are presented, of which 75% have a debt rating. Section B includes only firm-years when the firm had a positive amount of debt. In Section B,
16495 firm-year observations are included, of which 78% have a debt rating. The sample is based on S&P listed firms from Compustat for years between 1986 and 2014; Decimals are reported after the comma sign in all the tables.
The difference in leverage between firms with access to the public debt market comparing to firms without access is very vigorous. Same pattern on the significant leverage difference can be observed across the entire distribution: firms with a debt rating have higher leverage at the 25th, 50th, and 75th percentiles of the distribution, and in all samples comparison: whether leverage is measured with market base value or book value, in Section A with zero debt firm year observations inclusively or in Section B, where we exclude all the zero debt observations.
4.C: Firm Characteristics of rated and non-rated firms
In Section 3 we have observed that firms with access to the public debt market are significantly and consistently more levered than those without access. In this section I would like to look further and analyzing what are the reasons and factors driving this relationship. This could be due either or both demand side factors or supply side factors. The results of the summary statistics presented in Table 1 do not allow to distinguish between whether the result is driven by demand-side considerations: firm characteristics or supply-side considerations: lack of access to the public debt market, measured by the credit rating possession.
In this section of the analysis, I aim to consider how firm characteristics differ between two distinguished samples of firms: with and without access to the public debt market (See Table 2). From the summary statistics Table 2, it is evident that firms with access to the public debt market, measured by possession of a credit rating, have rather different features and characteristics than firms without access.
Firms with a credit rating are larger: with Ln(BV of Assets), Ln(Sales) or Firm Size 160% larger than of firms without a credit rating. Firms with access have 4% more tangible assets and 7% more of book of assets in the form of property, plant, and equipment. Also, rated firms possess on average 85% smaller market-to-book ratios, indicating less of intangible assets of firms with access to the bond market and spend 10% less on research and
development (R&D/Sales), where all the above variables differences between group of firms with and without access appear to be highly statistically significant, at 1 % level. These findings on the firm characteristics differences between the samples of firms with and without access to the public debt market are consistent with the existing findings of previous works in this field (Faulkender and Petersen, 2006; Judge and Korzhenitskaya, 2011; Mitto and Zhang, 2008).
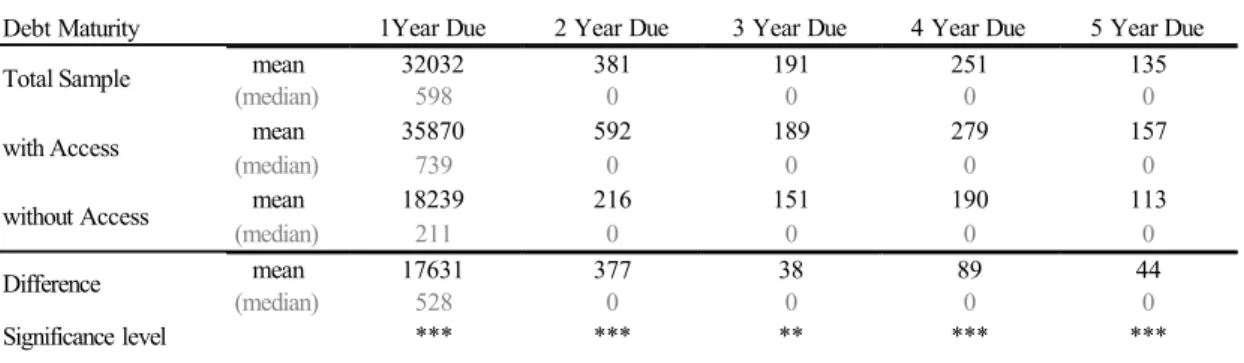
In extension to the firm characteristics differences examined, following Faulkender and Petersen (2006), we considered also the difference of the relative debt maturities between firm samples with and without access to the bond market (See Table 3).
According to Barclay and Smith (1995a), public debt market maturities should be longer than private debt market maturities. Therefore, firms with access to the public debt market, therefore enabled to source leverage from the bond market, should hold more of long-term debt, while firms without access should be more likely to hold debt of shorter maturities. Consistently with the Barclay and Smith (1995a) findings, source of debt, public or private, shows to be related to the firms’ debt maturity (See Table 3).
From Table 3 it is visible that firms with access to the bond market (with a credit rating) have on average more debt of all maturities relative to firms without access: two times more of debt due in 1 year; 2.7 times more of debt due in 2 years; 1.3 times more of debt due in 3 years; 1.5 times more of debt due in 4 years and in 5 years, where all the differences between groups of firms with and without access are highly statistically significant, at 1% level.
After analyzing results of Tables 2 and 3, it is visible that firms with access to the public debt market possess all major firm characteristics that are related with the higher demand for debt, while higher leverage was documented to have also a positive relationship with the credit rating (access to the bond market). It means that potentially, the observed higher leverage of rated firms is likely to be strongly driven by firm characteristics.
Until recently, demand side factors examination was the priority of much of the empirical capital structure literature, while paying significantly less attention to the supply side determinants.
Table 2: Firm characteristics of firms with and without access to the public debt Firm Characteristics: With Access Without Access Difference
LN(BV of Assets) mean 8,65 7,00 1,65*** (median) 8,66 7,01 1,65 LN(Sales) mean 8,47 6,94 1,59*** (median) 8,51 7,01 1,49 Profits/Sales mean 0,36 0,43 0,01*** (median) 0,33 0,41 -0,07
Firm Size mean 8,55 7,55 1,07***
(median) 8,62 7,58 1,04
ROIC mean 0,59 0,66 0,05**
(median) 0,49 0,60 -0,10
Pre-tax Margin mean 0,09 0,10 -0,02*
(median) 0,09 0,11 -0,02
Asset Tangibility 1 mean 0,64 0,60 0,04***
(median) 0,65 0,61 0,04
Asset Tangibility 2 mean 0,37 0,30 0,07***
(median) 0,32 0,22 0,09
Market -to-Book of Assets mean 1,81 2,67 -0,85***
(median) 1,49 1,93 -0,44
R&D Expences mean 0,03 0,07 -0,03***
(median) 0,02 0,05 -0,03
R&D/Sales mean 0,04 0,11 -0,10***
(median) 0,02 0,07 -0,05
Asset Volatility mean 1,31 1,82 -0,48***
(median) 1,23 1,78 -0,55
Equity Return mean 0,00 -0,01 0,01
(median) 0,05 0,02 0,03
Tax Paid mean 0,30 0,30 -0,06
(median) 0,34 0,36 -0,01
The table contains summary statistics for the sample of firms with and without access to the public debt markets. Firms that have a debt rating are classified as having access; those without a bond rating are classified as having no access. Values are expressed in mean (median). The third column contains the difference in the means and medians as well as the statistical significance of the difference; *** indicates statistical significance at 1% level, ** indicates statistical
significance at 5% level, * indicates statistical significance at 10% level. sample is based on S&P listed firms from Compustat between 1986 and 2014 and only includes firm-years with positive debt; Decimals are reported after the comma sign in all the tables.
Table 3: Debt maturities
Debt Maturity Total Sample with Access without Access Difference Significance level
The table reports the mean (median) of outstanding debt by maturity. Firms that have a debt rating are classified as having access. The columns contain the fraction of debt due in years 1 throughout due in five years. The last rows contain the difference in the means (or medians) between firms with and without bond market access (a debt rating) and the associated significance levels, where; *** indicates statistical significance at 1% level, ** indicates statistical significance at 5% level, * indicates statistical significance at 10% level. The sample is based on S&P rated firms from Compustat for the years between 1986 and 2014 and only includes firm-years with debt.
The preliminary intention of this research is to analyze the effect of the supply-side constrains on firm capitalization, therefore in the following section we will control for the firm characteristics, in order to determine the presence and magnitude of the concerned supply-side effects.
Section 5: Multivariate Data Analysis
5.A: Controlling for the Firm Characteristics
In this section, I proceed with the regression analysis of the credit rating, estimated by the credit rating dummy variable, on the firms’ leverage, estimated by the MV debt ratio, controlling for the firm characteristics effects.
Inclusion of firm characteristics in the regression analysis will allow to observe the economical and statistical significance of the demand-side factors explanatory power over the firms’ level of leverage, as well as the relative magnitude and significance of the supply side constrains – access to the bond market.
1Year Due 2 Year Due 3 Year Due 4 Year Due 5 Year Due
mean 32032 381 191 251 135 (median) 598 0 0 0 0 mean 35870 592 189 279 157 (median) 739 0 0 0 0 mean 18239 216 151 190 113 (median) 211 0 0 0 0 mean 17631 377 38 89 44 (median) 528 *** *** 0 ** 0 *** 0 *** 0
Firm characteristics aimed for controlling and their expected theoretical relation to leverage are: firm size, with expected positive relationship with firms’ debt ratio; firm profitability, with negative relationship in respect to firms leverage; asset tangibility, which is expected to be positively related to leverage; firm growth opportunities, that showed to possess negative relationship with leverage; business risk – negative in relation to leverage; debt maturity, estimated by fraction of short-term debt – negative sign with leverage and marginal tax rate – positive to the debt ratio (Titman, 2002; Faulkender and Petersen, 2006; Judge and Korzhenitskaya, 2011; Graham and Leary, 2011).
Following Faulkender and Petersen (2006), Leary (2009) and Judge and Korzhenitskaya (2011) the above listed firm characteristics were estimated as follows: firm size estimated with natural log of BV of total debt and MV of equity, secondly with natural log of BV of Assets and lastly with a Log of Sales; Profitability estimated with the ratio of profits over sales, pre-tax margin and alternatively return on invested capital; asset tangibility estimated with the ratio of total assets excluding current assets over the total assets, secondly with the ratio of property plant and equipment over the total assets; Intangible assets estimated with the MV of assets over BV of assets ratio or R&D expenses; Asset volatility measured as equity volatility by equity to MV of assets ratio; Debt maturity estimated as a portion of short-term debt of the total debt; and lastly, taxes estimated with marginal tax rate. The complete table of variables used in the regression analysis with the full description is presented in the Appendix, Table 8.
The regression analysis follows the modeling of equation (3) with the respective estimation technique stated in the methodology, Section 2.
The results of the regression analysis with controlling for the firm characteristics are presented in the Table 4 below. This stage analysis includes 6 models overall, testing different estimators of the firm characteristics at different levels of inclusion (See Table 4). The obtained results are rather consistent with the previous research findings.
Increase in the firms’ profitability is associated with the lowering of the firms’ leverage (at 1 % statistical significance level). This is consistent with the theoretical expectation, as long as firms are able to use increased earnings to pay off the debt, which is also in line
with the findings of Faulkender and Petersen (2006); Kisgen (2006); Kisgen (2009) and Judge and Korzhenitskaya (2011).
Table 4: Regression Analysis with Firm Characteristics
Model I Model II Model III Model IV Model V Model VI
Debt Rating Dummy (1=yes) 0,026 ** -0,011 0,036 *** -0,011 0,035 *** -0,008 0,035 *** -0,008 0,024 *** -0,007 0,023 *** -0,007
LN(BV of Assets) 0,009 * -0,006
Firm Size -0,029 *** -0,006 -0,028 *** -0,005 -0,027 *** -0,005 -0,017 *** -0,004 -0,017 *** -0,004
Profits/Sales -0,155 *** -0,039 -0,104 *** -0,038 -0,112 *** -0,030 -0,108 *** -0,030 -0,113 *** -0,022 -0,113 *** -0,022
Asset Tangibility 2 -0,019 -0,039
Asset Tangibility 1 0,195 *** -0,031 0,184 *** -0,028 0,181 *** -0,028 0,123 *** -0,023 0,122 *** -0,023
Market to Book of Assets -0,042 *** -0,003 -0,031 *** -0,003 -0,041 *** -0,003 -0,041 *** -0,003 -0,002 -0,003 -0,002 -0,003
R&D/Sales -0,040 -0,065 -0,042 -0,099
R& D Expences
Marginal tax rate -0,031 *** -0,005 -0,014 *** -0,005 -0,014 *** -0,005
Equity Return (previous year) -0,065 *** -0,004 -0,065 *** -0,004
Asset Volatility -0,157 *** -0,005 -0,157 *** -0,005
Short-term Debt (% debt due in <=1 year) -0,009 -0,007
Observations 8,987 8,703 15,119 15,119 12,878 12,875 R-squared 0,331 0,359 0,380 0,385 0,633 0,634 Fixed effects model YES YES YES YES YES YES
The dependent variable is the MV debt ratio; the dependent variable definition, as well as the definition of the rest of the considered variables, can be found in the Variables definition table in the Appendix.
All models include year dummy variables. White heteroscedastic consistent errors, corrected for correlation across observations of a given firm, are reported next to the coefficients respectively (robust standard errors). All variables are winzorised at 1% level in order to prevent potential outliers driving the results. The sample is based on firms from Compustat between 1986 and 2014 and only includes firm-years with debt. *** indicates statistical significance at 1% level; ** indicates statistical significance at 5% level; *indicates statistical significance at 10% level. In model I: Ln of the book value of assets, Asset Tangibility2 and R&D/Sales estimators for firm size, asset tangibility and growth opportunities were tested; In model II: firm size, Asset Tangibility1 and R&D Expenses relative to total assets estimators for firm size, asset tangibility and growth opportunities were tested alternatively; in model III the best fit estimators of size, asset tangibility and growth opportunities from model I and II were selected: Firm Size and Asset Tangibility1, while R&D variable was excluded as it produces insignificant result, decreasing the significance of the overall regression analysis. The main reason for this might be the fact of too many records missing in the available data set for R&D expenses; Decimals are reported after the comma sign in all the tables.
Firm size indicates negative relationship with the debt ratio, which is found to be statistically significant at 1% level. However, this finding is controversial to the theoretical rational expectation of larger firms holding more debt, which is also supported by the large number of empirical studies. Nevertheless, this finding is consistent with the similar work of Faulkender and Petersen (2006), who justified the negative coefficient of the firm size being due to the high correlation of the credit rating variable with the size variable, jointly
with the fact of using total debt as a response variable, while most of the studies that produced different result applied long-term debt.
More of tangible assets held by the firm show to be associated with higher debt ratio, 1% increase in tangible assets relate to 12-20% increase in leverage (p<0.00). While more of the intangible assets are associated with lower debt ratio, with up to 4% leverage decrease with respect to 1% increase in market to book ratio (p<0.00). Both findings are in line with theoretical prediction and the Faulkender and Petersen (2006) and Judge and Korzhenitskaya (2011) results.
Marginal tax rate showed to be negatively associated with the debt ratio, with 2-5% leverage decrease with respect to 1 unit of tax paid increase (p<0.00). The theoretical statement predicts the opposite, positive relationship between pre-tax income marginal tax rate and leverage, however similar empirical studies have observed the negative relationship between these two variables. With the reference to Faulkender and Petersen (2006), the negative sign on marginal tax rate can be explained by the choice of the dependent variable that was used: long-term debt-to-MV of assets.
Also asset volatility and stock returns of the previous year were included in the regression analysis, both of which return negative coefficients on leverage that are both economically and statistically significant. This finding is in line with the expectations.
The rational expectation is that higher asset volatility of firms will lead to higher chances and costs of firm facing financial distress, therefore these firms are predicted to choose less leverage and prioritize banks financing (Cantillo and Wright, 2000). While previous year stock returns help to evaluate firms’ partial adjustment of the debt-to-asset ratio, with the rational expectation of firm reducing its leverage in case of firm lack of capital
structure adjustment under the condition of unforeseen increase in the value of assets (Faulkender and Petersen, 2006).
R squared of the models improves significantly from model I to model VI, along the way of including more firm characteristics control variables and excluding R&D variable, resulting with the overall regression analysis model VI 63% explanatory power over the variation in debt ratio and F-stats p<0.00.
Importantly, this study models explanatory power shows to be consistently and significantly larger than in the similar previous work of Faulkender and Petersen (2006) and Judge and Korzhenitskaya (2011); they showed 24 to 37% explanatory power of the analysis with the firm characteristics control across the models.
From the above analysis it can be observed that firm characteristics are rather economically and statistically significant at explaining variation in leverage, which implies that demand- side factors indeed explain the variation in firms’ leverage to a certain extend. However, even after controlling for the firm characteristics, credit rating dummy variable showed to be statistically significant (at 1% and 5% level) in all six models (p<0.00), where firms with access to the bond market are up to 4% more levered that firms without access. This result indicates that access or lack of access to the public debt market, estimated by the possession of a credit rating, is indeed affecting corporate level of leverage.
5.B: Controlling for the Industry and Firm Specific Effects
After including controls on the firm characteristics-demand side vector factors in the previous section, in this section we proceed further and extend out regression model.
According to the theoretical prediction and previous research findings rather than a set of firm characteristics, there are other factors that can potentially influence firm demand for leverage.
Industry in which firm operates can rather significantly influence its capital structure, therefore demand for debt; as long as industries vary strongly in type of operations run, therefore are predicted to differ in the type of assets required and used (Faulkender and Petersen, 2006). This prediction of industry type influencing firms demand for leverage is quite supported by the empirical findings (Graham and Leary, 2011).
Along with this supported statement, empirical literature suggests that the impact of an individual firm specific effects predict firms demand for leverage even greater than the type of industry in which firm operates. According to the findings of Lemmon et al. (2008), both book and market leverage showed 60% variation to be cross sectional, most of which is between firms rather than between industries.
This is in line with MacKay and Phillips (2005) finding which concludes that within industry leverage variation is twice as large as between industry variation for market leverage and three times bigger for book leverage.
Therefore, to proceed with the intention to clearly distinguish supply-side factors effect on leverage from the demand-side factors, we extend our regression analysis model with the firm characteristics, by adding control variables for the industry and then for the firm specific effects. This also allows us to test for the robustness of the findings.
The regression analysis follows the modeling of equations (4) and (5) with the respective estimation technique stated in the methodology, Section 2.
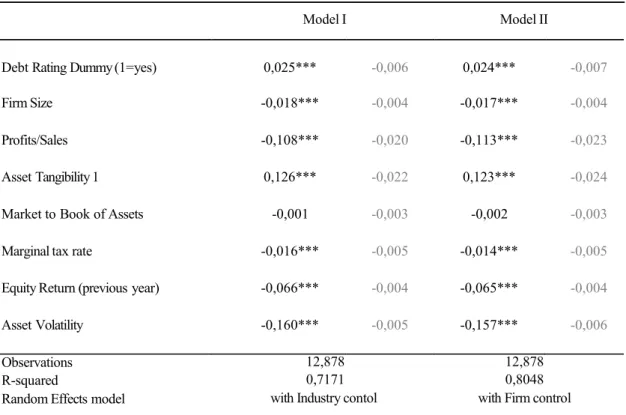
The results of the regression analysis with controlling for the industry and firm effects are presented in the Table 5 below. This regression analysis includes 2 models, each model includes credit rating dummy, a set of firm characteristics (based on model V developed in Table 4, due to the variables statistical significance and overall model explanatory power), per industry dummy– in Model I and per firm dummy – in Model II (See Table 5).
Table 5: Regression analysis with industry and firm specific effects
Model I Model II
Debt Rating Dummy (1=yes) 0,025*** -0,006 0,024*** -0,007
Firm Size -0,018*** -0,004 -0,017*** -0,004
Profits/Sales -0,108*** -0,020 -0,113*** -0,023
Asset Tangibility 1 0,126*** -0,022 0,123*** -0,024
Market to Book of Assets -0,001 -0,003 -0,002 -0,003
Marginal tax rate -0,016*** -0,005 -0,014*** -0,005
Equity Return (previous year) -0,066*** -0,004 -0,065*** -0,004
Asset Volatility -0,160*** -0,005 -0,157*** -0,006
Observations R-squared
Random Effects model
12,878 0,7171 with Industry contol
12,878 0,8048 with Firm control
The dependent variable is the ratio of total debt to the market value (MV) of the firm’s assets; the dependent variable definition, as well as the definition of the rest of the considered variables, can be found in the Variables definition table in the Appendix. All models include year dummy variables. White heteroscedastic consistent errors, corrected for correlation across observations of a given firm, are reported next to the coefficients respectively (robust standard errors). All variables are winzorised at 1% level in order to prevent potential outliers driving the results. The sample is based on firms from Compustat between 1986 and 2014 and only includes firm-years with debt. *** indicates statistical significance at 1% level; ** indicates statistical significance at 5% level; *indicates statistical significance at 10% level. In model I: Random effects estimation model is used, with the per Industry dummy variable; In model II: Random effects estimation model is used, with the per firm dummy variable; Decimals are reported after the comma sign in all the tables.
After the inclusion of controls of the 220 industry dummies in Model I and 779 firm dummies in Model II, the results are similar to the results obtained in the previous section. All firm characteristics coefficients economical and statistical significance remain nearly the same, as well as the possession of a credit rating by a firm remains to show 2.4%-2.5% higher debt ratio than for the firms without a credit rating, which is consistent with 2.3%- 2.4% resulted in the previous section. Controlling for the industry and firm effects significantly improved the explanatory power of our model, from 63% (Table 4) to 72% in Model I and 80% in Model II (Table 5).
From the extended results obtained in this section, it is visible that even after controlling for firm characteristics, industry and firm specific effects, the influence of a credit rating possession on corporate leverage remain to be economically present: at a 2.5% level and statistically significant: at 1% level, proving the robustness of the results in this study and supporting the hypothesis of our primary research question: clear positive effect of access to the bond market on leverage, supply-side constrains negatively affecting firms leverage. 5.C: Controlling for the Time Effects
In this section we proceed further with our analysis and address the second major research question of this study: whether factor of access/lack of access to the public debt market affects firms leverage differently over time; in particular, if during the economic crisis having a credit rating, as a measure of access to the bond market, has a larger impact on firms’ leverage relative to the non-crisis years.
The theoretical reasoning behind this hypothesis is based on the following rationale: during the years of economic downturn, supply of debt available for firms shrinks sufficiently (worsened terms and conditions of borrowing), while its cost increases due to the more aggressive risks presence, credit market conditions become tighter, debt source of capital become more supply constrained, in comparison to the normal years of economic growth (Ivashina and Scharfstein, 2009).
Therefore, in line with the pecking order theory, unable to fulfill financing fully or partially with the private debt, firms require additional financing via alternative sources of capital and financing with the public debt is a first best alternative (more detailed explanation on the firms order of choice of debt financing via private versus public debt – consider in the literature review section).
Thus, overall, in presence of the negative economic climate conditions, firms that do not have access to the public debt market face significantly larger debt supply constraints, are not able to finance all their positive NPV projects and become largely under levered when compared to firms that are able to raise additional debt via bond market under the tightened credit supply conditions.
Quite sufficient evidence of previous research works rather strongly supports the above rationale and prediction: Kisgen (2007); Leary (2009); Campello, Giambona, Graham and Harvey (2009) and Judge and Korzhenitskaya (2011).
Testing this research question is very important for our study, because this is the longest time period considered so far for this type of research question; with 28 years’ time span analyzed, we are able to cover all major economic turbulences of the recent years. Data covers several downturns: recession in the beginning of 1990s, market tightening 1999 to 2000 and 2002-2003, and fully covers the most recent financial crisis of 2008, thus, enabling us to observe and state rather consistently whether the time effect is present in the relationship of credit rating and corporate leverage, what magnitude it has and what is its statistical significance.
The regression analysis follows the modeling of equation (6) with the respective model technique, explained in the methodology, Section 2.
The credit rating impact on firms’ debt ratio per year, over the time period of 1986- 2014 will be captured by the constructed interaction term of the credit rating dummy joined with the year variable. Three models are estimated with different explanatory variables inclusion. Results of this regression analysis are reported in table 6 below (See Table 6). From the obtained results presented above we can see that the coefficients of the credit rating dummy economic value decreased significantly, from 2.5% - 3.5%, obtained in previous regression analyses, to 0.3% – (-0.1) % when controlling for time effect. Statistical significance of the coefficient in all 3 models considered diminished as well. However, this is a rational, expected change in the total credit rating variable explanatory power, as long as 56 Credit Rating Dummy*Year interaction terms were additionally included in the regression analysis, implying that the total economical and statistical power of the credit rating possession was indicated and distributed per year within the 56 interaction term variables, making the original collective dummy variable insignificant. This result is in line with the findings of Leary (2009) and Judge and Korzhenitskaya (2011). Coefficients on the firm characteristics values remain economically and statistically consistent in their significance with all the previous regression analysis findings.
In this regression analysis, in order to assess the impact of the credit rating on leverage over time, we have to analyze the magnitude and statistical significance of each interaction term of credit rating per year in relation to each other and assess whether the coefficients of the interaction term variables change over the sample time period in a consistent way with the economic cycle phases, thus in the consistent pattern with the loosening and tightening of the credit markets.
For better visibility, a graph of the interaction variable coefficient of the credit rating dummy with years was plotted over the observed period of time: 1986-2014 (See Graph 2). Table and graph results make it clearly visible that the credit rating coefficient is not smoothly and equally distributed across years of the time span considered, but fluctuates over the time period strongly, from the lowest coefficient value of – 1.7% in 2006 to the highest coefficient value of 9.3% in year 2000 and 8.5% in 2008.
Table 6: Regression analysis controlling for the time effect
Model I Model II Model III
Debt Rating Dummy (1=yes) 0,003 -0,025 -0,001 -0,026 -0,002 -0,026
FirmSize -0,017*** -0,004 -0,017*** -0,004 -0,017*** -0,004
Profits/Sales -0,113*** -0,022 -0,111*** -0,022 -0,111*** -0,022
Asset Tangibility 1 0,124*** -0,023 0,123*** -0,023 0,122*** -0,023
Market to Book of Assets -0,003 -0,003 -0,003 -0,003 -0,003 -0,003
Equity Return (previous year) -0,065*** -0,004 -0,065*** -0,004 -0,065*** -0,004
Asset Volatility -0,157*** -0,005 -0,157*** -0,005 -0,157*** -0,005
Marginal tax rate -0,014*** -0,005 -0,014*** -0,005
Short-term Debt (% debt due in <=1 year) -0,009 -0,007
Rating_1986 0,037** -0,015 0,037** -0,015 0,0378** -0,015 Rating_1987 0,057*** -0,015 0,057*** -0,015 0,058*** -0,015 Rating_1988 0,021 -0,015 0,020 -0,015 0,021 -0,015 Rating_1989 0,024 -0,015 0,024 -0,015 0,024 -0,015 Rating_1990 0,046*** -0,015 0,045*** -0,015 0,046*** -0,015 Rating_1991 0,038** -0,015 0,037** -0,015 0,038** -0,015 Rating_1992 0,020 -0,015 0,019 -0,015 0,020 -0,015 Rating_1993 0,000 -0,015 -0,001 -0,015 0,000 -0,015 Rating_1994 -0,007 -0,015 -0,008 -0,015 -0,007 -0,015 Rating_1995 0,001 -0,015 0,000 -0,015 0,001 -0,015 Rating_1996 -0,004 -0,015 -0,005 -0,015 -0,004 -0,015 Rating_1997 0,013 -0,016 0,012 -0,016 0,013 -0,016 Rating_1998 0,046*** -0,016 0,045*** -0,016 0,045*** -0,016 Rating_1999 0,071*** -0,016 0,069*** -0,016 0,070*** -0,016 Rating_2000 0,094*** -0,017 0,093*** -0,017 0,093*** -0,017 Rating_2001 0,060*** -0,017 0,059*** -0,017 0,059*** -0,017 Rating_2002 0,068*** -0,017 0,066*** -0,017 0,067*** -0,017 Rating_2003 0,038** -0,017 0,036** -0,017 0,036** -0,017 Rating_2004 -0,001 -0,017 -0,003 -0,017 -0,002 -0,017 Rating_2005 -0,013 -0,018 -0,016 -0,018 -0,015 -0,018 Rating_2006 -0,015 -0,018 -0,017 -0,018 -0,017 -0,018 Rating_2007 0,007 -0,018 0,005 -0,018 0,006 -0,018 Rating_2008 0,088*** -0,019 0,085*** -0,019 0,086*** -0,019 Rating_2009 0,079*** -0,018 0,077*** -0,018 0,078*** -0,018 Rating_2010 0,027 -0,018 0,024 -0,018 0,024 -0,018 Rating_2011 0,033* -0,019 0,031* -0,019 0,031* -0,019 Rating_2012 0,015 -0,019 0,013 -0,019 0,013 -0,019 Rating_2013 0,005 -0,019 0,003 -0,019 0,003 -0,019 Rating_2014 0,005 -0,019 0,003 -0,019 0,003 -0,019 Observations 12,878 12,878 12,875 R-squared 0,633 0,634 0,635 F test 49,97 49,55 48,98 Prob>F
Fixed effects model 0,000 YES 0,000 YES 0,000 YES
The dependent variable is the ratio of total debt to the market value (MV) of the firm’s assets; the dependent variable definition, as well as the definition of the rest of the considered variables, can be found in the Variables definition Table 8 in the Appendix. Credit rating is interacted with the year dummies to measure the variation in the effect of credit rating over time. All models include industry dummy variables (categirized by first 2 digits of the 4-digit SIC code) to control for industry-specific effects)White heteroscedastic consistent errors, corrected for correlation across observations of a