mining teChniques
Sílvia Maria Dias Pedro Rebouças1 Daniele Adelaide Brandão de Oliveira2 Rômulo Alves Soares3
Eugénia Maria Dores Maia Ferreira4
Maria José Baltazar dos Reis de Pinto Gouveia5
AbstrAct
Advances in information technologies have led to the storage of large amounts of data by organizations. An analysis of this data through data mining techniques is important support for decision-making. This article aims to apply techniques for the classification of the beneficiaries of an operator of health insurance in Brazil, according to their financial sustainability, via their sociodemographic characteristics and their healthcare cost history. Beneficiaries with a loss ratio greater than 0.75 are considered unsustainable. The sample consists of 38875 beneficiaries, active between the years 2011 and 2013. The techniques used were logistic regression and classification trees. The performance of the models was compared to accuracy rates and receiver operating Characteristic curves (ROC curves), by determining the area under the curves (AUC). The results showed that most of the sample is composed of sustainable beneficiaries. The logistic regression model had a 68.43% accuracy rate with AUC of 0.7501, and the classification tree obtained 67.76% accuracy and an AUC of 0.6855. Age and the type of plan were the most important variables related to the profile of the beneficiaries in the classification. The highlights with regard to healthcare costs were annual spending on consultation and on dental insurance.
Keywords: Data Mining, Logistic Regression, Classification Trees, Health Insurance. JEL Classification: C55.
1. INtrODUctION
The health sector in Brazil is composed of a public state-funded system called Sistema Único de Saúde (Health Unified System – SUS), and a private system usually called the supplemental health system, run by health maintenance organizations (HMO). The latter began a fast expansion, ranging from 15 million users in the beginning of the 1980s, to over 49 million users in 2015 (ANS, 2016).
The supplemental health system has been the focus of recent attention in society in general. The financial balance of operators becomes increasingly delicate every passing year. Silva (2007) notes that operators are mainly threatened by the exaggerated increase
1 Sílvia Maria Dias Pedro Rebouças, Federal University of Ceará, Brazil. (smdpedro@gmail.com) 2 Daniele Adelaide Brandão de Oliveira, Fanor Devry Brazil, Brazil. (danieleadelaide@hotmail.com) 3 Rômulo Alves Soares, Federal University of Ceará, Brazil. (romuloalves61@gmail.com)
4 Eugénia Maria Dores Maia Ferreira, University of Algarve, Faculty of Economics, Research Centre for Spatial and Organizational Dynamics,
in healthcare costs. The survival of the operators depends on a reduction of the speed with which these costs have increased.
This reality shows the need for operators to develop efficient management mechanisms in order to become more competitive, in order to cope with a natural tendency, which is the increase in costs spent on the assisted population. One way to deal with this problem is to analyze the usage history and the profiles of beneficiaries, in an attempt to identify patterns in these high welfare costs, allowing operators to create measures to ensure their livelihood.
The usage history of beneficiaries of health plans can be used for data analysis, using statistical tools to search for patterns that can be used in decision making, however, health care providers generally have tens or hundreds of thousands of beneficiaries, forming very large databases. Given the difficulties inherent in statistical analysis when dealing with such datasets, the information present in the data is often undervalued and underused. In an increasingly competitive market, the efficient use of this information represents a fundamental advantage in the decision-making process.
The use of data mining is thus recommended, which is the analytical process of exploring large datasets, which aims to find patterns and systematic relationships between variables, and to validate them using new data, via statistical techniques and artificial intelligence (Tufféry, 2011).
One of the main data mining techniques is supervised classification. Typically, in supervised classification, the dependent variable is qualitative (define groups), which is intended to be predicted using a set of independent variables.
This study aims to apply different data mining techniques to predict the financial unsustainability of the beneficiaries of an operator of health insurance, using data about their previous use of the insurance, and social characteristics. Beyond that, this study also tries to identify adequate classification techniques applied in this context and the most relevant predictors.
In order to compare the adequacy of the techniques, the accuracy of the classification obtained was taken into account, measured through ROC curve analysis. Its main measure is the area under the curve (AUC). This type of analysis is based on the relationship between the sensitivity and specificity of binary classifiers (Tufféry, 2011). The behavior of the independent variables in the classification process was also examined. According to Olden et al. (2004), the accuracy of statistical techniques employed has a direct relationship to the importance of the variables considered.
2. tHE HEAltH INsUrANcE mArkEt AND Its rEgUlAtION
The 1988 Brazilian Constitution states that health is the right of all people and the state’s responsibility. Actions and public health services integrate a regionalized and hierarchical network, providing a unified health system (SUS). The Constitution does not grant exclusivity to the state, however, allowing the private sector free access to the provision of health care services.
The Constitution defines the basis of the SUS, as consolidated in Law No. 8080 of 19/09/90, in order to solve the main problems of the Brazilian health system, but historically, there have been difficulties in the system, particularly as related to access to health services, poor conditions of service, physical facilities, and difficulties in keeping teams trained to offer a quality service.
Cechin (2008) explains that the Brazilian health sector is atypical, because, unlike countries such as Canada or European nations, where the state dominates health management,
or in the United States and low-income countries, where private healthcare companies predominate, both segments are of paramount importance in Brazil.
The health insurance sector consists of companies from the private sector which develop work provision for health services, although there is no consensus in the literature on such a term and designations such as additional medical care and supplementary medical care can also be used, among others (UNIDAS, 2005).
The supplementary health system comprises the services provided by insurers specializing in health insurance, group medicine companies and dentistry, cooperatives (specializing in health care plans and/or dental), philanthropic entities, self-management companies and managers.
Between 1987 and 1992 there was an average increase in the number of private medical beneficiaries of 7.4%. It was in this context of a great expansion of additional medicine that SUS was created. In the following years, the good performance of health insurance continued. The number of beneficiaries increased from 32 million in 1992 to just over 41 million in 1997 (Cechin, 2008).
The sector was consolidating with the improvement of people’s income, the increase in demand of enterprises by good medical care for their employees and, from the 1990s, with the fall in the quality of public health services. In the late 1990s, the prospects for supplementary health were positive. In 1998, it was estimated that the sector would have, in five years, 80 million health plan beneficiaries in the country, compared to the just over 40 million in that year. The regulatory outlook led analysts to predict that the entry of foreign companies would contribute to the expansion of health insurance (Cechin, 2008).
Analyzing the relationship of the operators and the beneficiaries, it is noted that regulation led to a number of obligations for contract plans after 1999, including the establishment of a minimum list of assistance procedures; the prohibition on interrupting hospital internments; periods of grace; the need for prior authorization for price rises; the limited value for beneficiaries of a higher age; the maximum adjustment percentage of fees for the plans of individuals and the impossibility of an operator canceling such a plan.
3. FINANcIAl sUstAINAbIlItY
The term ‘sustainability’ has been defined by many authors (Liverman et al., 1988; Dovers & Handmer, 1993; Moore & Johnson, 1994; Bartuska et al., 1998). Conway’s (1986, p.82) definition is simple and short, defining sustainability as the ability of a system to maintain productivity when it is subjected to intense stress or change.
The key feature of the concept of “sustainability” lies in the quality of keeping something forever (Valadão et al., 2008).
This characteristic is the same as that used by Araújo (2003), who considers sustainability to be the ability to be able to maintain more or less constantly or stably for a long period. This stability involves institutional, technical, political and financial aspects.
Broadening the concept to the context of financial sustainability from the perspective of beneficiaries, it is important to discuss how this issue will be consolidated by health plan operators regarding the increasing cost of incorporating new technologies, materials and health medicines and more human resources, and taking into account the longevity of the population, which increasingly needs health services as it ages and which will be reflected in the cost of the plan to the user in the present and in the future, and whether this cost is sustainable in the long term for future generations.
It is important to note that the Brazilian scenario suggests a worrying growth in health care costs. The main causes of this growth are aging of the population; the introduction of
new technologies, materials and medicines; moral hazards; adverse selection risk; expansion by the ANS of the list of mandatory procedures and adjustments in the remuneration of service providers. The increasing intervention of ANS in increasing procedures to be provided by operators ensures users greater security of health care, but it may be unsustainable in the long term for operators and beneficiaries. The cost of the supply of these procedures may make it unfeasible to maintain a portfolio of smaller plans, and when the costs are passed on to consumers, they, in turn, may experience difficulties in honoring payments. These are questions to be analyzed in the light of sustainability.
4. mEtHODOlOgY
This study is characterized as descriptive and analytical. The exploratory research was aimed mainly at the improvement of ideas and therefore allowed consideration of various related elements. This research also has an applied nature, as it seeks to generate knowledge for practical application and specific troubleshooting (Gil, 2002).
The procedure used in this study is predominantly quantitative, using statistical analysis methods in accordance with the objectives. Data analysis began with descriptive and inferential statistical techniques. This was followed by an adjustment of risk models for the financial unsustainability of beneficiaries, using two methods of supervised classification: logistic regression and classification trees. The independent variables were related to socio-demographic characteristics, the relationship with the operator and the welfare costs of history. The performance of the models was evaluated through classification tables and ROC curves.
4.1 Population, sample and variables
The population of this research was the customer portfolio of a particular health plan operator. To obtain the sample, active beneficiaries were chosen between the years 2011 and 2013, with all the necessary data available. The final sample consisted of 38875 customers. The data was extracted using Microsoft SQL Server software 2008. This data was tabulated in Microsoft Excel 2010 software and then analyzed using the R software - A Language and Environment for Statistical Computing (R Development Core Team, 2014). The sample was randomly divided into two subsamples: the training subsample (used to adjust the models) and the validation subsample (used to assess the predictive ability of the models).
The dependent variable is sustainability. Beneficiaries with a loss ratio (ratio between costs and revenues) greater than 0.75 are considered unsustainable. This variable was obtained for the year 2013.
For independent variables, the database used some quantitative (age and plan time) and some qualitative (gender, region, plan type, type of beneficiary and financial participation) variables from the profile of the beneficiaries, all collected for the year 2012. The database also includes the revenue of each beneficiary and the respective annual costs of consultations, hospital daily care expenses, support diagnosis and therapy services (SADT), fees, materials, medications, taxes, dentistry and others, for the years 2011 and 2012.
4.2 Data analysis
A descriptive analysis was initially made. It is possible, using descriptive statistics, to organize, summarize and describe key aspects of the characteristics of a data set. At this stage, measures of central tendency and of dispersion were calculated for quantitative variables and frequency tables were constructed for qualitative variables.
The analysis of the data was followed by inferential statistics, including t tests for independent samples to compare the means of quantitative variables in both groups (sustainable and unsustainable) and chi-square tests to assess the associations of the groups with the qualitative variables. When all the qualitative variables of this research were binary, chi-square tests were applied with Yates’ correction.
After these steps, we proceeded to the adjustment of supervised classification models, using logistic regression and classification trees.
Logistic regression is applied to a dichotomous dependent variable and the value estimated by the model is the probability that the event under study will occur (success, encoded with 1).
Hair et al. (2006) noted that because of its nature, logistic regression does not depend on assumptions of multivariate normality of the data, the equality of the matrices of variance and covariance and linear relationship between the dependent and independent variables, verifying the linearity in the logit, given by the natural logarithm of the chance of success.
The classification and regression trees algorithm (CART) can be used for both classification, if the dependent variable is categorical, and regression, if the dependent variable is continuous (Tufféry, 2011). This method is based on the binary division of a progressive set of data based on the sampling results of independent variables, seeking the creation of subsets that are more homogeneous.
Classification tables and ROC curves were used to evaluate the performance of the models adjusted by logistic regression and classification trees. The main measure of a ROC curve is the area under the curve (AUC), which represents the probability that a random observation extracted from the sample is assigned to the correct class.
5. rEsUlts
This section presents the results of the study, including a brief descriptive analysis of the data, the comparison of sustainable and unsustainable beneficiaries through inferential statistics (t tests and chi-square tests) and classification models of the risk of unsustainability.
5.1 Descriptive statistics
There is a predominance of sustainable beneficiaries in the plan, totaling nearly two-thirds of the total sample (64.01%). Women are the majority of the sample (57.89%) and the majority of beneficiaries live in the capital cities of the states (71.88%). The operator customer base, almost entirely, is concentrated in the northeast, with 99.30% of its beneficiaries. The percentage of users who have individual plans totals 83.96% and those with a family plan comprise 16.03% of the beneficiaries. The more balanced percentages are associated with the type of user, where 50.77% are contracting, and 49.23% are dependent. Finally, the major difference was between patients with and without financial participation, where the first group comprised 93.78% of the sample and the other, only 6.22%.
The costs associated with consultations and support diagnosis and therapy services (SADT), which includes the costs of activities that help diagnostics and therapies, are the most common, being the only costs with nonzero first quartile. By contrast, the expenses associated with hospital daily care and odontology are less frequent, with the third quartile equal to zero (at least 75% of the sample beneficiaries did not have these types of expenses in the period studied).
5.2 Inferential statistics
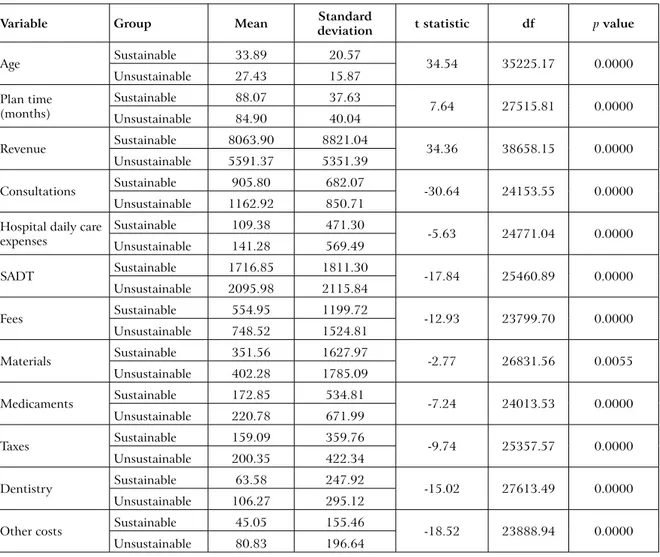
The second step of the analysis was based on inferential statistics. Table 1 presents the means and standard deviations of the quantitative variables segregated into groups, the statistical t tests performed and p values associated with those tests. It is clear that the various average costs are higher in the unsustainable group, while revenue is higher for the sustainable group. The t-tests show statistically significant differences between the two groups for all variables.
table 1 – comparison of quantitative variables between groups
Variable group mean standard deviation t statistic df p value
Age Sustainable 33.89 20.57 34.54 35225.17 0.0000 Unsustainable 27.43 15.87 Plan time (months) Sustainable 88.07 37.63 7.64 27515.81 0.0000 Unsustainable 84.90 40.04 Revenue Sustainable 8063.90 8821.04 34.36 38658.15 0.0000 Unsustainable 5591.37 5351.39 Consultations Sustainable 905.80 682.07 -30.64 24153.55 0.0000 Unsustainable 1162.92 850.71
Hospital daily care expenses Sustainable 109.38 471.30 -5.63 24771.04 0.0000 Unsustainable 141.28 569.49 SADT Sustainable 1716.85 1811.30 -17.84 25460.89 0.0000 Unsustainable 2095.98 2115.84 Fees Sustainable 554.95 1199.72 -12.93 23799.70 0.0000 Unsustainable 748.52 1524.81 Materials Sustainable 351.56 1627.97 -2.77 26831.56 0.0055 Unsustainable 402.28 1785.09 Medicaments Sustainable 172.85 534.81 -7.24 24013.53 0.0000 Unsustainable 220.78 671.99 Taxes Sustainable 159.09 359.76 -9.74 25357.57 0.0000 Unsustainable 200.35 422.34 Dentistry Sustainable 63.58 247.92 -15.02 27613.49 0.0000 Unsustainable 106.27 295.12
Other costs Sustainable 45.05 155.46 -18.52 23888.94 0.0000 Unsustainable 80.83 196.64
Source: Authors
The dependent variable associations with qualitative independent variables were evaluated using chi-square tests with Yates correction, as the contingency tables used were of the type 2x2. The results, presented in Table 2, show that for all variables except those related to the type of beneficiary, the null hypothesis of independence must be rejected: there is a dependent relationship between the independent variables and the group in which the beneficiary falls (sustainable or unsustainable).
table 2 – comparison of qualitative variables between groups
Variable category Sustainable Unsustainable total χ² df p value
Gender Female 13946 8286 22232 37.00 1 0.0000 (%) 62.73% 37.27% 100% Male 10939 5704 16643 (%) 65.73% 34.27% 100% Region Interior 6462 4468 10930 157.61 1 0.0000 (%) 59.12% 40.88% 100% Capital 18423 9522 27945 (%) 65.93% 34.07% 100% Type of plan Individual 22071 10569 32640 1148.16 1 0.0000 (%) 67.62% 32.38% 100% Family 2814 3421 6235 (%) 45.13% 54.87% 100% Type of beneficiary Dependent 12296 6843 19139 0.87 1 0.3515 (%) 64.25% 35.75% 100% Contracting 12589 7147 19736 (%) 63.79% 36.21% 100% Financial participation No 23501 12956 36457 51.07 1 0.0000 (%) 64.46% 35.54% 100% Yes 1384 1034 2418 (%) 57.24% 42.76% 100% Source: Authors 5.3 classification models
The classification models were adjusted for the beneficiaries of the modeling subsample, using the logistic regression and classification trees methods. The analysis of their performance in the validation sample was made through classification tables and ROC curves. This section presents the results obtained with these techniques.
5.3.1 Logistic regression
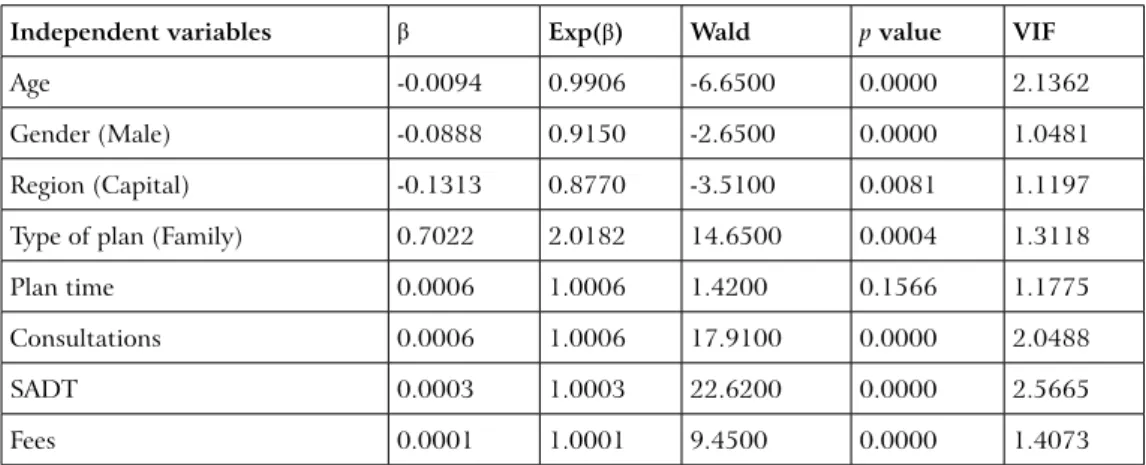
The first classification technique applied was logistic regression. The stepwise method was used to obtain the best combination of independent variables, able to distinguish the two groups of dependent variables. The adjusted logistic regression model is shown in Table 3.
table 3 – logistic regression adjusted model
Independent variables β Exp(β) Wald p value VIF
Age -0.0094 0.9906 -6.6500 0.0000 2.1362
Gender (Male) -0.0888 0.9150 -2.6500 0.0000 1.0481 Region (Capital) -0.1313 0.8770 -3.5100 0.0081 1.1197 Type of plan (Family) 0.7022 2.0182 14.6500 0.0004 1.3118
Plan time 0.0006 1.0006 1.4200 0.1566 1.1775
Consultations 0.0006 1.0006 17.9100 0.0000 2.0488
SADT 0.0003 1.0003 22.6200 0.0000 2.5665
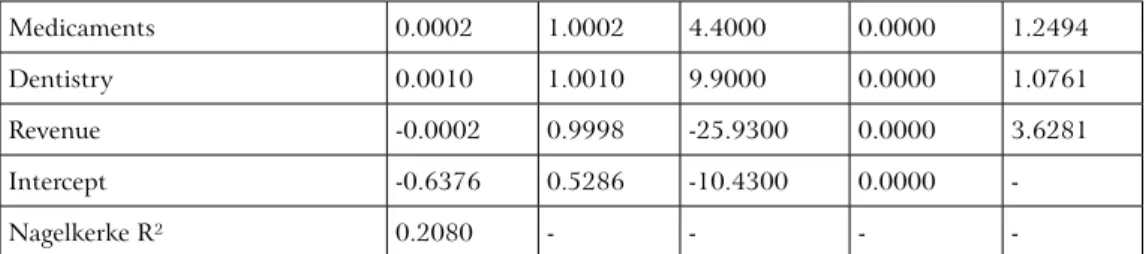
Medicaments 0.0002 1.0002 4.4000 0.0000 1.2494 Dentistry 0.0010 1.0010 9.9000 0.0000 1.0761 Revenue -0.0002 0.9998 -25.9300 0.0000 3.6281 Intercept -0.6376 0.5286 -10.4300 0.0000 -Nagelkerke R² 0.2080 - - - -Source: Authors
It can be seen from these results that all variables, except for the plan time, were considered significant for the estimation of sustainability of the beneficiary state for the next year. Age and revenue have negative impacts on the probability of a user becoming unsustainable in the following year. The behavior observed for the variable age in this sample can be considered unusual, since the age usually has a positive impact on cost.
According to the procedures described in the methodology, a cutoff point was determined in which the correct classification of the two classes were the most balanced possible. Figure 1 shows the precision rates for the sustainable and unsustainable groups for all possible cutoff points.
Figure 1 – cutoff points for the logistic regression
Cutoff point Pr eci si on 0.0 0.2 0.4 0.6 0.8 1.0 0.0 0.2 0.4 0.6 0.8 1.0 Sustainable Unsustainable Source: Authors
The point with the best balance between the two classes, that is, the one in which the precision is the same to sustainable and unsustainable, represented graphically as the meeting
of both curves, is thus approximately 0.3487. Using this cutoff point, the classification shown in Table 4 is obtained for the beneficiaries of the validation subsample.
table 4 – classification table of the logistic regression model
sustainable Predicted class total
Unsustainable Observed class Sustainable 8474 3910 12384 68.43% 31.57% 100.00% Unsustainable 2227 4826 7053 31.57% 68.43% 100.00% Total 10701 8736 19437 Source: Authors
The logistic regression model was able to correctly classify 68.43% of the validation subsample, and the predictive ability was the same in both classes of beneficiaries.
5.3.2 Classification tree
The second method used was the classification tree. Unlike logistic regression, it is not necessary to use any technique to choose the best predictor variables since that the algorithm itself chooses them, discarding all others that are not important for prediction.
Figure 2 is a visual representation of the tree constructed for the training subsample. It can be seen that the variables considered important for this classification were age and the type of plan for defining the user profile, and consultation, SADT and dentistry for costs and revenues.
The age variable presents behavior similar to that observed in the logistic regression. In this case, beneficiaries who are 44.2 years old or more were all classified as sustainable. As the logic of classification trees algorithm is to divide the group into subsets with greater internal homogeneity and heterogeneity among them, age is the variable with the greatest power of segregation between sustainable and unsustainable users.
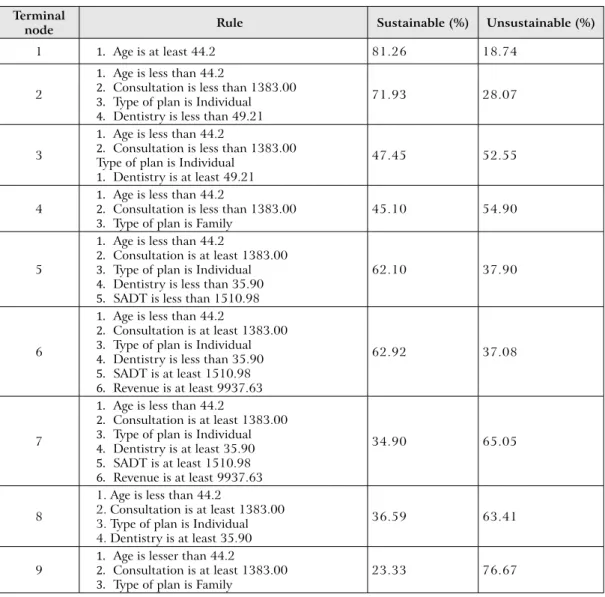
The method assigns the age variable to 28% of importance, while type of plan and revenue were assigned 16% of relevance for classification. Consultation and dentistry had 14% of importance and SADT had 5%. When comparing the results obtained in the classification tree and the logistic regression, it is concluded that the variables considered important in the tree are those with the greatest impact on the risk of unsustainability measured in the logistic regression. Table 5 summarizes the rules that form each terminal node of the tree.
table 5 – summary of nodes’ characteristics terminal
node rule sustainable (%) Unsustainable (%)
1 1. Age is at least 44.2 81.26 18.74
2
1. Age is less than 44.2
2. Consultation is less than 1383.00 3. Type of plan is Individual 4. Dentistry is less than 49.21
71.93 28.07
3
1. Age is less than 44.2
2. Consultation is less than 1383.00 Type of plan is Individual
1. Dentistry is at least 49.21
47.45 52.55
4 1. Age is less than 44.22. Consultation is less than 1383.00
3. Type of plan is Family 45.10 54.90
5
1. Age is less than 44.2
2. Consultation is at least 1383.00 3. Type of plan is Individual 4. Dentistry is less than 35.90 5. SADT is less than 1510.98
62.10 37.90
6
1. Age is less than 44.2
2. Consultation is at least 1383.00 3. Type of plan is Individual 4. Dentistry is less than 35.90 5. SADT is at least 1510.98 6. Revenue is at least 9937.63
62.92 37.08
7
1. Age is less than 44.2
2. Consultation is at least 1383.00 3. Type of plan is Individual 4. Dentistry is at least 35.90 5. SADT is at least 1510.98 6. Revenue is at least 9937.63
34.90 65.05
8
1. Age is less than 44.2
2. Consultation is at least 1383.00 3. Type of plan is Individual 4. Dentistry is at least 35.90
36.59 63.41
9 1. Age is lesser than 44.22. Consultation is at least 1383.00
3. Type of plan is Family 23.33 76.67
Source: Authors
Following the same procedure adopted previously, the cutoff point that best approximates the accuracy in test subsample of classes was verified. Unlike the logistic model, which associates a probability for each observation, all observations of a node in classification trees are given the same probability of belonging to the positive class (unsustainable). All possible cutoff points and accuracies in sustainable and unsustainable groups are shown in Figure 3.
Figure 3 – cutoff points for the classification tree model Cutoff point Pr eci si on 0.2 0.3 0.4 0.5 0.6 0.7 0.0 0.2 0.4 0.6 0.8 1.0 Sustainable Unsustainable Source: Authors
Due to the limited number of possible cutoff points, there is no restriction to a single ideal point; instead there is a range of possible points in which the classification in the two classes is more balanced. This interval ranges from 0.28145 to 0.36975, approximately. The percentages of accuracy in the validation sample, presented in Table 6, were obtained for a cutoff point of 0.3458.
table 6 – classification table of the cArt model sustainable Predicted class total Unsustainable Observed class Sustainable 9363 3021 12384 75.61% 24.39% 100.00% Unsustainable 3246 3807 7053 46.23% 53.98% 100.00% total 12609 6828 19437 Source: Authors
The adjusted tree was able to classify 67.76% of the total sample, with a precision of 75.61% for sustainable beneficiaries and 53.98% for unsustainable beneficiaries, in the test subsample.
The ROC curves obtained for the logistic regression and CART models, using the validation subsample, are presented in Figure 4.
Figure 4 – rOc curves for logistic regression and cArt models
False Positive Rate (1-Specificity)
Tr ue P os iti ve R at e ( S ens iti vi ty ) 0.0 0.2 0.4 0.6 0.8 1.0 0.0 0.2 0.4 0.6 0.8 1.0 Logistic CART Source: Authors
Figure 4 shows that the logistic regression model performed slightly better than the CART model. The area under the ROC curve (AUC) of the CART model is 0.6855, lower than that obtained for the logistic regression (0.7501).
6. cONclUsION
The administrators of Health Plan Operators face the challenge of economic and financially balancing a business embedded in a complex environment, and that is well supervised, with strict regulations and a consumer class that needs better guidance on the use of services. In this context, health care costs are gradually increasing for several reasons: the growth of new medical technologies, increased use of examinations, and an aging population, among others. These high costs in health care will not tend to reduce in the coming years; instead, they will increase more and more. The results of this research have improved our knowledge about the behavior of healthcare costs.
The results showed that most of the sample is composed of sustainable beneficiaries. The adjusted classification models showed good adjustment abilities, managing to correctly classify nearly 70% of the beneficiaries. These models are an added value for operators in strategic decisions involving the evaluation of the risk of unsustainability of its beneficiaries.
The most important predictors of classification were: age, type of plan, revenue, annual spending on consultation and on dental insurance.
A limitation of the study is that the sample, although large, was limited to employees of one company and their families. It was also limited to the northeast, especially the states of Ceará, Pernambuco and Bahia, which may reduce the power of generalization of the results. Another limitation identified is the lack of other profile variables of the beneficiaries, such as income and education, which could impact their risk of unsustainability.
It is suggested that future studies apply other sorting methods, such as neural networks, random forest and support vector machines. The inclusion of other sociodemographic variables of the beneficiaries is also recommended, as is the use of a more heterogeneous sample, so that the results can be generalized.
It is noteworthy that health promotion and disease prevention are aspects of health care that have not been considered among the health indicators proposed by the ANS, or by some operators. Preventive medicine may be a cost-reduction solution. It is also important to raise the awareness of beneficiaries about the need for rational use of the plan. Their joint participation in payments could encourage responsible use of the plan and strengthen the role of consumer oversight as to the transparency of healthcare costs included in Brazilian legislation and in use.
ACKNOWLEDGEMENTS
This paper was financed by National Funds provided by FCT - Foundation for Science and Technology - through project UID/SOC/04020/2013.
REFERENCES
Agência Nacional de Saúde Suplementar – ANS (2016). Caderno de Informação da Saúde Suplementar: Beneficiários, operadoras e planos de saúde. ANS. Brasília.
Araújo, E. (2003). O desafio da sustentabilidade nas APAEs: noções sobre captação de recursos e elaboração de projetos sociais. FEAPAES Informa. Federação das APAEs do Estado do Espírito Santo. Vitória.
Bartuska, T.; Kazimee, B.; Owen, M. (1998). Defining sustainability. In: Community sustainability: a comprehensive urban regenerative process. School of Architecture of the Washington State University. Washington.
Cechin, J. (2008). A história e os desafios da saúde suplementar: 10 anos de regulamentação. Saraiva. São Paulo.
Conway, G. (1986). Agroecosystem analysis for research and development. Winrock International. Bangkok.
Dovers, S.; Handmer, J. (1993). Contradictions in sustainability. Environmental Management. 20(3): 217-222.
Gil, A. (2002). Como elaborar projetos de pesquisa. 4th edition, Atlas. São Paulo.
Hair, J.; Anderson, R.; Tatham, R.; Black, W. (2006). Análise multivariada de dados. 6th edition,
Liverman, D.; Hanson, M.; Brown, B.; Merideth Jr., R. (1988). Global sustainability: toward measurement. Environmental Management. 12(3): 133-143.
Moore, J.; Johnson, J. (1994). Transportation, land use and sustainability: what is “sustainability”? Center for Urban Transportation Research. Tampa.
Olden, J.; Joy, M.; Death, R. (2004). An accurate comparison of methods for quantifying variable importance in artificial neural networks using simulated data. Ecological Modelling. 178: 389-397.
R Development Core Team (2014). R: A language and environment for statistical computing. R Foundation for Statistical Computing. Vienna.
Silva, J. (2007). Planos de saúde e boa-fé objetiva: uma abordagem crítica sobre os reajustes abusivos. JusPodium. Salvador.
Tufféry, S. (2011). Data mining and statistics for decision making. John Wiley & Sons Ltd. United Kingdom.
União Nacional das Instituições de Autogestão em Saúde – UNIDAS (2005). Autogestão em saúde no Brasil: 1980-2005 história da organização e consolidação do setor. UNIDAS. São Paulo.
Valadão Jr., V.; Malaquias, R.; Sousa, E. (2008). Controladoria como uma opção à sustentabilidade econômica nas organizações de terceiro setor: o caso de uma associação. Revista Contemporânea de Contabilidade. 1(9): 131-151.