Luciano Gaspary1,2, Luis F. Balbinot1, Roberto Storch1, Fabrício Wendt1 and Liane Tarouco1
1Federal University of Rio Grande do Sul
Instituto de Informática
Av. Bento Gonçalves, 9500 - Agronomia - CEP 91.591-970 Porto Alegre, Brazil
(hades, storch, wendt)@inf.ufrgs.br and [email protected]
2Universidade do Vale do Rio dos Sinos
Centro de Ciências Exatas e Tecnológicas Av. Unisinos, 950 - CEP 93.022-000
São Leopoldo, Brazil [email protected]
Abstract
This paper proposes an architecture for distributed man-agement of high-layer protocols and network services. Based on the IETF Script MIB, the Trace architecture provides mechanisms for the delegation of management tasks to mid-level managers (MLMs), which interact with monitoring and action agents to have them executed. The paper introduces PTSL (Protocol Trace Specification Lan-guage), a graphical/textual language created to allow net-work managers to specify protocol traces. The specifica-tions are used by mid-level managers to program the monitoring agents. Once programmed, these agents start to monitor the occurrence of the traces. The information obtained is analyzed by the mid-level managers, which may ask action agents for the execution of procedures (e.g. Perl scripts), making the automation of several man-agement tasks possible.
Keywords: Internet management, network management, network monitoring, scripting.
1
Introduction
The use of computer networks to support an increasing number of businesses and critical applications has stimu-lated the research for new management solutions that maintain not only the physical network infrastructure, but also the protocols and services that flow over it. The popu-larization of electronic commerce (e-commerce) and the increasing use of this business modality by companies, for instance, implies using the network to exchange critical data from the organization and from its customers. Proto-cols and services that support these applications are criti-cal and, therefore, need to be carefully monitored and managed.
Not only critical applications require special attention. New protocols are frequently released to the market to support an increasing set of specific functionalities. These protocols are quickly adopted by network users. As a re-sult of this fast proliferation, weakly-tested and even faulty protocols are disseminated to the market. In several cases these anomalies, as well as the miscalculated use of resources, are the cause of network performance degrada-tion and end up unperceived by network managers. These factors make the management of these protocols and serv-ices an ever increasing endeavor.
For the network manager to be able to provide assured network high-availability and efficiency, a flexible man-agement environment that can be quick and easily adapted to monitor dynamic scenarios is needed. Besides being flexible, the size of current networks requires this management environment to be distributed, so that the solution can be efficient and scalable.
This paper presents an architecture for distributed and flexible management of high-layer protocols and network services based on programmable agents and is organized as follows. Section 2 describes and compares expressive initiatives related to both high-layer protocol and distrib-uted management. Section 3 presents PTSL, a graphi-cal/textual language created to specify protocol traces. Section 4 introduces the Trace architecture and its com-ponents. In Section 5 some cases studies that validate the proposal are presented. Section 6 closes the paper by pre-senting an evaluation of the proposed architecture, some conclusions and future work.
2
Related Work
it comes to high-layer protocols management, monitoring is the main topic of research. The ntop [1] is designed for traffic measurement and monitoring, and includes fea-tures for per-protocol network traffic characterization and usage. The Remote Network Monitoring Management In-formation Base Version 2 (RMON-2) [2], created in 1997, provides mechanisms to collect information similar to
ntop .
Other recent efforts related to monitoring are the extensi-ble architecture proposed by Malan and Jahanian [3] and the Realtime Traffic Flow Measurement (RTFM), devel-oped by the group with the same name at the IETF [4] and implemented by the NeTraMet tool [5]. The RTFM ar-chitecture is based on distributed agents (called meters) that implement the RTFM Meter MIB [6]. These agents are capable of making realtime packet flow measurement and accounting. The MIB allows an SNMP agent to query statistical data, as well as set agent configuration data. Flow specifications are made through a set of rules de-fined by a language called SRL [7] and determine (a) which flows should be counted, (b) which nodes should be treated as flow origins and (c) which level of detail is de-sired for each flow.
A demand instigated by the fast proliferation of protocols and applications that flow over today’s computer networks is the flexibility of monitoring tools. Many existing tools are not completely prepared to allow the monitoring of new protocols and applications and operate on a fixed set of them. New protocols can only be monitored through firmware updates, as with some RMON-2 probes, or by low-level programming languages, like the architecture proposed by Malan and Jahanian and the ntop tool. Many network managers just end up neglecting these pos-sibilities due to their complexity.
Other solutions, like Tivoli Enterprise [8], are intrusive, due to the fact that they require applications to be devel-oped using specific monitoring procedure calls. This ap-proach is only suitable when monitoring is done within applications developed in-house, but it can not be used to manage proprietary protocols and/or applications (e.g. web browsers and clients). Besides, it is also needed to spend more money on personnel training on how to use the monitoring APIs.
The type and granularity of the collected information are important aspects associated with the monitoring. The RMON2 MIB and the ntop tool collect only statistics like the number of packets sent/received by a host or the number of packets exchanged between two peers, classi-fied accordingly to the protocol used (e.g. HTTP and FTP). Advantages and disadvantages of the RMON2 MIB
have been shown by Gaspary et al. in [9]. One of the weaknesses of both approaches is the lack of information related to performance and faults. These difficulties have been discussed by the IETF RMON working group through the Application Performance Measurement MIB (APM MIB) [10].
When it comes to granularity, accounting on the RMON2 MIB is made per host, pairs of hosts and protocol used. In the case of the ntop tool, it is possible to recognize and count packet flows, which are specified by a set of low-level rules that are processed by the BSD Packet Filter (BPF). In the RTFM architecture, only predetermined pro-tocol fields can be read from captured packets (only up to the transport layer). Information about high-layer proto-cols can not be considered due to this limitation. Besides, as it occurs with the ntop tool, the same set of rules is applied to each captured packet, making it impossible to correlate messages from a same flow.
That is also very important to note that many management tools like [1, 3, 5] are limited to monitoring, leaving reac-tive and/or proacreac-tive management to the human manager when an unexpected network behavior is observed.
As for distributed management, Schoenwaelder et al. pre-sent in [11] several approaches and existing technologies for its deployment. Technologies based on the dynamic delegation of management tasks and, in special, the poten-tial of delegation of those tasks through the IETF Script MIB [12] are discussed and commented. By using practi-cal examples, they show how the monitoring of thresholds and services can be delegated to mid-level managers.
The next sections present a new approach for high-layer network protocols and services management. The evalu-ation of this approach contrasted to other approaches men-tioned earlier in this section is presented in Section 6.
3
Protocol Trace Representation
3.1 Graphical
PTSL
The network manager can create a specification to moni-tor the whole protocol or just part of it. Interactions be-tween more than one protocol can also be represented. Figure 1 shows two trace examples. On the first case (a), the trace monitors successful transactions to a web server. The second trace (b) does not describe a single protocol; it
is rather made up of a name resolution request (DNS pro-tocol), followed by an ICMP Port Unreachable
message. This trace occurs when the host where the serv-ice resides is on, but the named daemon is not running.
Figure 1: Graphical representation of a trace. (a) Successful WWW re-quest. (b) DNS request not replied because named daemon is not execut-ing.
3.1.1 Representation of states and transitions
States are represented by circles. From the initial state (idle) other n states can be created, but they must always be reachable through any given transition. The final state is identified by two concentric circles. On both examples (figure 1) the initial and final states are the same. The state transitions are represented by unidirectional arrows. The continuous arrow indicates that the transition is triggered by the client host, while the dotted arrow determines that the transition is triggered by an event coming from the server host. The text associated with a transition is merely a label to the event that triggers it; the full specification can only be made via textual notation.
3.1.2 Representation of timers
Transitions, by default, do not have a time limit to be trig-gered. To associate a timeout with a transition, an explicit value (in milliseconds) must be set. In the example shown in figure 1a, the value 5000 associated to transition
HTTP/1.1 200 indicates that the transition from state 2
to the initial state has up to five seconds to be triggered.
3.1.3 Representation of information for cataloguing and version control
The graphical notation also offers a constructor where in-formation about the trace, which are relevant to catalogu-ing and version control of specifications, are included (see figure 1). The data stored for a trace are:
Version (the version of the specification), Description
(a brief description of the trace), Key (keywords related to the trace), Owner (individual responsible for the trace definition) and Last Update (timestamp of the last up-date). Besides these data, there is also a Port field, used to indicate the TCP or UDP port of the monitored proto-col; this should only be defined when the trace is limited to a single protocol.
3.2 Textual
PTSL
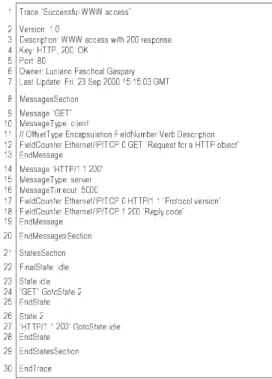
Figure 2 presents the textual specification of the trace pre-viously shown in figure 1a. All specifications written in Textual PTSL start with the Trace keyword and end with the EndTrace keyword (lines 1 and 30). Catalog and version control information come right after the Trace
keyword (lines 2-7). Forthwith, the specification is split into three sections: MessagesSection (lines 8-20),
GroupsSection (not used in this example) and
StatesSection (lines 21-29). On MessagesSec-tion and GroupsSection the events that trigger tran-sitions are defined. The FSM that specifies the trace is de-fined in StatesSection.
3.2.1 Representation of messages
Whenever the fields of a captured packet match the ones specified at a Message for the current state, a transition is triggered in the FSM. The way those fields are specified depends on the type of protocol to be monitored. In the case of variable-length character-based protocols where fields are split by white space characters (HTTP and SMTP, for instance), the identification of a field is made by its position within the message (this is called the
FieldCounter strategy). In HTTP/1.1 200, for in-stance, HTTP/1.1 is at position 0 and 200 is at position 1. On the other hand, the identification of binary proto-cols, known by their fixed length fields (e.g. TCP), is de-termined by a bit offset starting from the beginning of the protocol header; it is also needed to specify the size of the field, in bits (this is the BitCounter strategy).
The trace shown in figure 1a is for a character-based pro-tocol. The GET message specification is shown in figure 2 (lines 9-13). In line 10 the message is defined as being of type client, meaning that the state transition associated with the message will be triggered by the client host. In line 12 the only field to be analyzed is specified. The in-formation necessary to identify it are: fetch strategy (FieldCounter), protocol encapsulation ( Eth-ernet/IP/TCP), field position (0), expected value (GET) and, optionally, a field description. Character-based protocol fields are always identified by this quintuple. The trace reply message HTTP/1.1 200 is shown in lines 14-19. The message type is defined in line 15 as server, i.e., the state transition will be triggered by the server host. In line 16 the MessageTimeout is set to 5000. Finally, the two fields to be analyzed are defined (lines 17 and 18).
As opposed to the example mentioned above, the trace specified by the messages in figure 1b is based on binary protocols, DNS and ICMP. A DNS request will trigger a state change on the FSM from idle to 2. To recognize a DNS request from the packets flowing over the network two fields must be observed: QR (when set to 1 indicates a request to the server) and OPCODE (when set to 0 repre-sents a standard query). Field QR is 16 bits away from the beginning of the header and its size is 1 bit. Field OP-CODE starts in the seventeenth bit and occupies 4 bits. Figure 3 presents the textual specification of a DNS re-quest (lines 1-6). In line 4 the QR field is defined. The in-formation needed to identify a binary protocol field are: fetch strategy (BitCounter), protocol encapsulation (Ethernet/IP/UDP), field position (16), field length (1), expected value (1) and, optionally, a field description. The information used to identify the OPCODE field are
BitCounter, Ethernet/IP/UDP, 17, 4 and 0. The
same strategy is used in the definition of ICMP mes-sage Port Unreachable in lines 7-11.
3.2.2 Representation of message groups
The PTSL language allows the binding of a single transi-tion to multiple distinct events. To do that, the Group
constructor must be used within the GroupsSection
section. The trace presented in figure 1a monitors the oc-currence of successful HTTP accesses. However, only ac-cesses with reply code 200 are counted. Acac-cesses with re-ply codes 201, 202, 203, 204, 205 and 206, that also repre-sent successful operations, could be included into this ac-counting. For that to be possible, the messages that iden-tify these accesses must be defined (similarly to lines 14-19 in figure 2) and grouped (see figure 4). In lines 2-3 all messages that make part of the group are listed. In the graphical representation (figure 1a), the label associated with the transition from state 2 to idle changes from
HTTP/1.1 200 to HTTP/1.1 20X, which is the name of the new message group (line 1 below).
Figure 3: Field identification in binary protocols
Figure 4: Representation of message groups
3.2.3 Representation of the FSM
Lines 21-29 in figure 2 define the textual specification of the state machine shown in figure 1a. The final state is identified just after StatesSection (line 22). The states idle and 2 are defined in lines 23-25 and 26-28. The state specification only lists the events (messages and groupings) that may trigger transitions, indicating, for each one, which is the next state (lines 24 and 27).
4
The Trace Architecture
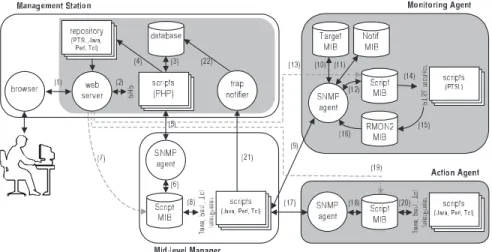
model, it supports the distributed management of high-layer protocols and network services. Figure 5 illustrates the architecture’s scheme. Based on the IETF Script MIB [12], it provides mechanisms to allow a management sta-tion to delegate management tasks to mid-level managers (MLMs) that, in turn, interact with monitoring and action agents to execute these tasks. PTSL specifications are used by MLMs to program monitoring agents that start sniffing packets flowing on the network and wait for traces to happen. With the information gathered from the monitoring process, the MLMs may launch procedures on action agents (Tcl or Perl scripts), enabling the automation of several management tasks (including reactive and proactive tasks). The architecture also has notification mechanisms (traps) so that agents are able to report asyn-chronous events to scripts running on MLMs. These MLMs are then able to filter and/or correlate these traps and signal the occurrence of major events to the network management station (NMS). The components of the archi-tecture are presented below.
4.1
Management Station
The architecture is made of one or more management sta-tions (managers). If the interfaces between all components are respected, nothing hinders management applications from being developed with different technologies. How-ever, figure 5 suggests a web-based management inter-face. Through a web browser, the human manager has ac-cess to the management environment located in a web server. For convenience, our research group chose the PHP language and the MySQL database to develop this environment. The highlighted modules on the manage-ment station may be hosted in the same host where the manager resides. If there is more than one management station, they may share the same environment core.
The most important tasks accomplished by the network manager from a management station are:
• Registration of MLMs and agents: to ease the
coordina-tion between the management stacoordina-tion, MLMs and agents, the network manager must define who are the MLMs on the network, as well as the agents located (hierarchically) bellow these managers. This binding is important to define management boundaries. When programming a management task, the MLM will only manipulate those agents it is a parent of. The necessary interactions to this registration are presented in figure 5 (numbers 1, 2 and 3). This numbering will be used henceforth in this section to illustrate the architecture’s data flow.
• Specification of a protocol trace (PTSL script): using
the language introduced in Section 3, it is possible to specify a protocol trace. The network manager may specify the trace from scratch or reuse existing traces stored in a repository, derivating a new specification based on previously defined traces (flows 1, 2 and 3 in figure 5). For further use of this trace specification, it must be mapped from the database to a text file and put within the repository (4).
• Specification of an action (Java, Perl or Tcl script): the
action scripts do not necessarily have to be specified using the web-based environment facilities. It is possi-ble to upload a script developed in Java, Perl or Tcl to the repository (1, 2 and 4). It is recommended to ex-haustively test these scripts before sending them to a re-pository. Most Script MIB runtime environments offer debugging capabilities, but some do not.
• Specification of a management task (Java, Perl or Tcl
script): by using a wizard the management environment provides, the network manager specifies a management task (flows 1, 2 and 3 in figure 5). When defining the task, the network manager informs the trace to be ob-served, the identification of the object belonging to the extended RMON2 MIB (explained later), where the ob-servation of the chosen protocol trace will be counted, the polling interval and the actions to be triggered when certain thresholds are reached. These specifications, as usually happens with PTSL specifications, are kept within the database.
• Delegation of a management task: to delegate a task to
an MLM, the task must be retrieved from the database (1, 2 and 3). Besides, the network manager must choose the mid-level manager, the monitoring agent and the action agent (the latter is not mandatory) that will be re-sponsible for the execution of the task. A corresponding Tcl script is automatically generated and made avail-able at the repository (4). After going through these steps, the execution of the script is delegated to the MLM (5, 6) via SNMP (Script MIB).
• Monitoring of a management task: during the execution
Figure 5: Components of the Trace architecture
• Interruption of a management task: the interruption of a
management task requires the removal of all program-ming made on the monitoring and action agents in-volved. Only after that it will be possible to terminate the execution of the script (i.e. the management task) at the MLM (1, 2, 5 and 6). It is important to mention that the latest release of the Script MIB provides mecha-nisms to automatically expire and remove old (possibly forgotten) entries.
• Receiving and viewing traps: the manager may receive
traps through a module called Trap Notifier (21). When received, all traps are stored in the database (22). Traps are permanently retrieved by a script (3) that updates the manager’s web browser (2 and 1) using the HTTP push technology.
4.2
Mid-level Manager
The MLM runs and monitors management tasks delegated by NMSs and reports major events back to these stations. There may be one or more MLMs inside each network. The number of MLMs is determined by the network man-ager and depends on several factors (e.g. the size and complexity of the network infrastructure or human admin-istrative boundaries).
The delegation of a task to a MLM, as mentioned, is per-formed by NMSs through SNMP primitives, which are supported by the PHP language (flows 5 and 6 in figure 5). When a new entry is created on the Script MIB launch table, the agent automatically downloads the script from the configured URL (7). After this table entry is enabled, the agent is then ready to start running the script (8).
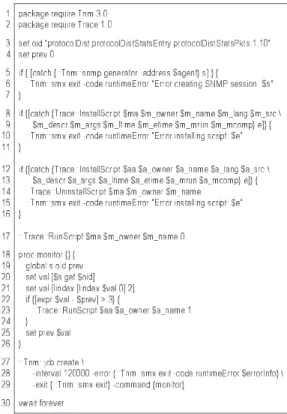
As stated before, the management tasks specified by the network manager are automatically converted to Tcl
scripts in order to be run by MLMs. Although Jasmin [14] (the Script MIB implementation used in our prototype) also supports Java and Perl, we have chosen Tcl because it has inherent network management characteristics and sev-eral libraries to support network management operations, besides being flexible and portable. The complexity of scripts run by MLMs is not a critical factor since all speci-fication and delegation of management tasks is made by wizards, even though Tcl scripts can be easily written and understood by those not familiar with the language.
Figure 6 presents a sample script used to monitor the oc-currence of a trace. In lines 8-11 and 12-16 the monitoring and action agents are programmed, respectively. The monitoring agent is, in line 17, asked to start observing the network for the occurrence of the trace just programmed. Then, the MLM polls it every 120 second (line 28) to get information (lines 3 and 20) and checks whether the trace has been counted or not (line 22). If the trace has been ob-served three times within an interval, another script is launched at the action agent (line 23), to run a manage-ment procedure. Intermediate and final results are gener-ated by the script (lines 28 and 29) and made available in the Script MIB.
NMS (21). This configuration of trap sinks eases the im-plementation of monitoring and action scripts, since they do not have to care about which are their trap sinks and which credentials should be used to send them.
Figure 6: Sample script run by MLMs
It can be noted that the communication between MLMs and monitoring or legacy SNMP agents (handled by the Tcl scripts) is made through SNMP primitives provided by Tcl through the Scotty package. The same happens be-tween MLMs and the management station when traps are sent. The programming of the Script MIB on the monitor-ing (9, 12) and action agents (17, 18) is made with the aid of a specially developed Tcl package (line 2 in 6), called Trace.
4.3
Monitoring Agent
The monitoring agents count the occurrence of traces on the network segment where they are located. They are said extensible because the monitoring traces can be dynami-cally configured. This flexibility is possible through the PTSL language. These agents read PTSL files, organize some data structures in memory and start the monitoring process.
The configuration of which traces should be monitored at a given moment is made by the MLM through the Script MIB (9 and 12). On the script run by the MLM (figure 6)
it is possible to see how the monitoring agent is pro-grammed (lines 8-11). One of the parameters passed is the URL of the script (PTSL specification) that will be run. When the MLM requests the installation and execution of a script, it is retrieved from the repository via HTTP (13) and executed (14).
Actually, the PTSL is not executable. The semantics asso-ciated to line 17 in figure 6 makes the monitoring agent start monitoring a new trace. In an analogous way, the in-terruption of a script on the Script MIB means program-ming the monitoring agent so that it ceases monitoring the trace defined by the script.
Every time a trace is observed between any pair of peers, data are stored in a MIB similar to RMON2 [2, 9] (15). One of the differences between this MIB and the RMON2 MIB is that the protocolDir group, which indicates which protocol encapsulations the agent is capable to monitor, now allows protocol traces to be indexed.
The alMatrix group from the RMON2 MIB stores sta-tistical data about the trace when it is observed between each pair of peers. Table 1 illustrates the contents of the
alMatrixSD table. It accounts the number os pack-ets/octets between each pair of peers (client/server).
Table 1: Information from the alMatrixSD table
One disadvantage of the RMON2 MIB is that it does not have the capability to generate information about perform-ance. For this reason, our group is currently evaluating the possibility of using an extension to the RMON2 MIB, the Application Performance Measurement MIB [10]. Table 2 presents the type of information stored by this MIB. The first line indicates that the Successful WWW access
trace was observed 127 times between hosts
172.16.108.1 and 172.16.108.254. The number of traces that did not complete with success was 232 and the mean response time for successful observations was 6
seconds.
4.4
Action Agent
Through monitoring agents, MLMs are able to evaluate whether a trace has occurred or not. Traces may represent network service failures, intrusion attempts, service per-formance degradation, and other problems. In this context, the action agents are responsible for the execution of reac-tive (and potentially proacreac-tive) management procedures created to autonomously handle these problems. Let’s take, for instance, the DNS service monitoring. When a mid-level manager detects that the service is not running (through the monitoring loop), it can ask an action agent (located on the same host of the service) to run a script to restart the service such as the one shown in figure 7.
Figure 7: Perl script to restart the daemon named
The communication between MLMs and action agents is made through the Script MIB (see flows 17 and 18 in fig-ure 5). Once the Script MIB is programmed to run an ac-tion script, it is retrieved via HTTP from the repository (19) and then executed (20). The script illustrated in figure 7 was written using Perl language. Although most network managers are more familiar with Perl, this language is not mandatory; Java and Tcl can also be used.
5
Case Studies
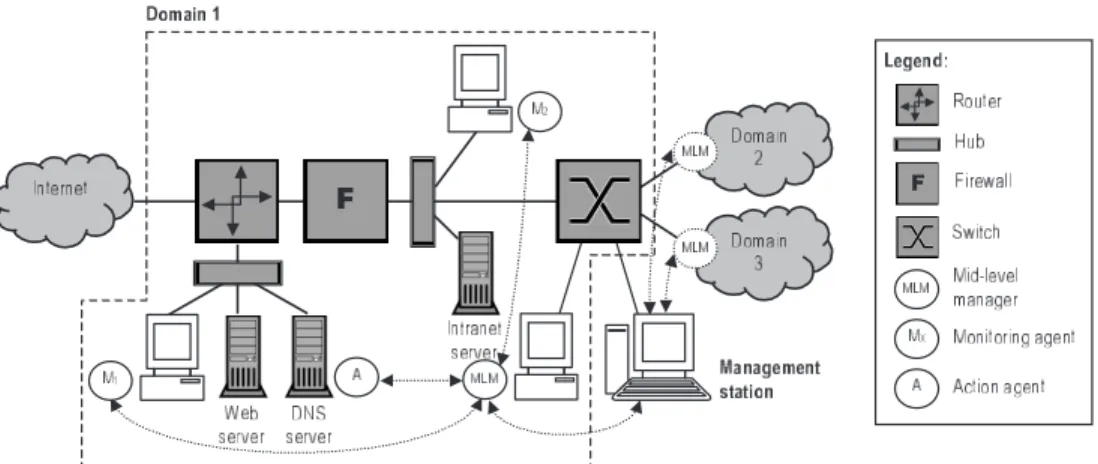
The Trace architecture was designed to allow the man-agement of all functional areas (FCAPS). Our group ex-plored, through a case study, the characteristics of the ar-chitecture to validate its applicability on the management of high-layer protocols and network services. Figure 8 shows a real management scenario, composed of three do-mains. The organization of these domains is a task that the network manager must handle to efficiently use the
archi-tecture. This task is accomplished at the management en-vironment when the MLMs and the agents are configured.
Domain 1 is composed of equipment and services related to the organization’s Internet access (dark gray in the fig-ure). The router acts as a gateway for three distinct net-works: the Internet, the internal network demilitarized zone (where the web and DNS servers are) and the pro-tected intranet (with an Intranet server). There are two monitoring agents (M1 and M2) installed on dedicated monitoring stations and one action agent installed on the same host where the DNS server resides. Based on this scenario, our work group defined some management tasks.
5.1
Monitoring of the DNS Service
Availability
This management task consists in observing the availabil-ity of the name resolution service. Through the Tcl script presented in Figure 6, the mid-level manager responsible for domain 1 programs the monitoring agent M1, which is located on the same segment as the DNS server, in order to watch for the occurrence of the trace DNS service monitoring (figure 1b). If this trace is observed at least three times during a polling interval, the mid-level man-ager will request the action agent A to launch the script that restarts the service (figure 7).
5.2
Accounting Accesses to the Web Server
This task consists in measuring the amount of accesses to the web server, not only successful accesses, but also ac-cess failures and unauthorized acac-cess attempts. These in-formation allow the manager to, for instance, (a) know the most critical access times and upgrade or configure the server to support more simultaneous connections, (b) count the occurrence of problems with HTTP clients and minimize the problem by revising the pages and (c) recon-figure the web server and/or the firewall to no longer ac-cept connections from hosts where unauthorized access at-tempts came from.
Figure 8: A network and some services
The monitoring of accesses to the web server located on the external network is done by programming the monitor-ing agent M1, while the web server responsible for the In-tranet is monitored through the monitoring agent M2. Each monitoring process makes part of distinct management tasks, even though they run similar procedures.
5.3
Security Management of DNS and Web
Servers
The DNS and web servers located on the external network may be vulnerable to malicious exploits coming from the Internet. The security monitoring of these services consists in monitoring the hosts where they are located and check whether they are victims of port scans, denial of service attacks, among other exploits that can be detected pas-sively.
A port scan consists of sending packets to a range of ports of a host to know which TCP and UDP services are avail-able. When using TCP, if the host does not have a service listening in a determined port, it will send back a TCP packet with the RST bit on in response to the connection attempt. Figure 9a and b presents this trace.
The mid-level manager programs the monitoring agent M1 to start monitoring the trace. Furthermore, it will peri-odically poll the extended RMON2 MIB where the moni-toring results are stored (see table 1). If during a polling interval the number of occurrences of the trace is higher than a determined value, defined by the manager, the script will generate a notification to the central manage-ment station.
A similar procedure is done when one of the stations suf-fers from an attack known as SYN Flood. This attack con-sists of sending a huge number of connection setup pack-ets (TCP packet with the SYN flag on) with a fake source
address to a target host. This fake address must be un-reachable or non-existent (usually a reserved value). When the target host receives these SYN packets, it creates a new entry on its connection table and sends back a
SYN/ACK packet to the possible client. After sending the reply packet, the target host waits for an acknowledge from the client to establish the connection. As the source address is fake, the server will wait a long time for this re-ply. In a given time, the connection queue of the server will be full and all new connection requests will be dis-carded, creating a denial of service. This state will last un-til the entries on the connection table start to timeout.
The identification of this attack is done by the trace shown in figure 10. Unlike other examples presented, this attack is identified by observing unsuccessful occurrences of the trace. This information is stored at the APM MIB, as shown in table 2.
Figure 10: The SYN Flood attack
6
Conclusions and Future Work
This paper presented an architecture for distributed man-agement of high-layer protocols and network services based on the use of programmable agents. Motivated by the increasing demand by organizations that need to man-age high-layer protocols and their critical applications, this work proposed a flexible architecture that is able to keep up with the fast proliferation of protocols and net-work applications (that must be managed). Based on the IETF SNMP standard, this architecture does not require major changes in existing management systems (which took years to consolidate).
The proposal of the PTSL language is one of the most im-portant contributions of this work. All approaches dis-cussed and listed in Section 2 are limited to the accounting of sent/received packets between pairs of peers, class-ifying them based on protocols [2] or flows [1, 5]. In these approaches, the manager has access to information limited to the style “host A sent n octets/packets to host B”, with filters to some well-known protocols (e.g. HTTP and SMTP) or packets with specific header fields. The innova-tions aggregated with PTSL increase the granularity in which protocols are monitored, enabling the analysis of the behavior of a protocol or just part of a protocol by in-troducing the representation of desired traces. This pro-vides the network manager with more accurate informa-tion, which will help him to deploy fault, configurainforma-tion, accounting, performance and security management to high-layer network protocols and services. Using the pre-vious example, the language allows the accounting of suc-cessful, unsuccessful and unauthorized HTTP accesses, as well as many other possible HTTP behaviors. The PTSL power of expression is another strong point. While many approaches allow the selection of packets based on a few predetermined header fields only up to the transport layer
[5], PTSL goes further, allowing the use of filters based on any protocol, all the way up to the application layer.
Integrated management is an inherent characteristic of the architecture. Instead of using specific tools to monitor in-dividual protocols and services (e.g. web, video-on-de-mand and email), one can use the Trace architecture to monitor such protocols and services through a unified framework. By delegating the functionality of these tools to distributed management stations, our approach burdens off the workload on the hosts where these services are in-stalled.
One positive aspect of the Trace architecture is the possi-bility of making effective management of high-layer net-work protocols and services by integrating the PTSL lan-guage with programmable monitoring agents and by asso-ciating the occurrence of specific traces to dynamically programmable actions, enabling the automation of a set of management procedures. The proposed architecture is not limited to monitoring, to the contrary, it provides a more complete and broader solution that includes the execution of actions, enabling both reactive and proactive manage-ment.
Another positive aspect of the architecture is a significant increase of scalability in relation to the traditional SNMP management paradigm, since it can delegate management tasks, previously processed only at the centralized man-agement station, to MLMs. The robustness aggregated to the management tasks also represents an important contri-bution. The architecture allows the delegation of manage-ment functions to MLMs that are closer to the monitored agents; if the connection is lost between the centralized management station and the MLM, these management tasks will still be able to run. The delegation is not only about tasks, but it will also delegate CPU cycles and will keep polling as close as possible to the management tar-gets.
However, this distributed architecture demands more work to be controlled. The component management becomes a quite complex task. Included in the component manage-ment are the distribution and update of scripts, the re-trieval and correlation of results. One of the proposed fu-ture works is the creation of mechanisms that provide an even more transparent use of the architecture.
any-more, giving more power to specifications. Performance tests were not carried out yet, but Schoenwaelder presents good results in [11], where the Jasmin implementation was evaluated.
References
[1] L. Deri and S. Suin, “Ntop: Beyond Ping and Tracer-oute” Proc. 10th IFIP/IEEE Workshop on Distributed Systems: Operations and Management, Zurich, Oct. 1999, pp. 271-283, Springer Verlag.
[2] S. Waldbusser, “Remote Network Monitoring Manage-ment Information Base Version 2 using SMIv2”, RFC 2021, INS, Jan. 1997.
[3] G. Malan and F. Jahanian, “An Extensible Probe Archi-tecture for Network Protocol Performance Measure-ment”, in Proc. of SIGCOMM, Vancouver, Sep. 1998.
[4] N. Brownlee, C. Mills, and G. Ruth, “Traffic Flow Measurement: Architecture”, RFC 2722, The University of Auckland, GTE Laboratories Inc., GTE Internetwork-ing, Oct. 1999.
[5] N. Brownlee, NeTraMet,
http://www.auck-land.ac.nz/net/Internet/rtfm/.
[6] N. Brownlee, “Traffic Flow Measurement: Meter MIB”, RFC 2720, The University of Auckland, Oct. 1999.
[7] N. Brownlee, “SRL: A Language for Describing Traffic Flows and Specifying Actions for Flow Groups”, RFC 2723, The University of Auckland, Oct. 1999.
[8] C. Cook et al., An Introduction to Tivoli Enterprise, First edition, International Technical Support Organization, 1999, http://www.redbooks.ibm.com.
[9] L. P. Gaspary and L. R. Tarouco, “Characterization and Measurements of Enterprise Network Traffic with RMON2”, Proc. 10th IFIP/IEEE Workshop on Distrib-uted Systems: Operations and Management, Zurich, Oct. 1999, pp. 229-242, Springer Verlag.
[10] S. Waldbusser, “Application Performance Measurement MIB”, Internet Draft, Jul. 2001.
[11] J. Schoenwaelder, J. Quittek, and C. Kappler, “Building Distributed Management Applications with the IETF Script MIB”, IEEE Journal on Selected Areas in Com-munications, vol. 18, no. 5, pp. 702-714, 2000.
[12] D. Levi and J. Schoenwaelder, “Definitions of Managed Objects for the Delegation of Management Scripts”, In-ternet Draft, Nortel Networks, TU Braunschweig, June 2001.
[13] L. P. Gaspary, L. F. Balbinot, R. Storch, F. Wendt, and L. R. Tarouco, “Towards a Programmable Agent-based Architecture for Enterprise Application and Service Management”, in Proc. First IEEE/IEC Enterprise Net-working Applications and Services Conference, Atlanta, June 2001, Piscataway, USA: IEEE Operations Center, 2001. p. 39-46.
[14] TU Braunschweig, NEC C\&C Research Laboratories, Jasmin - A Script MIB Implementation, 1999, http://www.ibr.cu.tu-bs. de/projects/jasmin.
[15] D. Levi, P. Meyer, and B. Stewart, “SNMP Applica-tions”, RFC 2573, SNMP Research Inc., Secure Comput-ing Corporation, Cisco Systems, Apr. 1999.