648 Brazilian Journal of Physics, vol. 36, no. 3A, September, 2006
Numerical Simulation of
N-vector Spin Models in a Magnetic Field
Tereza Mendes and Attilio Cucchieri
Instituto de F´ısica de S˜ao Carlos – Universidade de S˜ao Paulo C. P. 369, 13560-970, S˜ao Carlos, SP, Brazil
Received on 3 October, 2005
Three-dimensionalN-vector spin models may define universality classes for such diverse phenomena as i) the superfluid transition in liquid helium (currently investigated in the micro-gravity environment of the Space Shuttle) and ii) the transition from hadronic matter to a quark-gluon plasma, studied in heavy-ion collisions at the laboratories of Brookhaven and CERN. The models have been extensively studied both by field-theoretical and by statistical mechanical methods, including Monte Carlo simulations using cluster algorithms. These algorithms are applicable also in the presence of a magnetic field. Key quantities for the description of the transitions above — such as universal critical amplitude ratios and the location of the so-called pseudo-critical line — can be obtained from the models’ magnetic equation of state, which relates magnetization, external magnetic field and temperature. Here we present an improved parametrization for the equation of state of the models, allowing a better fit to the numerical data. Our proposed form is inspired by perturbation theory, with coefficients determined nonperturbatively from fits to the data.
Keywords: N-vector models; Equation of state; Scaling; Universality, Goldstone modes
I. INTRODUCTION
The N-vector (continuous-spin) models are proposed as class representatives for phase transitions in several interest-ing physical systems, such as the superfluid transition in liquid helium, in theN =2 case [1], and the deconfinement tran-sition in quantum chromodynamics (QCD) with 2 flavors of light quarks, in the N =4 case. The deconfinement phase transition is obtained when hadrons (e.g. protons and neu-trons) melt into a quark-gluon plasma at very high tempera-tures, such as the temperatures that were present at beginning of the universe. There is great interest in describing this tran-sition and in obtaining the properties of the high-temperature phase, a new state of matter that might be present today in the interior of neutron stars. In the case of two degener-ate light quark flavors (i.e. up and down), the transition is believed to be described by the three-dimensional 4-vector model. More precisely, one invokes the effective σ-model [2], a (three-dimensional) Ginzburg-Landau effective theory written assuming universality and respecting the chiral sym-metry of QCD. The theory relates the QCD order parameter, which is the chiral condensate<ψ ψ>(whereψis the quark field), to the magnetization of a continuous-spin model. The analogue of the magnetic fieldHis given by the (nonzero but small) quark mass and the reduced temperature is defined for lattice QCD ast∼6/g2−6/gc2(0), wheregis the lattice cou-pling. For two quark flavors one then obtains — if transition is second order — a three-dimensional 4-vector model in the presence of a magnetic field. The equivalence just described allows one to study critical properties of the QCD phase tran-sition from the spin-model equation of state. One of these properties is the so-called pseudo-critical line, the analogue of the critical point for the case of nonzero magnetic field. The pseudo-critical line is defined by the points where the suscep-tibility shows a (finite) peak, corresponding to the rounding of the divergence observed forH=0,T =Tc.
We note that the equivalence between 2-flavor lattice QCD
and the 4-vector model is still not verified in comparisons of the respective numerical data (see e.g. [3] and references therein). Thus, a better knowledge of the magnetic equation of state for the 4-vector model is of great importance to achieve higher precision in this comparison, to verify if the equiva-lence really holds and/or to establish the nature of the QCD phase transition, recently claimed to be of first order [4].
Also in the case of the 2-vector (or XY) model, a high-precision nonperturbative determination of the equa-tion of state is of interest, since there are still discrep-ancies between the latest experimental and perturbative-renormalization-group values for critical quantities at the su-perfluid helium transition [5]. Note that both these determi-nations are very accurate, while the available nonperturbative values (from Monte Carlo simulations at zero magnetic field [6, 7]) are not as precise.
The Hamiltonian for theN-vector models is given by
H
= −J∑
<i,j>
Si·Sj −H·
∑
iSi, (1)
where the spin variablesSiare taken as vectors on a sphere of unit radius in anN-dimensional space. The main difference with respect to the Ising case is the possibility of configura-tions where the spins are locally aligned but for long distances this alignment is lost, yielding a null average for the magne-tization. Such configurations — calledspin waves— possess arbitrarily low energy and tend to destroy the order of the sys-tem even at low sys-temperatures. Ind=3 the models display a phase transition, with the presence of spontaneous magneti-zation below the critical temperature, but the spin waves lead to Goldstone-mode induced singularities, causing a diverging susceptibility and strong finite-size effects for allT<Tcwhen H→0.
Tereza Mendes and Attilio Cucchieri 649
can “measure” the actual magnetization of the system, with-out the need of an estimator such as the absolute value. In fact, the magnetic field already selects only one of the equivalent (zero-field) ground states that would lead to the same value of the estimator but would average to zero over the simulation in the zero-field case. The numerical simulation is done via cluster algorithm, which can be applied to the case of nonzero magnetic field by employing the ghost-spin trick. The observ-ables are the magnetization parallel to the magnetic field and the two susceptibilities (parallel and orthogonal toH).
We have recently proposed [10] an improved parametric form for the equation of state of the models. Our proposed form — inspired by perturbation theory — is a series expan-sion with two sets of terms, which contribute (mainly) sep-arately to the description of the high- and low-temperature regions of the phase diagram. In this way we achieve a bet-ter description of the low-temperature phase at zero magnetic field (i.e. the coexistence line), characterized by the singulari-ties described above. As a consequence, we are able to obtain a very precise characterization of the pseudo-critical line for the 4-vector model. We are currently applying the parame-trization to a study of theN=2 case. This will allow a better determination of the ratio of critical amplitudes for the spe-cific heat in the superfluid helium transition. Here we present preliminary results of this study, comparing the equations of state obtained for the casesN=2, 4.
II. THE MAGNETIC EQUATION OF STATE
At infinite volume, the scaling function for the singular part of the free energy is given by
Fs(t,h) = b−dFs(bytt,byhh), (2) wherebis arbitrary,t= (T−Tc)/T0,h=H/H0andyt,yhare related to the usual critical exponentsβandγ. The above form implies the relation between magnetization and the applied magnetic field, known as the magnetic equation of state
M/h1/δ=fM(t/h1/βδ). (3) Equivalently
y = f(x), (4)
withy=h/Mδ,x=tβ/M. The normalization constants are given by f(0) =1, f(−1) =0. In the case of theN-vector models, the singularities at low temperature determine the be-havior of the magnetization as the square root of H. This behavior (i.e. the Goldstone-mode effect) is included in the following Ansatz [11] for the equation of state at low values ofx
x=−1+a y1/2+b y+c y3/2+· · · (5) Note that these effects are present inN-vector models along the coexistence line, i.e. at low temperatures and small mag-netic field (or equivalently, at low values of the variablex).
The pseudo-critical line, described in the previous section, is given by finite peaks in the susceptibility. It characterizes the critical region when the external field is not zero (e.g. in the QCD case). The scaling form for the susceptibility along the pseudo-critical line is given by
χ=∂M/∂H = (1/H0)h1/δ−1fχ(t/h1/β). (6) Note theχhas a peak attpfor each fixedhand that
tp = zph1/βδ (7)
H0χp = h1/δ−1fχ(zp). (8) Thus, the location of pseudo-critical line is given byzp, ob-tained from the scaling function (or equation of state) for the susceptibility, which involves the derivative of fM(t/h1/βδ). Note also thatzpis a universal constant.
For the 4-vector and the 2-vector models, the equation of state was determined numerically respectively in [8] and [9], by taking into account the Goldstone-mode singularities and determining the location of the pseudo-critical line. The fitting function for f(x) =yused an interpolation of two forms: the Ansatz in Eq. (5) at lowxand Griffiths’s analyticity conditions at largex
x(y) =A y1/γ+B y(1−2β)/γ+
· · · (9) Then the equation of statefM(z) =M/h1/δis obtained from x(y). The problem is that the “transition” between the two fit-ting forms above is close to the pseudo-critical point, which is itself obtained from the equation of state for the susceptibility [defined in Eq. (6) above], involving a derivative. It would be therefore preferable to use a parametric form forf(x)without the need for interpolation, ensuring a smooth derivative and a better determination of the pseudo-critical pointzp. To this end we can consider the parametric form
M = m0Rβθ, (10)
t = R¡
1−θ2¢, (11)
H = h0Rβδh(θ). (12)
This yields
x=1−θ
2
θ2 0−1
µθ 0 θ
¶1/β
, f(x) =θ−δh(θ)
h(1), (13)
whereh(θ)is an odd function, with root given by θ0. This form was introduced in [12] by Guida & Zinn-Justin for the Ising model (therefore without considering the effect due to Goldstone modes at lowx) and used for perturbative studies of theN-vector case with the inclusion of the leading contri-bution ofθ0. The form leads to a smooth curve, and allows a direct relationship with critical amplitude ratios. We propose [10] an improved parametrization given by
h(θ) = θ¡
1−θ2/θ20 ¢2
(1+
n
∑
650 Brazilian Journal of Physics, vol. 36, no. 3A, September, 2006
0 3 6 9 12 15
-1 0 1 2 3 4 5
y
x
0 3 6 9
-1 0 1 2 3 4 5
y
x
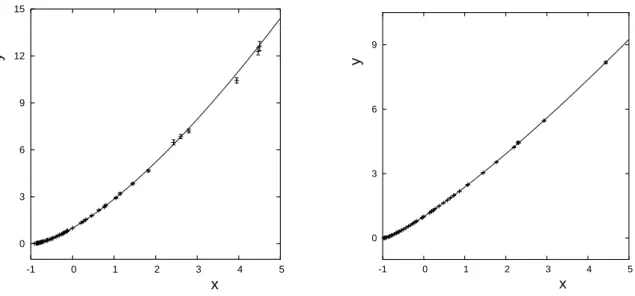
FIG. 1: Plot of the data together with the fitting form fory(x)in the 4-vector case (left panel) and in the 2-vector case (right panel).
×[1+ m
∑
j=1
dj(1−θ2/θ20)j]. (14)
The above form is based on the parametrization used pertur-batively in [12] for the Ising model, but takes into account terms associated with the effects of singularities induced by Goldstone modes, as discussed in the Introduction. These new terms are included by means of thedjcoefficients, associated with an expansion around the coexistence line. (Thedj’s are considered in addition to the usualci coefficients, related to the high-temperature/high-xbehavior.)
In Ref. [10] we have used the proposed form above for fits to existing Monte Carlo data for the 4-vector case. ¿From our fits we see thatdj’s are indeed necessary for the description of the data. Our best fit is obtained considering (in addition to
θ0) two coefficients of typecand two of typed θ2
0 = 2.17(4) (15)
c1 = 0.9(1), c2 = −0.62(7) (16) d1 = −1.56(4), d2=1.15(5). (17) We note that these results have errors that are one order of magnitude smaller than the perturbative description, and fit to the data with a value ofχ2per degree of freedom that is two orders of magnitude smaller. The fit is shown together with the data in Fig. 1 (left panel).
As explained above, the location of the pseudo-critical line (useful for comparison between QCD data and theN-vector model’s equation of state) is obtained from the peak in the scaling function for the susceptibility (see Eq. 6). The peak can be determined numerically from the two equations (13) by varyingθ. Our result is obtained with less than 1% of error
θp=0.587(2), zp=1.29(1), fχ(zp) =0.341(1). (18) The results are in agreement with previous determinations of zpandfχ(zp), but our error forzpis much smaller.
Next, we show our preliminary results for theN=2 case. We have produced new data, simulating the three-dimensional XY-model in the presence of a magnetic field by means of the (Wolff) cluster algorithm. We use the improved form of the model’s Hamiltonian, introduced by Hasenbusch and T¨or¨ok for the zero-field case in [6]. We also use their values for the critical temperature and critical exponents. When fitting the data to our parametrization of the equation of state, we find — regarding the role played by thecanddcoefficients — essen-tially the same characteristics as in theN=4 case described above, with the difference that in this case 6 parameters are needed. Our best fit is obtained using
θ20 = 3.25(2) (19)
c1 = 1.05(4), c2 = −0.11(3), c3 = 0.53(2) (20) d1 = −6.75(2), d2=14.7(2). (21)
We show the data together with the fit in Fig. 1 (right panel). We see that the slope of the curve is significantly higher for the N=4 case, corresponding to a stronger effect of Goldstone-mode singularities, as has already been found in [9]. Notice that the data in theN=2 case have smaller error bars, leading to a very precise determination of the curve. This will enable us to calculate (see e.g. [10]) the critical amplitude ratio of the specific heat with the same accuracy as the experimental and perturbative values. We quote our values for the location of the pseudo-critical region in the 2-vector case
Tereza Mendes and Attilio Cucchieri 651
III. CONCLUSIONS
We have introduced an improved parametric form for the description of the equation of state of 3d N-vector models. We show that the new parametric form indeed provides a better fit to the numerical data as compared to previous parametriza-tions. In particular, the consideration of thedjcoefficients is essential for a good description of the Monte Carlo data in the whole range of values ofx. Also, we were able to verify clearly the different roles played bycianddjparameters in the high- and low-xregions. Indeed, in this form the coefficients cianddjcontribute respectively to the high- (θ≈0) and low-(θ≈θ0) temperature regions. We also stress that, in addition to providing a better fit to the numerical data, the expression considered is a continuous function, needing no interpolation between the twoxregions. This is particularly useful for the determination of the pseudo-critical line, since the interpolat-ing form introduced in [8] is unstable precisely in this region.
In fact, our determination ofzpis very precise in comparison to the previous estimates from the interpolated form and the perturbative equation of state. As a consequence of a better determination of the pseudo-critical line in theN=4 case, one may get an unambiguous normalization of QCD data for com-parison to the 4-vector equation of state, showing better agree-ment for larger quark masses [3]. We are currently extending our analysis to theN=2 case. Our preliminary results, pre-sented here, confirm the fact that the equation of state can be obtained with very high precision using our method. This will allow a determination of the the critical amplitude ratio of the specific heat with the same accuracy as the experimental and perturbative values, which is of a few tenths of a percent [5].
Acknowledgments
This work was supported by FAPESP and CNPq.
[1] P.M. Chaikin and T.C. Lubensky,Principles of Condensed Mat-ter Physics(Cambridge Univ. Press, Cambridge, 1995). [2] R. Pisarski and F. Wilczek, Phys. Rev. D29, 338 (1984). [3] T. Mendes and A. Cucchieri, AIP Conf. Proc.739, 599 (2004);
T. Mendes, AIP Conf. Proc.756, 413 (2005).
[4] M. D’Elia, A. Di Giacomo, and C. Pica, Phys. Rev. D72, 114510 (2005).
[5] J.A. Lipa, J.A. Nissen, D.A. Stricker, D.R. Swanson, and T.C.P. Chui, Phys. Rev. B68, 174518 (2003).
[6] M. Hasenbusch and T. T¨or¨ok, J. Phys. A32, 6361 (1999).
[7] A. Cucchieri, J. Engels, S. Holtmann, T. Mendes, and T. Schulze, J. Phys. A35, 6517 (2002).
[8] J. Engels and T. Mendes, Nucl. Phys., B572, 289 (2000). [9] J. Engels, S. Holtmann, T. Mendes, and T. Schulze, Phys. Lett.